Mga Batayang Estadistika
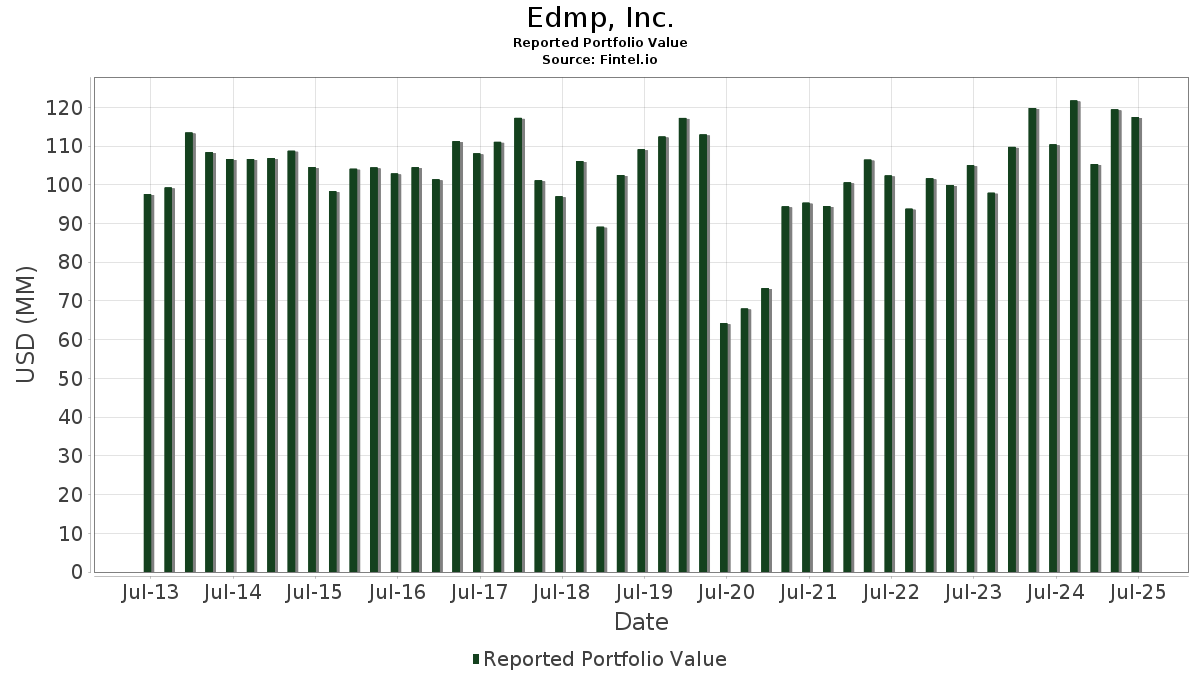
| Nilai Portofolio | $ 117,478,439 |
| Posisi Saat Ini | 69 |
Kepemilikan Terbaru, Kinerja, AUM (dari 13F, 13D)
Edmp, Inc. telah mengungkapkan total kepemilikan 69 dalam pengajuan SEC terbaru mereka. Nilai portofolio terbaru dihitung sebesar $ 117,478,439 USD. Aset yang Dikelola (AUM) sebenarnya adalah nilai ini ditambah kas (yang tidak diungkapkan). Aset-aset utama Edmp, Inc. adalah Broadcom Inc. (US:AVGO) , Altria Group, Inc. (US:MO) , AbbVie Inc. (US:ABBV) , UGI Corporation (US:UGI) , and Aflac Incorporated (US:AFL) . Posisi baru Edmp, Inc. meliputi: U.S. Bancorp (US:USB) , .
Peningkatan Tertinggi Kuartal Ini
Kami menggunakan perubahan dalam alokasi portofolio karena ini adalah metrik yang paling bermakna. Perubahan dapat disebabkan oleh perdagangan atau perubahan harga saham.
| Keamanan | Saham (MM) |
Nilai (Juta Dolar AS) |
Portfolio % | ΔPorsyento ng Portfolio |
|---|---|---|---|---|
| 0.03 | 9.27 | 7.8902 | 2.9894 | |
| 0.05 | 2.38 | 2.0255 | 0.8076 | |
| 0.02 | 2.36 | 2.0093 | 0.3832 | |
| 0.01 | 4.27 | 3.6376 | 0.3094 | |
| 0.01 | 1.74 | 1.4774 | 0.2532 | |
| 0.13 | 4.70 | 4.0029 | 0.2472 | |
| 0.00 | 0.25 | 0.2137 | 0.2137 | |
| 0.00 | 0.64 | 0.5451 | 0.2106 | |
| 0.01 | 0.24 | 0.2020 | 0.2020 | |
| 0.01 | 1.09 | 0.9284 | 0.1950 |
Penurunan Tertinggi Kuartal Ini
Kami menggunakan perubahan dalam alokasi portofolio karena ini adalah metrik yang paling bermakna. Perubahan dapat disebabkan oleh perdagangan atau perubahan harga saham.
| Keamanan | Saham (MM) |
Nilai (Juta Dolar AS) |
Portfolio % | ΔPorsyento ng Portfolio |
|---|---|---|---|---|
| 0.04 | 1.74 | 1.4847 | -0.5465 | |
| 0.03 | 4.73 | 4.0253 | -0.5014 | |
| 0.02 | 4.43 | 3.7692 | -0.4921 | |
| 0.20 | 0.85 | 0.7244 | -0.3536 | |
| 0.01 | 2.12 | 1.8050 | -0.3169 | |
| 0.02 | 1.71 | 1.4540 | -0.3099 | |
| 0.01 | 2.64 | 2.2465 | -0.2832 | |
| 0.02 | 1.41 | 1.2012 | -0.2361 | |
| 0.04 | 4.61 | 3.9227 | -0.2272 | |
| 0.05 | 1.00 | 0.8481 | -0.2267 |
Pengajuan 13F dan Dana
Formulir ini diajukan pada 2025-07-28 untuk periode pelaporan 2025-06-30. Klik ikon tautan untuk melihat riwayat transaksi selengkapnya.
Tingkatkan ke versi premium untuk membuka data premium dan ekspor ke Excel. ![]() .
.
| Keamanan | Ketik | Harga Saham Rata-rata | Saham (MM) |
ΔSaham (%) |
ΔSaham (%) |
Nilai ($MM) |
Portpolyo (%) |
ΔPortofolio (%) |
|
|---|---|---|---|---|---|---|---|---|---|
| AVGO / Broadcom Inc. | 0.03 | -3.81 | 9.27 | 58.39 | 7.8902 | 2.9894 | |||
| MO / Altria Group, Inc. | 0.09 | -1.95 | 5.29 | -4.24 | 4.5002 | -0.1218 | |||
| ABBV / AbbVie Inc. | 0.03 | -1.27 | 4.73 | -12.54 | 4.0253 | -0.5014 | |||
| UGI / UGI Corporation | 0.13 | -4.80 | 4.70 | 4.84 | 4.0029 | 0.2472 | |||
| AFL / Aflac Incorporated | 0.04 | -1.97 | 4.61 | -7.02 | 3.9227 | -0.2272 | |||
| AMGN / Amgen Inc. | 0.02 | -2.91 | 4.43 | -13.01 | 3.7692 | -0.4921 | |||
| OHI / Omega Healthcare Investors, Inc. | 0.12 | -1.45 | 4.30 | -5.14 | 3.6580 | -0.1358 | |||
| AMP / Ameriprise Financial, Inc. | 0.01 | -2.48 | 4.27 | 7.52 | 3.6376 | 0.3094 | |||
| T / AT&T Inc. | 0.11 | -6.91 | 3.09 | -4.75 | 2.6314 | -0.0858 | |||
| COR / Cencora, Inc. | 0.01 | -4.92 | 2.99 | 2.54 | 2.5480 | 0.1031 | |||
| NFG / National Fuel Gas Company | 0.03 | -3.46 | 2.92 | 3.29 | 2.4860 | 0.1181 | |||
| TFC / Truist Financial Corporation | 0.07 | -7.67 | 2.80 | -3.52 | 2.3826 | -0.0473 | |||
| O / Realty Income Corporation | 0.05 | -2.35 | 2.70 | -3.02 | 2.2946 | -0.0328 | |||
| ELV / Elevance Health, Inc. | 0.01 | -2.32 | 2.64 | -12.64 | 2.2465 | -0.2832 | |||
| SMCI / Super Micro Computer, Inc. | 0.05 | 14.29 | 2.38 | 63.62 | 2.0255 | 0.8076 | |||
| WHR / Whirlpool Corporation | 0.02 | 8.01 | 2.36 | 21.52 | 2.0093 | 0.3832 | |||
| CI / The Cigna Group | 0.01 | 0.65 | 2.24 | 1.13 | 1.9066 | 0.0523 | |||
| EPD / Enterprise Products Partners L.P. - Limited Partnership | 0.07 | -1.82 | 2.22 | -10.80 | 1.8916 | -0.1949 | |||
| CVX / Chevron Corporation | 0.01 | -2.24 | 2.12 | -16.34 | 1.8050 | -0.3169 | |||
| VZ / Verizon Communications Inc. | 0.05 | 3.65 | 2.04 | -1.12 | 1.7359 | 0.0088 | |||
| JNJ / Johnson & Johnson | 0.01 | 2.15 | 1.99 | -5.92 | 1.6918 | -0.0769 | |||
| DOX / Amdocs Limited | 0.02 | -2.17 | 1.90 | -2.47 | 1.6144 | -0.0134 | |||
| OGE / OGE Energy Corp. | 0.04 | -1.35 | 1.84 | -4.72 | 1.5631 | -0.0510 | |||
| BMY / Bristol-Myers Squibb Company | 0.04 | -5.26 | 1.74 | -28.08 | 1.4847 | -0.5465 | |||
| CAH / Cardinal Health, Inc. | 0.01 | -2.65 | 1.74 | 18.67 | 1.4774 | 0.2532 | |||
| AMZN / Amazon.com, Inc. | 0.01 | -10.47 | 1.73 | 3.23 | 1.4688 | 0.0693 | |||
| EMN / Eastman Chemical Company | 0.02 | -4.30 | 1.71 | -18.90 | 1.4540 | -0.3099 | |||
| MMM / 3M Company | 0.01 | -10.57 | 1.67 | -7.33 | 1.4220 | -0.0869 | |||
| ES / Eversource Energy | 0.03 | 4.83 | 1.62 | 7.38 | 1.3754 | 0.1155 | |||
| CTSH / Cognizant Technology Solutions Corporation | 0.02 | -3.17 | 1.61 | -1.23 | 1.3694 | 0.0056 | |||
| PEP / PepsiCo, Inc. | 0.01 | 12.94 | 1.61 | -0.56 | 1.3693 | 0.0150 | |||
| BWA / BorgWarner Inc. | 0.05 | -14.39 | 1.60 | 0.06 | 1.3632 | 0.0228 | |||
| CSCO / Cisco Systems, Inc. | 0.02 | -4.35 | 1.59 | 7.59 | 1.3519 | 0.1153 | |||
| CMI / Cummins Inc. | 0.00 | -12.34 | 1.59 | -8.37 | 1.3509 | -0.0999 | |||
| EBAY / eBay Inc. | 0.02 | -2.91 | 1.53 | 6.78 | 1.2999 | 0.1020 | |||
| OMC / Omnicom Group Inc. | 0.02 | -5.26 | 1.41 | -17.77 | 1.2012 | -0.2361 | |||
| AIZ / Assurant, Inc. | 0.01 | -3.05 | 1.35 | -8.74 | 1.1472 | -0.0891 | |||
| RY / Royal Bank of Canada | 0.01 | -8.95 | 1.33 | 6.24 | 1.1319 | 0.0841 | |||
| SJM / The J. M. Smucker Company | 0.01 | -1.89 | 1.17 | -18.65 | 0.9921 | -0.2074 | |||
| NTAP / NetApp, Inc. | 0.01 | 2.76 | 1.09 | 24.57 | 0.9284 | 0.1950 | |||
| FDX / FedEx Corporation | 0.00 | -8.77 | 1.08 | -14.96 | 0.9199 | -0.1438 | |||
| CAG / Conagra Brands, Inc. | 0.05 | 1.13 | 1.00 | -22.37 | 0.8481 | -0.2267 | |||
| MPW / Medical Properties Trust, Inc. | 0.20 | -7.52 | 0.85 | -33.88 | 0.7244 | -0.3536 | |||
| CMCSA / Comcast Corporation | 0.02 | -10.31 | 0.83 | -13.28 | 0.7061 | -0.0946 | |||
| C / Citigroup Inc. | 0.01 | 3.51 | 0.83 | 24.06 | 0.7027 | 0.1458 | |||
| MGA / Magna International Inc. | 0.02 | -2.16 | 0.82 | 11.08 | 0.7004 | 0.0805 | |||
| SF / Stifel Financial Corp. | 0.01 | -5.92 | 0.66 | 3.62 | 0.5616 | 0.0283 | |||
| JBL / Jabil Inc. | 0.00 | 0.00 | 0.64 | 60.40 | 0.5451 | 0.2106 | |||
| CCK / Crown Holdings, Inc. | 0.01 | -7.36 | 0.64 | 6.89 | 0.5418 | 0.0432 | |||
| GPN / Global Payments Inc. | 0.01 | -11.37 | 0.60 | -27.52 | 0.5135 | -0.1838 | |||
| JPM / JPMorgan Chase & Co. | 0.00 | 0.00 | 0.46 | 18.25 | 0.3921 | 0.0658 | |||
| BABA / Alibaba Group Holding Limited - Depositary Receipt (Common Stock) | 0.00 | 0.73 | 0.44 | -13.73 | 0.3751 | -0.0520 | |||
| EBGEF / Enbridge Inc. - Preferred Stock | 0.01 | 0.00 | 0.37 | 2.22 | 0.3149 | 0.0120 | |||
| ADM / Archer-Daniels-Midland Company | 0.01 | 3.40 | 0.35 | 13.46 | 0.3020 | 0.0407 | |||
| LEA / Lear Corporation | 0.00 | 0.00 | 0.35 | 7.76 | 0.2959 | 0.0255 | |||
| CNC / Centene Corporation | 0.01 | 0.00 | 0.35 | -10.62 | 0.2943 | -0.0295 | |||
| TKR / The Timken Company | 0.00 | -13.14 | 0.35 | -12.44 | 0.2942 | -0.0359 | |||
| GIS / General Mills, Inc. | 0.01 | 0.00 | 0.32 | -13.28 | 0.2729 | -0.0369 | |||
| PFE / Pfizer Inc. | 0.01 | -10.41 | 0.29 | -14.50 | 0.2466 | -0.0365 | |||
| WU / The Western Union Company | 0.03 | -22.71 | 0.29 | -38.58 | 0.2432 | -0.1457 | |||
| RJF / Raymond James Financial, Inc. | 0.00 | 0.00 | 0.25 | 10.43 | 0.2170 | 0.0237 | |||
| TRV / The Travelers Companies, Inc. | 0.00 | 0.00 | 0.25 | 1.20 | 0.2152 | 0.0060 | |||
| TGT / Target Corporation | 0.00 | 0.25 | 0.2137 | 0.2137 | |||||
| EEFT / Euronet Worldwide, Inc. | 0.00 | -2.46 | 0.24 | -7.31 | 0.2054 | -0.0129 | |||
| USB / U.S. Bancorp | 0.01 | 0.24 | 0.2020 | 0.2020 | |||||
| PHM / PulteGroup, Inc. | 0.00 | 0.00 | 0.22 | 2.80 | 0.1877 | 0.0077 | |||
| WSM / Williams-Sonoma, Inc. | 0.00 | 0.00 | 0.22 | 2.87 | 0.1838 | 0.0088 | |||
| META / Meta Platforms, Inc. | 0.00 | -18.66 | 0.22 | 4.37 | 0.1835 | 0.0102 | |||
| BTI / British American Tobacco p.l.c. - Depositary Receipt (Common Stock) | 0.00 | -38.26 | 0.20 | -29.58 | 0.1708 | -0.0671 | |||
| PM / Philip Morris International Inc. | 0.00 | -100.00 | 0.00 | 0.0000 | |||||
| SWKS / Skyworks Solutions, Inc. | 0.00 | -100.00 | 0.00 | 0.0000 | |||||
| CPRX / Catalyst Pharmaceuticals, Inc. | 0.00 | -100.00 | 0.00 | -100.00 | -0.1692 | ||||
| AES / The AES Corporation | 0.00 | -100.00 | 0.00 | 0.0000 |