Mga Batayang Estadistika
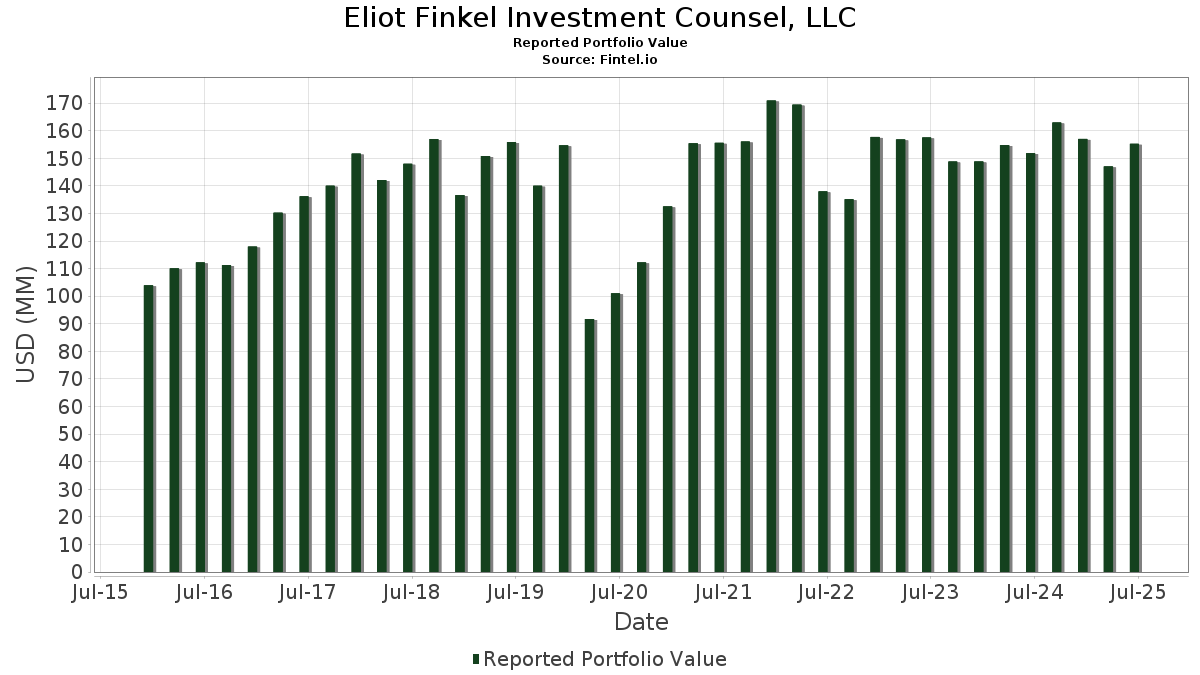
| Nilai Portofolio | $ 155,249,075 |
| Posisi Saat Ini | 32 |
Kepemilikan Terbaru, Kinerja, AUM (dari 13F, 13D)
Eliot Finkel Investment Counsel, LLC telah mengungkapkan total kepemilikan 32 dalam pengajuan SEC terbaru mereka. Nilai portofolio terbaru dihitung sebesar $ 155,249,075 USD. Aset yang Dikelola (AUM) sebenarnya adalah nilai ini ditambah kas (yang tidak diungkapkan). Aset-aset utama Eliot Finkel Investment Counsel, LLC adalah Eaton Corporation plc (US:ETN) , Deere & Company (US:DE) , Norfolk Southern Corporation (US:NSC) , Corning Incorporated (US:GLW) , and General Dynamics Corporation (US:GD) . Posisi baru Eliot Finkel Investment Counsel, LLC meliputi: The Campbell's Company (US:CPB) , EOG Resources, Inc. (US:EOG) , .
Peningkatan Tertinggi Kuartal Ini
Kami menggunakan perubahan dalam alokasi portofolio karena ini adalah metrik yang paling bermakna. Perubahan dapat disebabkan oleh perdagangan atau perubahan harga saham.
| Keamanan | Saham (MM) |
Nilai (Juta Dolar AS) |
Portfolio % | ΔPorsyento ng Portfolio |
|---|---|---|---|---|
| 0.17 | 5.07 | 3.2689 | 3.2689 | |
| 0.02 | 2.73 | 1.7601 | 1.7601 | |
| 0.04 | 13.60 | 8.7621 | 1.6188 | |
| 0.02 | 4.13 | 2.6612 | 0.4329 | |
| 0.15 | 8.08 | 5.2020 | 0.3301 | |
| 0.01 | 3.45 | 2.2231 | 0.2179 | |
| 0.04 | 2.85 | 1.8332 | 0.0554 | |
| 0.03 | 8.32 | 5.3602 | 0.0430 | |
| 0.01 | 1.31 | 0.8452 | 0.0298 | |
| 0.02 | 11.28 | 7.2630 | 0.0252 |
Penurunan Tertinggi Kuartal Ini
Kami menggunakan perubahan dalam alokasi portofolio karena ini adalah metrik yang paling bermakna. Perubahan dapat disebabkan oleh perdagangan atau perubahan harga saham.
| Keamanan | Saham (MM) |
Nilai (Juta Dolar AS) |
Portfolio % | ΔPorsyento ng Portfolio |
|---|---|---|---|---|
| 0.03 | 7.11 | 4.5775 | -0.8397 | |
| 0.14 | 4.48 | 2.8843 | -0.7131 | |
| 0.07 | 5.22 | 3.3632 | -0.6785 | |
| 0.06 | 4.40 | 2.8354 | -0.6596 | |
| 0.02 | 6.82 | 4.3934 | -0.6393 | |
| 0.14 | 3.62 | 2.3346 | -0.6218 | |
| 0.02 | 6.43 | 4.1414 | -0.5088 | |
| 0.04 | 4.04 | 2.6023 | -0.4339 | |
| 0.05 | 5.72 | 3.6825 | -0.3932 | |
| 0.07 | 6.33 | 4.0748 | -0.3443 |
Pengajuan 13F dan Dana
Formulir ini diajukan pada 2025-07-22 untuk periode pelaporan 2025-06-30. Klik ikon tautan untuk melihat riwayat transaksi selengkapnya.
Tingkatkan ke versi premium untuk membuka data premium dan ekspor ke Excel. ![]() .
.
| Keamanan | Ketik | Harga Saham Rata-rata | Saham (MM) |
ΔSaham (%) |
ΔSaham (%) |
Nilai ($MM) |
Portpolyo (%) |
ΔPortofolio (%) |
|
|---|---|---|---|---|---|---|---|---|---|
| ETN / Eaton Corporation plc | 0.04 | -1.38 | 13.60 | 29.52 | 8.7621 | 1.6188 | |||
| DE / Deere & Company | 0.02 | -2.21 | 11.28 | 5.95 | 7.2630 | 0.0252 | |||
| NSC / Norfolk Southern Corporation | 0.03 | -1.51 | 8.32 | 6.43 | 5.3602 | 0.0430 | |||
| GLW / Corning Incorporated | 0.15 | -1.86 | 8.08 | 12.73 | 5.2020 | 0.3301 | |||
| GD / General Dynamics Corporation | 0.03 | -1.46 | 7.75 | 5.43 | 4.9939 | -0.0071 | |||
| AMGN / Amgen Inc. | 0.03 | -0.45 | 7.11 | -10.78 | 4.5775 | -0.8397 | |||
| MCD / McDonald's Corporation | 0.02 | -1.46 | 6.82 | -7.84 | 4.3934 | -0.6393 | |||
| ITW / Illinois Tool Works Inc. | 0.03 | -1.04 | 6.62 | -1.34 | 4.2634 | -0.2991 | |||
| APD / Air Products and Chemicals, Inc. | 0.02 | -1.68 | 6.43 | -5.97 | 4.1414 | -0.5088 | |||
| PCAR / PACCAR Inc | 0.07 | -0.28 | 6.33 | -2.63 | 4.0748 | -0.3443 | |||
| DUK / Duke Energy Corporation | 0.05 | -1.39 | 5.72 | -4.61 | 3.6825 | -0.3932 | |||
| MRK / Merck & Co., Inc. | 0.07 | -0.38 | 5.22 | -12.15 | 3.3632 | -0.6785 | |||
| CPB / The Campbell's Company | 0.17 | 5.07 | 3.2689 | 3.2689 | |||||
| USB / U.S. Bancorp | 0.11 | -2.32 | 4.82 | 4.69 | 3.1065 | -0.0264 | |||
| DVN / Devon Energy Corporation | 0.14 | -0.47 | 4.48 | -15.35 | 2.8843 | -0.7131 | |||
| OMC / Omnicom Group Inc. | 0.06 | -1.28 | 4.40 | -14.34 | 2.8354 | -0.6596 | |||
| AMAT / Applied Materials, Inc. | 0.02 | -0.04 | 4.13 | 26.10 | 2.6612 | 0.4329 | |||
| UPS / United Parcel Service, Inc. | 0.04 | -1.39 | 4.04 | -9.50 | 2.6023 | -0.4339 | |||
| KHC / The Kraft Heinz Company | 0.14 | -1.74 | 3.62 | -16.63 | 2.3346 | -0.6218 | |||
| LMT / Lockheed Martin Corporation | 0.01 | -1.84 | 3.58 | 1.76 | 2.3075 | -0.0864 | |||
| HSY / The Hershey Company | 0.02 | -0.64 | 3.50 | -3.58 | 2.2549 | -0.2145 | |||
| ADI / Analog Devices, Inc. | 0.01 | -0.82 | 3.45 | 17.06 | 2.2231 | 0.2179 | |||
| CHRW / C.H. Robinson Worldwide, Inc. | 0.04 | -0.79 | 3.39 | -7.03 | 2.1817 | -0.2961 | |||
| AEP / American Electric Power Company, Inc. | 0.03 | -2.74 | 3.17 | -7.65 | 2.0387 | -0.2920 | |||
| CSCO / Cisco Systems, Inc. | 0.04 | -3.16 | 2.85 | 8.84 | 1.8332 | 0.0554 | |||
| EOG / EOG Resources, Inc. | 0.02 | 2.73 | 1.7601 | 1.7601 | |||||
| AMCR / Amcor plc | 0.26 | -4.11 | 2.35 | -9.18 | 1.5117 | -0.2451 | |||
| STAG / STAG Industrial, Inc. | 0.06 | -1.13 | 2.18 | -0.73 | 1.4074 | -0.0890 | |||
| AAPL / Apple Inc. | 0.01 | -10.21 | 1.44 | -17.07 | 0.9297 | -0.2539 | |||
| RTX / RTX Corporation | 0.01 | -0.72 | 1.31 | 9.52 | 0.8452 | 0.0298 | |||
| PEP / PepsiCo, Inc. | 0.01 | -1.96 | 1.05 | -13.67 | 0.6796 | -0.1515 | |||
| SPY / SPDR S&P 500 ETF | 0.00 | 0.00 | 0.40 | 10.56 | 0.2567 | 0.0113 |