Mga Batayang Estadistika
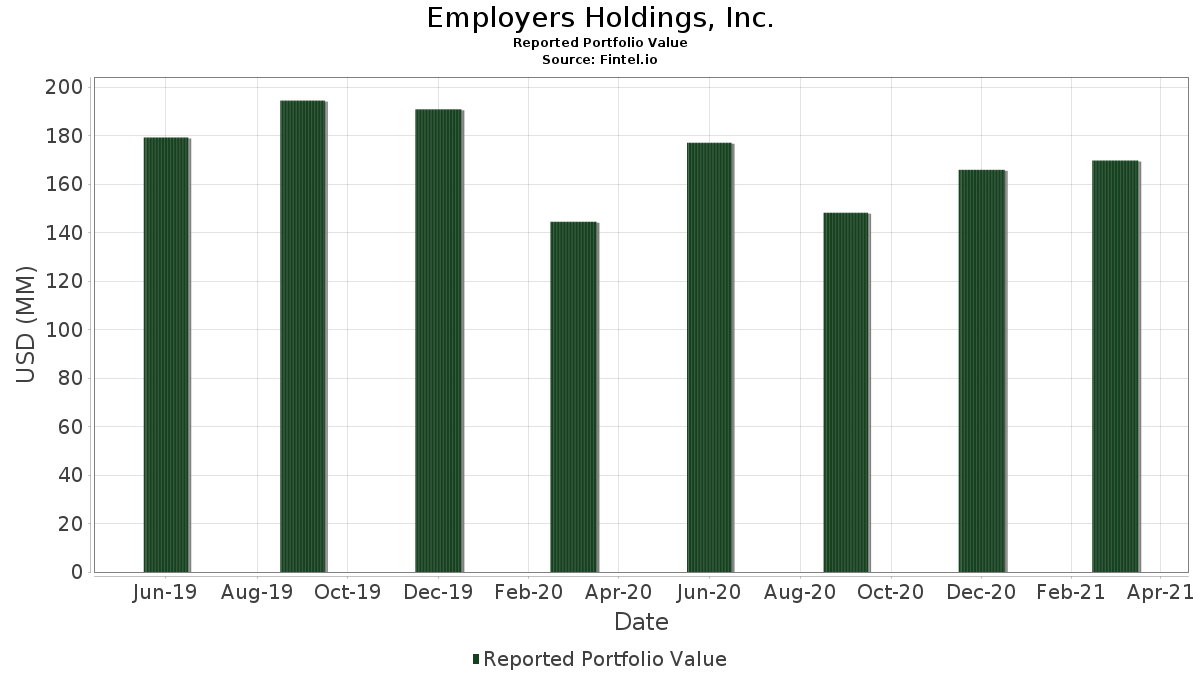
| Nilai Portofolio | $ 169,701,000 |
| Posisi Saat Ini | 144 |
Kepemilikan Terbaru, Kinerja, AUM (dari 13F, 13D)
Employers Holdings, Inc. telah mengungkapkan total kepemilikan 144 dalam pengajuan SEC terbaru mereka. Nilai portofolio terbaru dihitung sebesar $ 169,701,000 USD. Aset yang Dikelola (AUM) sebenarnya adalah nilai ini ditambah kas (yang tidak diungkapkan). Aset-aset utama Employers Holdings, Inc. adalah Apple Inc. (US:AAPL) , Microsoft Corporation (US:MSFT) , JPMorgan Chase & Co. (US:JPM) , Amazon.com, Inc. (US:AMZN) , and UnitedHealth Group Incorporated (US:UNH) . Posisi baru Employers Holdings, Inc. meliputi: Marsh & McLennan Companies, Inc. (US:MMC) , Park Hotels & Resorts Inc. (US:PK) , .
Peningkatan Tertinggi Kuartal Ini
Kami menggunakan perubahan dalam alokasi portofolio karena ini adalah metrik yang paling bermakna. Perubahan dapat disebabkan oleh perdagangan atau perubahan harga saham.
| Keamanan | Saham (MM) |
Nilai (Juta Dolar AS) |
Portfolio % | ΔPorsyento ng Portfolio |
|---|---|---|---|---|
| 0.04 | 6.82 | 4.0182 | 0.5865 | |
| 0.06 | 2.35 | 1.3848 | 0.2748 | |
| 0.00 | 1.73 | 1.0218 | 0.2700 | |
| 0.00 | 3.28 | 1.9346 | 0.2585 | |
| 0.00 | 3.29 | 1.9411 | 0.2535 | |
| 0.01 | 0.39 | 0.2316 | 0.2316 | |
| 0.04 | 10.34 | 6.0942 | 0.2123 | |
| 0.02 | 1.86 | 1.0960 | 0.1923 | |
| 0.00 | 0.26 | 0.1550 | 0.1550 | |
| 0.00 | 0.25 | 0.1456 | 0.1456 |
Penurunan Tertinggi Kuartal Ini
Kami menggunakan perubahan dalam alokasi portofolio karena ini adalah metrik yang paling bermakna. Perubahan dapat disebabkan oleh perdagangan atau perubahan harga saham.
| Keamanan | Saham (MM) |
Nilai (Juta Dolar AS) |
Portfolio % | ΔPorsyento ng Portfolio |
|---|---|---|---|---|
| 0.10 | 12.69 | 7.4767 | -0.8325 | |
| 0.00 | 0.38 | 0.2257 | -0.5738 | |
| 0.01 | 0.28 | 0.1674 | -0.3210 | |
| 0.00 | 6.58 | 3.8798 | -0.2990 | |
| 0.02 | 2.12 | 1.2475 | -0.2188 | |
| 0.00 | 0.56 | 0.3306 | -0.2060 | |
| 0.00 | 0.00 | -0.1996 | ||
| 0.01 | 1.33 | 0.7820 | -0.1869 | |
| 0.00 | 0.00 | -0.1676 | ||
| 0.00 | 0.00 | -0.1393 |
Pengajuan 13F dan Dana
Formulir ini diajukan pada 2021-04-30 untuk periode pelaporan 2021-03-31. Klik ikon tautan untuk melihat riwayat transaksi selengkapnya.
Tingkatkan ke versi premium untuk membuka data premium dan ekspor ke Excel. ![]() .
.
| Keamanan | Ketik | Harga Saham Rata-rata | Saham (MM) |
ΔSaham (%) |
ΔSaham (%) |
Nilai ($MM) |
Portpolyo (%) |
ΔPortofolio (%) |
|
|---|---|---|---|---|---|---|---|---|---|
| AAPL / Apple Inc. | 0.10 | 0.00 | 12.69 | -7.94 | 7.4767 | -0.8325 | |||
| MSFT / Microsoft Corporation | 0.04 | 0.00 | 10.34 | 6.01 | 6.0942 | 0.2123 | |||
| JPM / JPMorgan Chase & Co. | 0.04 | 0.00 | 6.82 | 19.80 | 4.0182 | 0.5865 | |||
| AMZN / Amazon.com, Inc. | 0.00 | 0.00 | 6.58 | -5.01 | 3.8798 | -0.2990 | |||
| UNH / UnitedHealth Group Incorporated | 0.01 | 0.00 | 4.67 | 6.08 | 2.7537 | 0.0979 | |||
| JNJ / Johnson & Johnson | 0.02 | 0.00 | 3.77 | 4.43 | 2.2216 | 0.0451 | |||
| GOOGL / Alphabet Inc. | 0.00 | 0.00 | 3.29 | 17.68 | 1.9411 | 0.2535 | |||
| GOOG / Alphabet Inc. | 0.00 | 0.00 | 3.28 | 18.09 | 1.9346 | 0.2585 | |||
| UNP / Union Pacific Corporation | 0.01 | 0.00 | 3.25 | 5.86 | 1.9157 | 0.0642 | |||
| DHR / Danaher Corporation | 0.01 | 0.00 | 3.02 | 1.31 | 1.7767 | -0.0176 | |||
| BAC / Bank of America Corporation | 0.06 | 0.00 | 2.35 | 27.65 | 1.3848 | 0.2748 | |||
| T / AT&T Inc. | 0.08 | 0.00 | 2.30 | 5.27 | 1.3547 | 0.0380 | |||
| PG / The Procter & Gamble Company | 0.02 | 0.00 | 2.25 | -2.68 | 1.3282 | -0.0681 | |||
| TXN / Texas Instruments Incorporated | 0.01 | 0.00 | 2.19 | 15.16 | 1.2935 | 0.1443 | |||
| QCOM / QUALCOMM Incorporated | 0.02 | 0.00 | 2.12 | -12.95 | 1.2475 | -0.2188 | |||
| INTC / Intel Corporation | 0.03 | -23.61 | 2.07 | -1.85 | 1.2198 | -0.0517 | |||
| HON / Honeywell International Inc. | 0.01 | 0.00 | 2.06 | 2.03 | 1.2151 | -0.0034 | |||
| PEP / PepsiCo, Inc. | 0.01 | 0.00 | 2.04 | -4.68 | 1.2003 | -0.0881 | |||
| BRK.B / Berkshire Hathaway Inc. | 0.01 | 0.00 | 1.93 | 10.15 | 1.1379 | 0.0810 | |||
| META / Meta Platforms, Inc. | 0.01 | 2.67 | 1.93 | 10.74 | 1.1361 | 0.0865 | |||
| DIS / The Walt Disney Company | 0.01 | 6.42 | 1.93 | 8.38 | 1.1349 | 0.0636 | |||
| NKE / NIKE, Inc. | 0.01 | 0.00 | 1.89 | -6.10 | 1.1161 | -0.1000 | |||
| PYPL / PayPal Holdings, Inc. | 0.01 | 0.00 | 1.88 | 3.70 | 1.1055 | 0.0148 | |||
| CVX / Chevron Corporation | 0.02 | 0.00 | 1.86 | 24.08 | 1.0960 | 0.1923 | |||
| SYK / Stryker Corporation | 0.01 | 0.00 | 1.78 | -0.61 | 1.0519 | -0.0310 | |||
| DE / Deere & Company | 0.00 | 0.00 | 1.73 | 39.05 | 1.0218 | 0.2700 | |||
| ADM / Archer-Daniels-Midland Company | 0.03 | 0.00 | 1.72 | 13.05 | 1.0106 | 0.0960 | |||
| SBUX / Starbucks Corporation | 0.02 | 0.00 | 1.71 | 2.16 | 1.0047 | -0.0015 | |||
| AXP / American Express Company | 0.01 | 0.00 | 1.63 | 16.97 | 0.9587 | 0.1201 | |||
| CSCO / Cisco Systems, Inc. | 0.03 | 0.00 | 1.60 | 15.58 | 0.9440 | 0.1084 | |||
| MRK / Merck & Co., Inc. | 0.02 | 0.00 | 1.60 | -5.77 | 0.9428 | -0.0809 | |||
| MMM / 3M Company | 0.01 | 0.00 | 1.51 | 10.21 | 0.8904 | 0.0638 | |||
| APD / Air Products and Chemicals, Inc. | 0.01 | 0.00 | 1.48 | 2.99 | 0.8727 | 0.0057 | |||
| VZ / Verizon Communications Inc. | 0.03 | 0.00 | 1.47 | -1.01 | 0.8686 | -0.0291 | |||
| ANTM / Anthem Inc | 0.00 | 0.00 | 1.42 | 11.78 | 0.8385 | 0.0710 | |||
| ABBV / AbbVie Inc. | 0.01 | 0.00 | 1.38 | 0.95 | 0.8132 | -0.0110 | |||
| PFE / Pfizer Inc. | 0.04 | 0.00 | 1.38 | -1.57 | 0.8126 | -0.0321 | |||
| DUK / Duke Energy Corporation | 0.01 | 0.00 | 1.35 | 5.46 | 0.7967 | 0.0238 | |||
| COST / Costco Wholesale Corporation | 0.00 | 0.00 | 1.35 | -6.46 | 0.7932 | -0.0744 | |||
| IBM / International Business Machines Corporation | 0.01 | -22.04 | 1.33 | -17.42 | 0.7820 | -0.1869 | |||
| PPG / PPG Industries, Inc. | 0.01 | 0.00 | 1.29 | 4.19 | 0.7613 | 0.0137 | |||
| NFLX / Netflix, Inc. | 0.00 | 0.00 | 1.21 | -3.52 | 0.7101 | -0.0430 | |||
| FTV / Fortive Corporation | 0.02 | 0.00 | 1.20 | -0.25 | 0.7083 | -0.0182 | |||
| CMCSA / Comcast Corporation | 0.02 | 0.00 | 1.18 | 3.32 | 0.6959 | 0.0068 | |||
| TRV / The Travelers Companies, Inc. | 0.01 | 0.00 | 1.16 | 7.14 | 0.6806 | 0.0307 | |||
| AVGO / Broadcom Inc. | 0.00 | -3.12 | 1.15 | 2.59 | 0.6777 | 0.0018 | |||
| BMY / Bristol-Myers Squibb Company | 0.02 | 0.00 | 1.13 | 1.80 | 0.6659 | -0.0033 | |||
| D / Dominion Energy, Inc. | 0.01 | 0.00 | 1.08 | 1.02 | 0.6394 | -0.0082 | |||
| LIN / Linde plc | 0.00 | 0.00 | 1.01 | 6.32 | 0.5952 | 0.0224 | |||
| CRM / Salesforce, Inc. | 0.00 | 0.00 | 1.00 | -4.84 | 0.5910 | -0.0444 | |||
| PAYX / Paychex, Inc. | 0.01 | 0.00 | 0.99 | 5.20 | 0.5840 | 0.0160 | |||
| PM / Philip Morris International Inc. | 0.01 | 0.00 | 0.95 | 7.22 | 0.5598 | 0.0256 | |||
| ADP / Automatic Data Processing, Inc. | 0.00 | 0.00 | 0.94 | 7.05 | 0.5551 | 0.0245 | |||
| CVS / CVS Health Corporation | 0.01 | 0.00 | 0.90 | 10.13 | 0.5315 | 0.0377 | |||
| GILD / Gilead Sciences, Inc. | 0.01 | 0.00 | 0.90 | 10.89 | 0.5280 | 0.0408 | |||
| PNC / The PNC Financial Services Group, Inc. | 0.00 | 0.00 | 0.86 | 17.81 | 0.5068 | 0.0667 | |||
| TMO / Thermo Fisher Scientific Inc. | 0.00 | 0.00 | 0.85 | -1.95 | 0.5032 | -0.0219 | |||
| MO / Altria Group, Inc. | 0.02 | 0.00 | 0.85 | 24.89 | 0.4997 | 0.0903 | |||
| COP / ConocoPhillips | 0.02 | 0.00 | 0.83 | 32.32 | 0.4873 | 0.1105 | |||
| ORCL / Oracle Corporation | 0.01 | 0.00 | 0.82 | 8.48 | 0.4826 | 0.0274 | |||
| AMP / Ameriprise Financial, Inc. | 0.00 | 0.00 | 0.81 | 19.58 | 0.4750 | 0.0686 | |||
| OMC / Omnicom Group Inc. | 0.01 | 0.00 | 0.80 | 18.93 | 0.4738 | 0.0662 | |||
| MDT / Medtronic plc | 0.01 | 0.00 | 0.80 | 0.88 | 0.4732 | -0.0067 | |||
| AZO / AutoZone, Inc. | 0.00 | 0.00 | 0.80 | 18.34 | 0.4714 | 0.0639 | |||
| BA / The Boeing Company | 0.00 | 0.00 | 0.79 | 19.12 | 0.4626 | 0.0653 | |||
| PPL / PPL Corporation | 0.03 | -18.17 | 0.79 | -16.31 | 0.4626 | -0.1029 | |||
| KO / The Coca-Cola Company | 0.01 | 0.00 | 0.78 | -3.92 | 0.4620 | -0.0300 | |||
| BRK.A / Berkshire Hathaway Inc. | 0.00 | 0.00 | 0.77 | 10.78 | 0.4543 | 0.0347 | |||
| YUM / Yum! Brands, Inc. | 0.01 | 0.00 | 0.77 | -0.26 | 0.4526 | -0.0117 | |||
| INTU / Intuit Inc. | 0.00 | 0.00 | 0.77 | 0.79 | 0.4514 | -0.0068 | |||
| HIG / The Hartford Insurance Group, Inc. | 0.01 | 0.00 | 0.76 | 36.31 | 0.4490 | 0.1120 | |||
| MCD / McDonald's Corporation | 0.00 | 0.00 | 0.75 | 4.44 | 0.4431 | 0.0090 | |||
| KHC / The Kraft Heinz Company | 0.02 | 0.00 | 0.73 | 15.48 | 0.4308 | 0.0491 | |||
| SO / The Southern Company | 0.01 | 0.00 | 0.72 | 1.12 | 0.4260 | -0.0050 | |||
| NEE / NextEra Energy, Inc. | 0.01 | 0.00 | 0.69 | -1.99 | 0.4066 | -0.0178 | |||
| BBY / Best Buy Co., Inc. | 0.01 | 0.00 | 0.68 | 14.94 | 0.3989 | 0.0438 | |||
| ADBE / Adobe Inc. | 0.00 | 0.00 | 0.67 | -4.98 | 0.3936 | -0.0302 | |||
| ISRG / Intuitive Surgical, Inc. | 0.00 | 0.00 | 0.67 | -9.65 | 0.3919 | -0.0519 | |||
| LMT / Lockheed Martin Corporation | 0.00 | 0.00 | 0.65 | 4.01 | 0.3818 | 0.0062 | |||
| CB / Chubb Limited | 0.00 | -8.82 | 0.65 | -6.52 | 0.3801 | -0.0359 | |||
| BK / The Bank of New York Mellon Corporation | 0.01 | 0.00 | 0.64 | 11.44 | 0.3789 | 0.0310 | |||
| BIIB / Biogen Inc. | 0.00 | 0.00 | 0.64 | 14.23 | 0.3783 | 0.0395 | |||
| PSX / Phillips 66 | 0.01 | 0.00 | 0.64 | 16.67 | 0.3754 | 0.0462 | |||
| NOC / Northrop Grumman Corporation | 0.00 | 0.00 | 0.63 | 6.20 | 0.3736 | 0.0137 | |||
| AMT / American Tower Corporation | 0.00 | 0.00 | 0.62 | 6.47 | 0.3683 | 0.0144 | |||
| AFL / Aflac Incorporated | 0.01 | 0.00 | 0.62 | 15.10 | 0.3683 | 0.0409 | |||
| SPGI / S&P Global Inc. | 0.00 | 0.00 | 0.60 | 7.33 | 0.3536 | 0.0165 | |||
| TJX / The TJX Companies, Inc. | 0.01 | 0.00 | 0.58 | -3.16 | 0.3430 | -0.0194 | |||
| USB / U.S. Bancorp | 0.01 | 0.00 | 0.56 | 18.74 | 0.3323 | 0.0460 | |||
| WHR / Whirlpool Corporation | 0.00 | 0.00 | 0.56 | 22.17 | 0.3312 | 0.0538 | |||
| WMT / Walmart Inc. | 0.00 | -33.05 | 0.56 | -36.97 | 0.3306 | -0.2060 | |||
| PH / Parker-Hannifin Corporation | 0.00 | 0.00 | 0.50 | 15.90 | 0.2964 | 0.0347 | |||
| ABT / Abbott Laboratories | 0.00 | 0.00 | 0.49 | 9.56 | 0.2905 | 0.0192 | |||
| EBAY / eBay Inc. | 0.01 | 0.00 | 0.49 | 21.84 | 0.2893 | 0.0464 | |||
| MU / Micron Technology, Inc. | 0.01 | 0.00 | 0.48 | 17.24 | 0.2805 | 0.0357 | |||
| MET / MetLife, Inc. | 0.01 | 0.00 | 0.47 | 29.51 | 0.2793 | 0.0587 | |||
| GIS / General Mills, Inc. | 0.01 | 0.00 | 0.47 | 4.19 | 0.2787 | 0.0050 | |||
| FAST / Fastenal Company | 0.01 | 0.00 | 0.46 | 2.88 | 0.2734 | 0.0015 | |||
| MDLZ / Mondelez International, Inc. | 0.01 | 0.00 | 0.46 | 0.00 | 0.2728 | -0.0063 | |||
| AMGN / Amgen Inc. | 0.00 | 0.00 | 0.46 | 8.24 | 0.2711 | 0.0148 | |||
| ADS / Bread Financial Holdings Inc | 0.00 | 0.00 | 0.43 | 51.06 | 0.2528 | 0.0816 | |||
| STX / Seagate Technology Holdings plc | 0.01 | 0.00 | 0.42 | 23.60 | 0.2469 | 0.0425 | |||
| CAH / Cardinal Health, Inc. | 0.01 | 0.00 | 0.41 | 13.26 | 0.2416 | 0.0234 | |||
| MS / Morgan Stanley | 0.01 | 0.00 | 0.39 | 13.26 | 0.2316 | 0.2316 | |||
| V / Visa Inc. | 0.00 | -70.15 | 0.38 | -71.12 | 0.2257 | -0.5738 | |||
| FISV / Fiserv, Inc. | 0.00 | 0.00 | 0.38 | 4.67 | 0.2245 | 0.0051 | |||
| LHX / L3Harris Technologies, Inc. | 0.00 | 0.00 | 0.37 | 7.31 | 0.2163 | 0.0101 | |||
| FIS / Fidelity National Information Services, Inc. | 0.00 | -21.41 | 0.36 | -22.03 | 0.2127 | -0.0664 | |||
| NVDA / NVIDIA Corporation | 0.00 | 0.00 | 0.36 | 2.27 | 0.2121 | -0.0001 | |||
| SYY / Sysco Corporation | 0.00 | 0.00 | 0.36 | 5.93 | 0.2104 | 0.0072 | |||
| ADI / Analog Devices, Inc. | 0.00 | 0.00 | 0.34 | 4.92 | 0.2009 | 0.0050 | |||
| TGT / Target Corporation | 0.00 | 0.00 | 0.34 | 12.04 | 0.1974 | 0.0171 | |||
| KLAC / KLA Corporation | 0.00 | 0.00 | 0.33 | 27.69 | 0.1956 | 0.0389 | |||
| MSI / Motorola Solutions, Inc. | 0.00 | 0.00 | 0.33 | 10.81 | 0.1933 | 0.0148 | |||
| AJG / Arthur J. Gallagher & Co. | 0.00 | 0.00 | 0.33 | 0.93 | 0.1915 | -0.0026 | |||
| GRMN / Garmin Ltd. | 0.00 | 0.00 | 0.32 | 9.97 | 0.1886 | 0.0131 | |||
| CME / CME Group Inc. | 0.00 | 0.00 | 0.30 | 12.13 | 0.1797 | 0.0157 | |||
| CLX / The Clorox Company | 0.00 | 0.00 | 0.30 | -4.47 | 0.1762 | -0.0125 | |||
| EXC / Exelon Corporation | 0.01 | -66.12 | 0.28 | -64.94 | 0.1674 | -0.3210 | |||
| CTVA / Corteva, Inc. | 0.01 | 0.00 | 0.28 | 20.26 | 0.1644 | 0.0245 | |||
| AMD / Advanced Micro Devices, Inc. | 0.00 | 0.00 | 0.27 | -14.42 | 0.1609 | -0.0315 | |||
| KDP / Keurig Dr Pepper Inc. | 0.01 | 0.00 | 0.27 | 7.51 | 0.1603 | 0.0077 | |||
| NTRS / Northern Trust Corporation | 0.00 | 0.00 | 0.27 | 12.92 | 0.1597 | 0.0150 | |||
| CMI / Cummins Inc. | 0.00 | 0.00 | 0.27 | 13.98 | 0.1585 | 0.0162 | |||
| AMCR / Amcor plc | 0.02 | 0.00 | 0.27 | -0.74 | 0.1579 | -0.0049 | |||
| COG / Cabot Oil & Gas Corp. | 0.01 | 0.00 | 0.27 | 15.58 | 0.1573 | 0.0181 | |||
| WBA / Walgreens Boots Alliance, Inc. | 0.00 | 0.26 | 0.1550 | 0.1550 | |||||
| NEM / Newmont Corporation | 0.00 | 0.00 | 0.26 | 0.38 | 0.1544 | -0.0030 | |||
| SJM / The J. M. Smucker Company | 0.00 | 0.00 | 0.25 | 9.65 | 0.1473 | 0.0099 | |||
| STT / State Street Corporation | 0.00 | 0.00 | 0.25 | 15.42 | 0.1456 | 0.1456 | |||
| UPS / United Parcel Service, Inc. | 0.00 | 0.00 | 0.24 | 0.83 | 0.1432 | -0.0021 | |||
| ITW / Illinois Tool Works Inc. | 0.00 | 0.00 | 0.24 | 8.64 | 0.1408 | 0.0082 | |||
| APH / Amphenol Corporation | 0.00 | 100.00 | 0.24 | 0.85 | 0.1397 | -0.0020 | |||
| ETR / Entergy Corporation | 0.00 | 0.00 | 0.23 | -0.42 | 0.1385 | -0.0038 | |||
| CTSH / Cognizant Technology Solutions Corporation | 0.00 | 0.00 | 0.23 | -4.88 | 0.1379 | -0.0104 | |||
| A / Agilent Technologies, Inc. | 0.00 | 0.00 | 0.23 | 7.51 | 0.1349 | 0.0065 | |||
| SPG / Simon Property Group, Inc. | 0.00 | 0.22 | 0.1302 | 0.1302 | |||||
| NOW / ServiceNow, Inc. | 0.00 | -8.79 | 0.21 | -16.80 | 0.1226 | -0.0282 | |||
| VNT / Vontier Corporation | 0.01 | 0.00 | 0.21 | -9.25 | 0.1214 | 0.1214 | |||
| MMC / Marsh & McLennan Companies, Inc. | 0.00 | 0.21 | 0.1214 | 0.1214 | |||||
| CCI / Crown Castle Inc. | 0.00 | -9.16 | 0.20 | -1.91 | 0.1208 | -0.0052 | |||
| ATVI / Activision Blizzard Inc | 0.00 | -32.71 | 0.20 | -32.44 | 0.1190 | -0.0612 | |||
| PK / Park Hotels & Resorts Inc. | 0.01 | 0.20 | 0.1179 | 0.1179 | |||||
| DBRG / DigitalBridge Group, Inc. | 0.02 | 0.00 | 0.12 | 34.83 | 0.0707 | 0.0171 | |||
| LBRDA / Liberty Broadband Corporation | 0.00 | -100.00 | 0.00 | -100.00 | -0.1272 | ||||
| EQIX / Equinix, Inc. | 0.00 | -100.00 | 0.00 | -100.00 | -0.1393 | ||||
| EVRG / Evergy, Inc. | 0.00 | -100.00 | 0.00 | -100.00 | -0.1996 | ||||
| MA / Mastercard Incorporated | 0.00 | -100.00 | 0.00 | -100.00 | -0.1676 | ||||
| TSLA / Tesla, Inc. | 0.00 | -100.00 | 0.00 | -100.00 | 0.0000 | ||||
| BGCP / BGC Partners Inc - Class A | 0.00 | -100.00 | 0.00 | -100.00 | -0.0356 |