Mga Batayang Estadistika
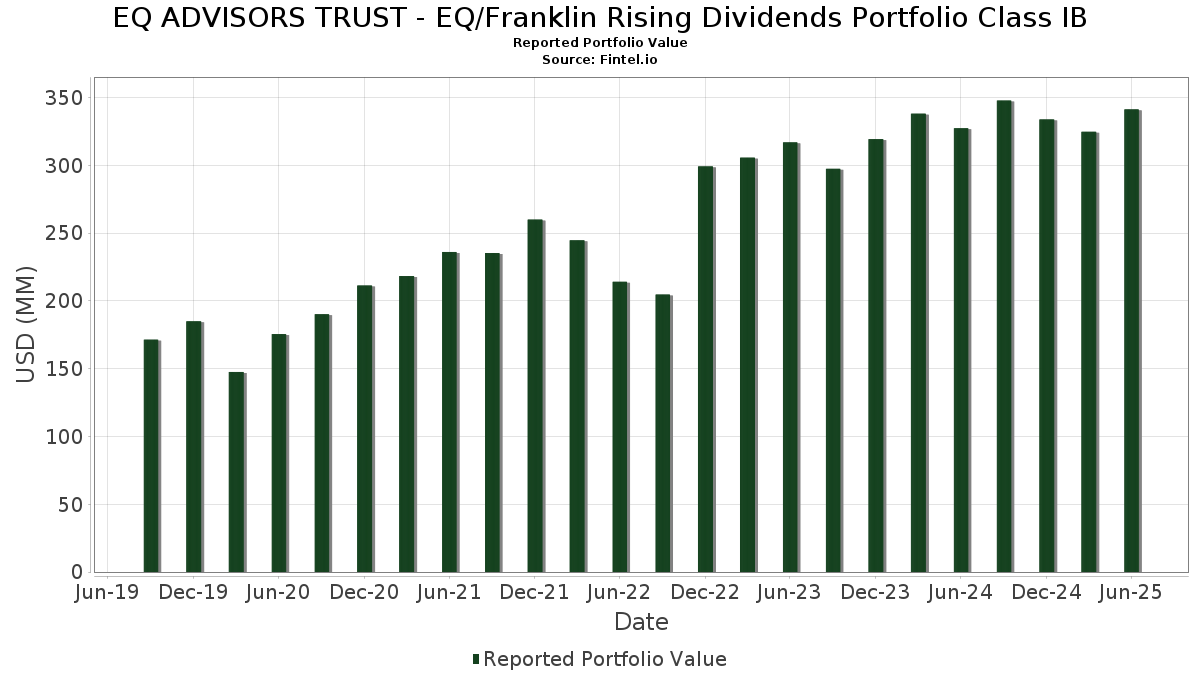
| Nilai Portofolio | $ 341,264,284 |
| Posisi Saat Ini | 58 |
Kepemilikan Terbaru, Kinerja, AUM (dari 13F, 13D)
EQ ADVISORS TRUST - EQ/Franklin Rising Dividends Portfolio Class IB telah mengungkapkan total kepemilikan 58 dalam pengajuan SEC terbaru mereka. Nilai portofolio terbaru dihitung sebesar $ 341,264,284 USD. Aset yang Dikelola (AUM) sebenarnya adalah nilai ini ditambah kas (yang tidak diungkapkan). Aset-aset utama EQ ADVISORS TRUST - EQ/Franklin Rising Dividends Portfolio Class IB adalah Microsoft Corporation (US:MSFT) , Broadcom Inc. (US:AVGO) , Visa Inc. (US:V) , JPMorgan Chase & Co. (US:JPM) , and Oracle Corporation (US:ORCL) . Posisi baru EQ ADVISORS TRUST - EQ/Franklin Rising Dividends Portfolio Class IB meliputi: Eli Lilly and Company (US:LLY) , .
Peningkatan Tertinggi Kuartal Ini
Kami menggunakan perubahan dalam alokasi portofolio karena ini adalah metrik yang paling bermakna. Perubahan dapat disebabkan oleh perdagangan atau perubahan harga saham.
| Keamanan | Saham (MM) |
Nilai (Juta Dolar AS) |
Portfolio % | ΔPorsyento ng Portfolio |
|---|---|---|---|---|
| 0.07 | 33.86 | 9.8036 | 1.7742 | |
| 0.06 | 15.78 | 4.5678 | 1.7331 | |
| 0.01 | 4.47 | 1.2935 | 1.2935 | |
| 0.05 | 10.19 | 2.9499 | 1.0315 | |
| 0.03 | 4.52 | 1.3080 | 0.9059 | |
| 1.65 | 1.65 | 0.4789 | 0.4789 | |
| 0.08 | 5.60 | 1.6208 | 0.4117 | |
| 0.06 | 6.65 | 1.9250 | 0.3989 | |
| 0.05 | 7.19 | 2.0806 | 0.3958 | |
| 0.04 | 10.26 | 2.9718 | 0.3365 |
Penurunan Tertinggi Kuartal Ini
Kami menggunakan perubahan dalam alokasi portofolio karena ini adalah metrik yang paling bermakna. Perubahan dapat disebabkan oleh perdagangan atau perubahan harga saham.
| Keamanan | Saham (MM) |
Nilai (Juta Dolar AS) |
Portfolio % | ΔPorsyento ng Portfolio |
|---|---|---|---|---|
| 0.00 | 0.70 | 0.2027 | -2.8470 | |
| 0.02 | 2.21 | 0.6396 | -0.3842 | |
| 0.02 | 3.17 | 0.9166 | -0.3642 | |
| 0.04 | 6.30 | 1.8249 | -0.3443 | |
| 0.02 | 6.68 | 1.9350 | -0.2921 | |
| 0.03 | 4.91 | 1.4215 | -0.2568 | |
| 0.03 | 4.02 | 1.1645 | -0.2560 | |
| 0.03 | 4.00 | 1.1580 | -0.2558 | |
| 0.02 | 8.99 | 2.6034 | -0.2161 | |
| 0.04 | 5.43 | 1.5736 | -0.2050 |
Pengajuan 13F dan Dana
Formulir ini diajukan pada 2025-08-26 untuk periode pelaporan 2025-06-30. Klik ikon tautan untuk melihat riwayat transaksi selengkapnya.
Tingkatkan ke versi premium untuk membuka data premium dan ekspor ke Excel. ![]() .
.
| Keamanan | Ketik | Harga Saham Rata-rata | Saham (MM) |
ΔSaham (%) |
ΔSaham (%) |
Nilai ($MM) |
Portpolyo (%) |
ΔPortofolio (%) |
|
|---|---|---|---|---|---|---|---|---|---|
| MSFT / Microsoft Corporation | 0.07 | -3.18 | 33.86 | 28.30 | 9.8036 | 1.7742 | |||
| AVGO / Broadcom Inc. | 0.06 | 2.85 | 15.78 | 69.32 | 4.5678 | 1.7331 | |||
| V / Visa Inc. | 0.03 | 0.43 | 11.74 | 1.74 | 3.4003 | -0.1113 | |||
| JPM / JPMorgan Chase & Co. | 0.04 | 0.26 | 10.26 | 18.49 | 2.9718 | 0.3365 | |||
| ORCL / Oracle Corporation | 0.05 | 3.32 | 10.19 | 61.59 | 2.9499 | 1.0315 | |||
| AAPL / Apple Inc. | 0.05 | 7.78 | 10.14 | -0.44 | 2.9371 | -0.1630 | |||
| LIN / Linde plc | 0.02 | 1.17 | 10.04 | 1.95 | 2.9066 | -0.0894 | |||
| SYK / Stryker Corporation | 0.02 | 0.55 | 9.77 | 6.86 | 2.8277 | 0.0472 | |||
| TXN / Texas Instruments Incorporated | 0.05 | 0.88 | 9.66 | 16.57 | 2.7966 | 0.2755 | |||
| WMT / Walmart Inc. | 0.09 | 0.83 | 9.23 | 12.30 | 2.6732 | 0.1721 | |||
| ROP / Roper Technologies, Inc. | 0.02 | 0.92 | 8.99 | -2.98 | 2.6034 | -0.2161 | |||
| ABT / Abbott Laboratories | 0.06 | 0.90 | 7.69 | 3.46 | 2.2266 | -0.0348 | |||
| ACN / Accenture plc | 0.03 | 0.63 | 7.47 | -3.61 | 2.1638 | -0.1950 | |||
| NDAQ / Nasdaq, Inc. | 0.08 | -7.18 | 7.30 | 9.42 | 2.1148 | 0.0839 | |||
| RTX / RTX Corporation | 0.05 | 0.62 | 7.19 | 10.92 | 2.0824 | 0.1096 | |||
| MS / Morgan Stanley | 0.05 | 7.48 | 7.19 | 29.76 | 2.0806 | 0.3958 | |||
| ADI / Analog Devices, Inc. | 0.03 | 0.79 | 6.72 | 18.97 | 1.9470 | 0.2272 | |||
| MCD / McDonald's Corporation | 0.02 | -2.39 | 6.68 | -8.70 | 1.9350 | -0.2921 | |||
| TYIA / Johnson Controls International plc | 0.06 | 0.53 | 6.65 | 32.54 | 1.9250 | 0.3989 | |||
| SCHW / The Charles Schwab Corporation | 0.07 | 0.35 | 6.41 | 16.96 | 1.8567 | 0.1887 | |||
| PG / The Procter & Gamble Company | 0.04 | -5.44 | 6.30 | -11.60 | 1.8249 | -0.3443 | |||
| HON / Honeywell International Inc. | 0.03 | 0.82 | 6.10 | 10.87 | 1.7664 | 0.0924 | |||
| CTAS / Cintas Corporation | 0.03 | 1.05 | 5.72 | 9.58 | 1.6562 | 0.0680 | |||
| NVT / nVent Electric plc | 0.08 | 0.81 | 5.60 | 40.88 | 1.6208 | 0.4117 | |||
| LOW / Lowe's Companies, Inc. | 0.03 | 0.70 | 5.59 | -4.20 | 1.6183 | -0.1569 | |||
| JNJ / Johnson & Johnson | 0.04 | 0.93 | 5.43 | -7.05 | 1.5736 | -0.2050 | |||
| GD / General Dynamics Corporation | 0.02 | 1.15 | 5.28 | 8.22 | 1.5280 | 0.0444 | |||
| GWW / W.W. Grainger, Inc. | 0.01 | 1.01 | 5.21 | 6.37 | 1.5080 | 0.0183 | |||
| ABBV / AbbVie Inc. | 0.03 | 0.46 | 4.91 | -11.00 | 1.4215 | -0.2568 | |||
| ARES / Ares Management Corporation | 0.03 | 189.31 | 4.52 | 241.94 | 1.3080 | 0.9059 | |||
| LLY / Eli Lilly and Company | 0.01 | 4.47 | 1.2935 | 1.2935 | |||||
| ECL / Ecolab Inc. | 0.02 | 0.90 | 4.45 | 7.25 | 1.2897 | 0.0259 | |||
| CSL / Carlisle Companies Incorporated | 0.01 | -10.10 | 4.32 | -1.42 | 1.2507 | -0.0824 | |||
| ROST / Ross Stores, Inc. | 0.03 | 1.63 | 4.29 | 1.47 | 1.2427 | -0.0442 | |||
| APD / Air Products and Chemicals, Inc. | 0.01 | 1.59 | 4.04 | -2.84 | 1.1698 | -0.0953 | |||
| PEP / PepsiCo, Inc. | 0.03 | -2.18 | 4.02 | -13.86 | 1.1645 | -0.2560 | |||
| DHR / Danaher Corporation | 0.02 | 0.48 | 4.01 | -3.17 | 1.1606 | -0.0989 | |||
| CVX / Chevron Corporation | 0.03 | 0.55 | 4.00 | -13.94 | 1.1580 | -0.2558 | |||
| NEE / NextEra Energy, Inc. | 0.06 | 1.07 | 3.93 | -1.01 | 1.1388 | -0.0702 | |||
| PH / Parker-Hannifin Corporation | 0.01 | 0.63 | 3.91 | 15.64 | 1.1307 | 0.1032 | |||
| MMC / Marsh & McLennan Companies, Inc. | 0.02 | 1.20 | 3.33 | -9.32 | 0.9631 | -0.1531 | |||
| STE / STERIS plc | 0.01 | 0.24 | 3.21 | 6.25 | 0.9305 | 0.0102 | |||
| CASY / Casey's General Stores, Inc. | 0.01 | -0.41 | 3.21 | 17.10 | 0.9281 | 0.0951 | |||
| BDX / Becton, Dickinson and Company | 0.02 | 0.00 | 3.17 | -24.82 | 0.9166 | -0.3642 | |||
| XOM / Exxon Mobil Corporation | 0.03 | 1.04 | 2.92 | -8.41 | 0.8451 | -0.1245 | |||
| SHW / The Sherwin-Williams Company | 0.01 | 1.23 | 2.77 | -0.43 | 0.8018 | -0.0446 | |||
| CL / Colgate-Palmolive Company | 0.03 | -7.65 | 2.65 | -10.42 | 0.7672 | -0.1327 | |||
| ERIE / Erie Indemnity Company | 0.01 | 0.58 | 2.63 | -16.76 | 0.7623 | -0.2000 | |||
| MKC / McCormick & Company, Incorporated | 0.03 | 0.73 | 2.62 | -7.23 | 0.7585 | -0.1005 | |||
| WST / West Pharmaceutical Services, Inc. | 0.01 | 1.20 | 2.36 | -1.09 | 0.6834 | -0.0427 | |||
| AMAT / Applied Materials, Inc. | 0.01 | 0.77 | 2.24 | 27.10 | 0.6494 | 0.1126 | |||
| EOG / EOG Resources, Inc. | 0.02 | -29.62 | 2.21 | -34.35 | 0.6396 | -0.3842 | |||
| DHI / D.R. Horton, Inc. | 0.01 | 1.53 | 1.85 | 2.95 | 0.5353 | -0.0110 | |||
| TSCO / Tractor Supply Company | 0.03 | 33.56 | 1.74 | 27.88 | 0.5048 | 0.0901 | |||
| JPMorgan Prime Money Market Fund, IM Shares / STIV (N/A) | 1.65 | 1.65 | 0.4789 | 0.4789 | |||||
| NKE / NIKE, Inc. | 0.02 | 0.00 | 1.56 | 11.87 | 0.4530 | 0.0277 | |||
| TGT / Target Corporation | 0.01 | 0.00 | 1.36 | -5.44 | 0.3924 | -0.0438 | |||
| UNH / UnitedHealth Group Incorporated | 0.00 | -88.28 | 0.70 | -93.02 | 0.2027 | -2.8470 |