Mga Batayang Estadistika
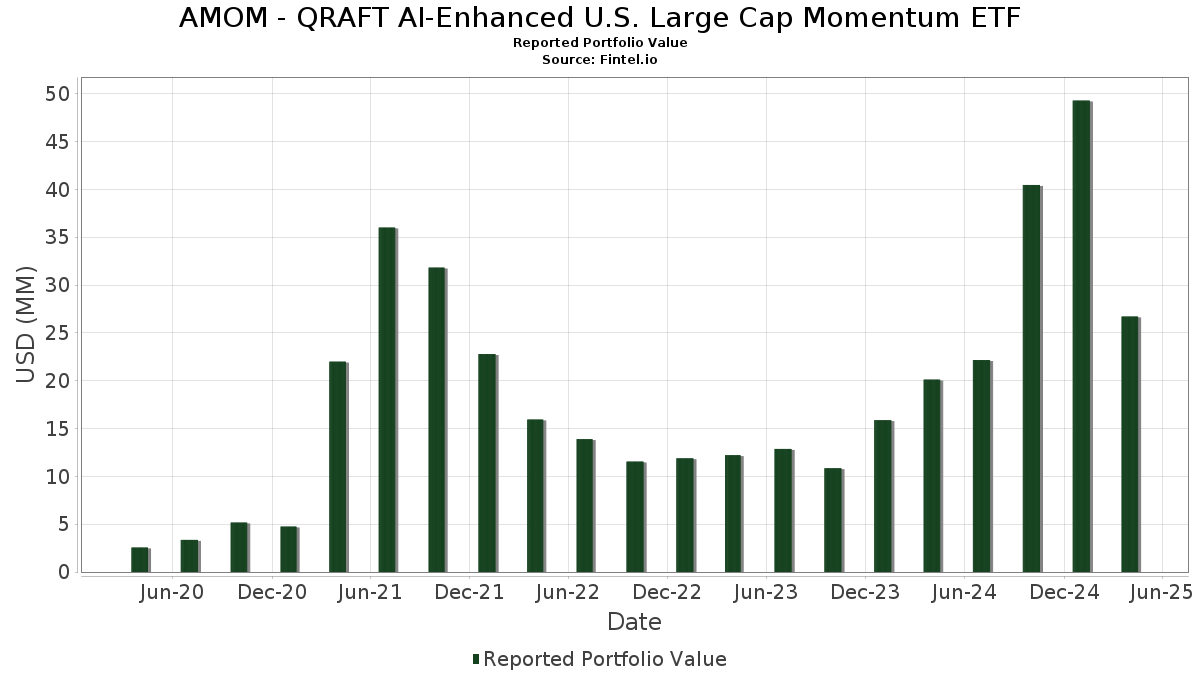
| Nilai Portofolio | $ 26,707,351 |
| Posisi Saat Ini | 51 |
Kepemilikan Terbaru, Kinerja, AUM (dari 13F, 13D)
AMOM - QRAFT AI-Enhanced U.S. Large Cap Momentum ETF telah mengungkapkan total kepemilikan 51 dalam pengajuan SEC terbaru mereka. Nilai portofolio terbaru dihitung sebesar $ 26,707,351 USD. Aset yang Dikelola (AUM) sebenarnya adalah nilai ini ditambah kas (yang tidak diungkapkan). Aset-aset utama AMOM - QRAFT AI-Enhanced U.S. Large Cap Momentum ETF adalah NVIDIA Corporation (US:NVDA) , Meta Platforms, Inc. (US:META) , Broadcom Inc. (US:AVGO) , Eli Lilly and Company (US:LLY) , and Walmart Inc. (US:WMT) . Posisi baru AMOM - QRAFT AI-Enhanced U.S. Large Cap Momentum ETF meliputi: T-Mobile US, Inc. (GB:TM5D) , International Business Machines Corporation (US:IBM) , Boston Scientific Corporation (US:BSX) , Gilead Sciences, Inc. (US:GILD) , and Welltower Inc. (US:WELL) .
Peningkatan Tertinggi Kuartal Ini
Kami menggunakan perubahan dalam alokasi portofolio karena ini adalah metrik yang paling bermakna. Perubahan dapat disebabkan oleh perdagangan atau perubahan harga saham.
| Keamanan | Saham (MM) |
Nilai (Juta Dolar AS) |
Portfolio % | ΔPorsyento ng Portfolio |
|---|---|---|---|---|
| 0.00 | 0.74 | 2.7601 | 2.7601 | |
| 0.00 | 0.67 | 2.5243 | 2.5243 | |
| 0.00 | 0.67 | 2.5117 | 2.5117 | |
| 0.01 | 0.57 | 2.1230 | 2.1230 | |
| 0.00 | 1.39 | 5.2089 | 2.0689 | |
| 0.00 | 0.51 | 1.9278 | 1.9278 | |
| 0.00 | 1.11 | 4.1584 | 1.8451 | |
| 0.01 | 0.89 | 3.3485 | 1.8077 | |
| 0.00 | 0.45 | 1.6969 | 1.6969 | |
| 0.00 | 0.42 | 1.5810 | 1.5810 |
Penurunan Tertinggi Kuartal Ini
Kami menggunakan perubahan dalam alokasi portofolio karena ini adalah metrik yang paling bermakna. Perubahan dapat disebabkan oleh perdagangan atau perubahan harga saham.
| Keamanan | Saham (MM) |
Nilai (Juta Dolar AS) |
Portfolio % | ΔPorsyento ng Portfolio |
|---|---|---|---|---|
| 0.00 | 0.41 | 1.5266 | -3.1557 | |
| 0.00 | 0.00 | -3.0779 | ||
| 0.01 | 1.32 | 4.9597 | -2.9573 | |
| 0.00 | 0.00 | -2.4637 | ||
| 0.00 | 0.00 | -2.0665 | ||
| 0.00 | 0.00 | -1.2353 | ||
| 0.00 | 0.00 | -1.2088 | ||
| 0.01 | 1.48 | 5.5553 | -1.1870 | |
| 0.00 | 0.00 | -1.1646 | ||
| 0.00 | 0.46 | 1.7150 | -1.1127 |
Pengajuan 13F dan Dana
Formulir ini diajukan pada 2025-06-26 untuk periode pelaporan 2025-04-30. Klik ikon tautan untuk melihat riwayat transaksi selengkapnya.
Tingkatkan ke versi premium untuk membuka data premium dan ekspor ke Excel. ![]() .
.
| Keamanan | Ketik | Harga Saham Rata-rata | Saham (MM) |
ΔSaham (%) |
ΔSaham (%) |
Nilai ($MM) |
Portpolyo (%) |
ΔPortofolio (%) |
|
|---|---|---|---|---|---|---|---|---|---|
| NVDA / NVIDIA Corporation | 0.02 | -32.21 | 2.33 | -38.53 | 8.7158 | 1.0300 | |||
| META / Meta Platforms, Inc. | 0.00 | -11.71 | 1.55 | -29.67 | 5.8009 | 1.3285 | |||
| AVGO / Broadcom Inc. | 0.01 | -48.63 | 1.48 | -55.32 | 5.5553 | -1.1870 | |||
| LLY / Eli Lilly and Company | 0.00 | -18.84 | 1.39 | -10.03 | 5.2089 | 2.0689 | |||
| WMT / Walmart Inc. | 0.01 | 114.29 | 1.32 | 30.44 | 4.9597 | -2.9573 | |||
| NFLX / Netflix, Inc. | 0.00 | -15.87 | 1.11 | -2.46 | 4.1584 | 1.8451 | |||
| COST / Costco Wholesale Corporation | 0.00 | -1.90 | 0.98 | 11.66 | 3.6616 | 1.4876 | |||
| PLTR / Palantir Technologies Inc. | 0.01 | -17.92 | 0.89 | 17.81 | 3.3485 | 1.8077 | |||
| TM5D / T-Mobile US, Inc. | 0.00 | 0.74 | 2.7601 | 2.7601 | |||||
| GE / General Electric Company | 0.00 | 0.67 | 2.5243 | 2.5243 | |||||
| IBM / International Business Machines Corporation | 0.00 | 0.67 | 2.5117 | 2.5117 | |||||
| PGR / The Progressive Corporation | 0.00 | -61.01 | 0.58 | -55.43 | 2.1855 | -0.4730 | |||
| BSX / Boston Scientific Corporation | 0.01 | 0.57 | 2.1230 | 2.1230 | |||||
| PANW / Palo Alto Networks, Inc. | 0.00 | -15.07 | 0.54 | -13.94 | 2.0123 | 0.7447 | |||
| CRWD / CrowdStrike Holdings, Inc. | 0.00 | -17.41 | 0.52 | -11.04 | 1.9662 | 0.7679 | |||
| GILD / Gilead Sciences, Inc. | 0.00 | 0.51 | 1.9278 | 1.9278 | |||||
| ANET / Arista Networks Inc | 0.01 | -2.02 | 0.48 | -30.14 | 1.8082 | 0.4065 | |||
| KKR / KKR & Co. Inc. | 0.00 | -51.91 | 0.46 | -67.17 | 1.7150 | -1.1127 | |||
| WELL / Welltower Inc. | 0.00 | 0.45 | 1.6969 | 1.6969 | |||||
| MCK / McKesson Corporation | 0.00 | -9.43 | 0.44 | 65.67 | 1.6660 | -0.6581 | |||
| FTNT / Fortinet, Inc. | 0.00 | -58.03 | 0.43 | -56.84 | 1.5961 | -0.4088 | |||
| XPRO / Expro Group Holdings N.V. | 0.00 | 0.42 | 1.5810 | 1.5810 | |||||
| TDG / TransDigm Group Incorporated | 0.00 | -52.76 | 0.41 | -48.75 | 1.5402 | -0.4509 | |||
| ORLY / O'Reilly Automotive, Inc. | 0.00 | -47.25 | 0.41 | -19.88 | 1.5266 | -3.1557 | |||
| APO / Apollo Global Management, Inc. | 0.00 | -53.37 | 0.40 | -62.86 | 1.5131 | -0.6914 | |||
| AJG / Arthur J. Gallagher & Co. | 0.00 | 0.40 | 1.4894 | 1.4894 | |||||
| WMB / The Williams Companies, Inc. | 0.01 | 0.38 | 1.4312 | 1.4312 | |||||
| RCL / Royal Caribbean Cruises Ltd. | 0.00 | -12.53 | 0.36 | -29.53 | 1.3435 | 0.3103 | |||
| HWM / Howmet Aerospace Inc. | 0.00 | 0.36 | 1.3304 | 1.3304 | |||||
| AXON / Axon Enterprise, Inc. | 0.00 | -54.82 | 0.34 | -57.58 | 1.2910 | -0.3569 | |||
| KMI / Kinder Morgan, Inc. | 0.01 | 0.34 | 1.2575 | 1.2575 | |||||
| FICO / Fair Isaac Corporation | 0.00 | -56.40 | 0.33 | -53.70 | 1.2446 | -0.2129 | |||
| PWR / Quanta Services, Inc. | 0.00 | -12.06 | 0.32 | -16.28 | 1.2147 | 0.4274 | |||
| VST / Vistra Corp. | 0.00 | -54.35 | 0.32 | -64.81 | 1.2075 | -0.6518 | |||
| DFS / Discover Financial Services | 0.00 | 0.31 | 1.1625 | 1.1625 | |||||
| OKE / ONEOK, Inc. | 0.00 | 0.30 | 1.1155 | 1.1155 | |||||
| 1CAH / Cardinal Health, Inc. | 0.00 | 0.27 | 1.0124 | 1.0124 | |||||
| ETR / Entergy Corporation | 0.00 | 0.27 | 1.0084 | 1.0084 | |||||
| TRGP / Targa Resources Corp. | 0.00 | -60.98 | 0.26 | -66.23 | 0.9621 | -0.5776 | |||
| TPL / Texas Pacific Land Corporation | 0.00 | -62.60 | 0.24 | -62.92 | 0.9172 | -0.4212 | |||
| BRO / Brown & Brown, Inc. | 0.00 | 0.24 | 0.9072 | 0.9072 | |||||
| GDDY / GoDaddy Inc. | 0.00 | 0.24 | 0.9043 | 0.9043 | |||||
| EQT / EQT Corporation | 0.00 | 0.24 | 0.8952 | 0.8952 | |||||
| NRG / NRG Energy, Inc. | 0.00 | -60.37 | 0.23 | -57.59 | 0.8693 | -0.2428 | |||
| UAL / United Airlines Holdings, Inc. | 0.00 | 0.22 | 0.8218 | 0.8218 | |||||
| SMCI / Super Micro Computer, Inc. | 0.01 | 1,097.43 | 0.19 | -45.76 | 0.7216 | -0.8779 | |||
| JBL / Jabil Inc. | 0.00 | 0.19 | 0.7153 | 0.7153 | |||||
| DECK / Deckers Outdoor Corporation | 0.00 | -44.26 | 0.19 | -65.18 | 0.7016 | -0.3907 | |||
| TPR / Tapestry, Inc. | 0.00 | 0.18 | 0.6584 | 0.6584 | |||||
| 0A0X / Fox Corporation | 0.00 | 0.14 | 0.5229 | 0.5229 | |||||
| BBH SWEEP VEHICLE / STIV (N/A) | 0.07 | 0.2657 | 0.2657 | ||||||
| FIX / Comfort Systems USA, Inc. | 0.00 | -100.00 | 0.00 | -100.00 | -0.9244 | ||||
| APP / AppLovin Corporation | 0.00 | -100.00 | 0.00 | -100.00 | -2.4637 | ||||
| MSI / Motorola Solutions, Inc. | 0.00 | -100.00 | 0.00 | -100.00 | -1.0360 | ||||
| FTAI / FTAI Aviation Ltd. | 0.00 | -100.00 | 0.00 | -100.00 | -0.6195 | ||||
| NOW / ServiceNow, Inc. | 0.00 | -100.00 | 0.00 | -100.00 | -3.0779 | ||||
| DASH / DoorDash, Inc. | 0.00 | -100.00 | 0.00 | -100.00 | -1.0306 | ||||
| MSTR / Strategy Inc | 0.00 | -100.00 | 0.00 | -100.00 | -2.0665 | ||||
| IBKR / Interactive Brokers Group, Inc. | 0.00 | -100.00 | 0.00 | -100.00 | -1.2353 | ||||
| NTRA / Natera, Inc. | 0.00 | -100.00 | 0.00 | -100.00 | -1.1646 | ||||
| GEV / GE Vernova Inc. | 0.00 | -100.00 | 0.00 | -100.00 | -1.2088 |