Mga Batayang Estadistika
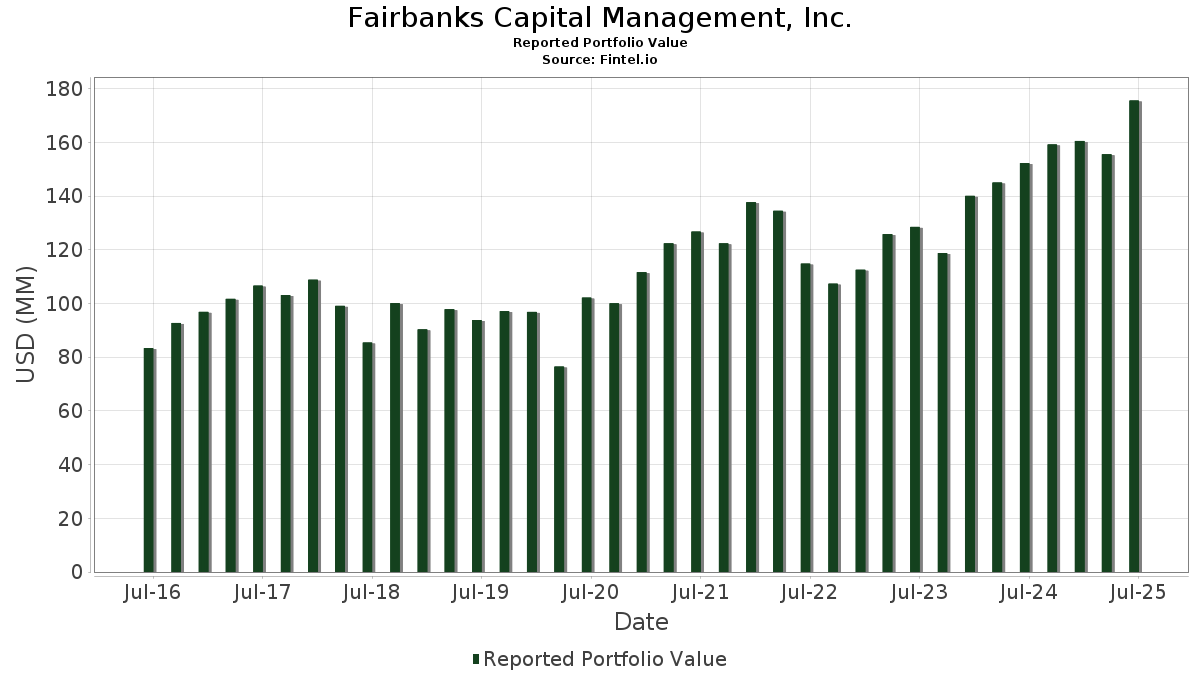
| Nilai Portofolio | $ 175,559,223 |
| Posisi Saat Ini | 53 |
Kepemilikan Terbaru, Kinerja, AUM (dari 13F, 13D)
Fairbanks Capital Management, Inc. telah mengungkapkan total kepemilikan 53 dalam pengajuan SEC terbaru mereka. Nilai portofolio terbaru dihitung sebesar $ 175,559,223 USD. Aset yang Dikelola (AUM) sebenarnya adalah nilai ini ditambah kas (yang tidak diungkapkan). Aset-aset utama Fairbanks Capital Management, Inc. adalah Oracle Corporation (US:ORCL) , TransDigm Group Incorporated (US:TDG) , Broadcom Inc. (US:AVGO) , Microsoft Corporation (US:MSFT) , and Alliance Resource Partners, L.P. - Limited Partnership (US:ARLP) .
Peningkatan Tertinggi Kuartal Ini
Kami menggunakan perubahan dalam alokasi portofolio karena ini adalah metrik yang paling bermakna. Perubahan dapat disebabkan oleh perdagangan atau perubahan harga saham.
| Keamanan | Saham (MM) |
Nilai (Juta Dolar AS) |
Portfolio % | ΔPorsyento ng Portfolio |
|---|---|---|---|---|
| 0.03 | 4.67 | 2.5883 | 2.3616 | |
| 0.03 | 9.11 | 5.0493 | 1.7024 | |
| 0.01 | 6.07 | 3.3653 | 1.0759 | |
| 0.02 | 9.10 | 5.0413 | 0.8620 | |
| 0.11 | 19.33 | 11.0087 | 0.5992 | |
| 0.02 | 5.25 | 2.9086 | 0.5814 | |
| 0.00 | 4.54 | 2.5189 | 0.3244 | |
| 0.02 | 1.55 | 0.8848 | 0.2642 | |
| 0.01 | 1.99 | 1.1011 | 0.2425 | |
| 0.03 | 7.42 | 4.2260 | 0.2310 |
Penurunan Tertinggi Kuartal Ini
Kami menggunakan perubahan dalam alokasi portofolio karena ini adalah metrik yang paling bermakna. Perubahan dapat disebabkan oleh perdagangan atau perubahan harga saham.
| Keamanan | Saham (MM) |
Nilai (Juta Dolar AS) |
Portfolio % | ΔPorsyento ng Portfolio |
|---|---|---|---|---|
| 0.00 | 0.62 | 0.3540 | -2.2020 | |
| 0.04 | 6.86 | 3.7998 | -1.5637 | |
| 0.29 | 7.55 | 4.1851 | -0.9064 | |
| 0.01 | 1.70 | 0.9438 | -0.7697 | |
| 0.05 | 4.51 | 2.5667 | -0.7223 | |
| 0.14 | 5.06 | 2.8063 | -0.5611 | |
| 0.02 | 2.65 | 1.4663 | -0.5234 | |
| 0.02 | 5.99 | 3.3180 | -0.3899 | |
| 0.01 | 6.31 | 3.5949 | -0.2346 | |
| 0.01 | 1.65 | 0.9147 | -0.2006 |
Pengajuan 13F dan Dana
Formulir ini diajukan pada 2025-08-08 untuk periode pelaporan 2025-06-30. Klik ikon tautan untuk melihat riwayat transaksi selengkapnya.
Tingkatkan ke versi premium untuk membuka data premium dan ekspor ke Excel. ![]() .
.
| Keamanan | Ketik | Harga Saham Rata-rata | Saham (MM) |
ΔSaham (%) |
ΔSaham (%) |
Nilai ($MM) |
Portpolyo (%) |
ΔPortofolio (%) |
|
|---|---|---|---|---|---|---|---|---|---|
| ORCL / Oracle Corporation | 0.11 | 5.62 | 19.33 | 19.36 | 11.0087 | 0.5992 | |||
| TDG / TransDigm Group Incorporated | 0.01 | 0.78 | 15.52 | 10.79 | 8.8410 | -0.1654 | |||
| AVGO / Broadcom Inc. | 0.03 | 6.28 | 9.11 | 74.97 | 5.0493 | 1.7024 | |||
| MSFT / Microsoft Corporation | 0.02 | 5.58 | 9.10 | 39.90 | 5.0413 | 0.8620 | |||
| ARLP / Alliance Resource Partners, L.P. - Limited Partnership | 0.29 | -0.51 | 7.55 | -4.67 | 4.1851 | -0.9064 | |||
| AMZN / Amazon.com, Inc. | 0.03 | 3.53 | 7.42 | 19.39 | 4.2260 | 0.2310 | |||
| NXST / Nexstar Media Group, Inc. | 0.04 | -14.85 | 6.86 | -17.84 | 3.7998 | -1.5637 | |||
| MA / Mastercard Incorporated | 0.01 | 3.34 | 6.31 | 5.96 | 3.5949 | -0.2346 | |||
| META / Meta Platforms, Inc. | 0.01 | 33.13 | 6.07 | 70.49 | 3.3653 | 1.0759 | |||
| V / Visa Inc. | 0.02 | 2.44 | 5.99 | 3.80 | 3.3180 | -0.3899 | |||
| TSM / Taiwan Semiconductor Manufacturing Company Limited - Depositary Receipt (Common Stock) | 0.02 | 6.24 | 5.25 | 44.94 | 2.9086 | 0.5814 | |||
| SU / Suncor Energy Inc. | 0.14 | -0.07 | 5.06 | -3.36 | 2.8063 | -0.5611 | |||
| GOOGL / Alphabet Inc. | 0.03 | 1,054.56 | 4.67 | 1,226.42 | 2.5883 | 2.3616 | |||
| BKNG / Booking Holdings Inc. | 0.00 | 5.94 | 4.54 | 33.14 | 2.5189 | 0.3244 | |||
| CHD / Church & Dwight Co., Inc. | 0.05 | 0.89 | 4.51 | -11.92 | 2.5667 | -0.7223 | |||
| FI / Fiserv, Inc. | 0.02 | 39.07 | 3.79 | 8.60 | 2.0996 | -0.1432 | |||
| INTU / Intuit Inc. | 0.00 | -2.10 | 3.68 | 25.60 | 2.0965 | 0.2126 | |||
| COST / Costco Wholesale Corporation | 0.00 | 5.96 | 3.57 | 10.90 | 2.0350 | -0.0358 | |||
| EFX / Equifax Inc. | 0.01 | 1.95 | 3.36 | 8.57 | 1.8616 | -0.1271 | |||
| MCO / Moody's Corporation | 0.01 | 6.16 | 3.17 | 14.34 | 1.8028 | 0.0234 | |||
| NDAQ / Nasdaq, Inc. | 0.03 | 6.40 | 2.95 | 25.43 | 1.6806 | 0.1683 | |||
| BSX / Boston Scientific Corporation | 0.03 | 6.68 | 2.76 | 13.59 | 1.5719 | 0.0101 | |||
| JAZZ / Jazz Pharmaceuticals plc | 0.02 | -0.01 | 2.65 | -14.54 | 1.4663 | -0.5234 | |||
| AAPL / Apple Inc. | 0.01 | 14.66 | 2.49 | 5.92 | 1.3785 | -0.1311 | |||
| AMD / Advanced Micro Devices, Inc. | 0.01 | 7.69 | 1.99 | 48.76 | 1.1011 | 0.2425 | |||
| AMT / American Tower Corporation | 0.01 | 6.32 | 1.95 | 8.04 | 1.0804 | -0.0800 | |||
| ICE / Intercontinental Exchange, Inc. | 0.01 | 6.22 | 1.82 | 12.94 | 1.0393 | 0.0010 | |||
| GME / GameStop Corp. | 0.07 | 0.00 | 1.80 | 9.30 | 1.0249 | -0.0336 | |||
| UNH / UnitedHealth Group Incorporated | 0.01 | 7.25 | 1.70 | -36.14 | 0.9438 | -0.7697 | |||
| BRO / Brown & Brown, Inc. | 0.01 | 6.73 | 1.65 | -4.90 | 0.9147 | -0.2006 | |||
| APH / Amphenol Corporation | 0.02 | 6.87 | 1.55 | 60.93 | 0.8848 | 0.2642 | |||
| SHW / The Sherwin-Williams Company | 0.00 | 6.88 | 1.50 | 5.12 | 0.8533 | -0.0630 | |||
| DPZ / Domino's Pizza, Inc. | 0.00 | 6.60 | 1.48 | 4.53 | 0.8411 | -0.0668 | |||
| MSCI / MSCI Inc. | 0.00 | 6.75 | 1.46 | 8.87 | 0.8318 | -0.0305 | |||
| ACN / Accenture plc | 0.00 | 7.01 | 1.41 | 2.54 | 0.8056 | -0.0814 | |||
| FAST / Fastenal Company | 0.02 | 112.45 | 1.02 | 15.05 | 0.5643 | -0.0045 | |||
| IQV / IQVIA Holdings Inc. | 0.01 | 6.24 | 0.98 | -5.02 | 0.5607 | -0.1056 | |||
| STZ / Constellation Brands, Inc. | 0.01 | 6.24 | 0.96 | -5.80 | 0.5313 | -0.1230 | |||
| GFL / GFL Environmental Inc. | 0.02 | 6.51 | 0.93 | 11.31 | 0.5130 | -0.0218 | |||
| BA / The Boeing Company | 0.00 | -3.52 | 0.88 | 18.50 | 0.5039 | 0.0241 | |||
| TMO / Thermo Fisher Scientific Inc. | 0.00 | 6.72 | 0.74 | -13.04 | 0.4220 | -0.1257 | |||
| UPST / Upstart Holdings, Inc. | 0.01 | -8.47 | 0.70 | 28.55 | 0.3872 | 0.0380 | |||
| HD / The Home Depot, Inc. | 0.00 | 4.75 | 0.69 | 4.83 | 0.3851 | -0.0411 | |||
| DIS / The Walt Disney Company | 0.01 | -1.74 | 0.65 | 23.53 | 0.3612 | 0.0219 | |||
| GOOGL / Alphabet Inc. | 0.00 | -86.14 | 0.62 | -84.38 | 0.3540 | -2.2020 | |||
| FIS / Fidelity National Information Services, Inc. | 0.01 | -7.44 | 0.60 | 0.85 | 0.3301 | -0.0493 | |||
| AXP / American Express Company | 0.00 | 0.00 | 0.58 | 18.53 | 0.3316 | 0.0159 | |||
| DG / Dollar General Corporation | 0.00 | 6.34 | 0.52 | 38.20 | 0.2891 | 0.0467 | |||
| VRSN / VeriSign, Inc. | 0.00 | -8.01 | 0.44 | 4.72 | 0.2462 | -0.0267 | |||
| PLTR / Palantir Technologies Inc. | 0.00 | 0.00 | 0.41 | 61.26 | 0.2329 | 0.0702 | |||
| PYPL / PayPal Holdings, Inc. | 0.00 | 0.00 | 0.30 | 13.79 | 0.1693 | 0.0015 | |||
| TTD / The Trade Desk, Inc. | 0.00 | 0.00 | 0.29 | 31.65 | 0.1596 | 0.0189 | |||
| VLO / Valero Energy Corporation | 0.00 | 0.00 | 0.24 | 1.68 | 0.1346 | -0.0188 | |||
| GD / General Dynamics Corporation | 0.00 | -100.00 | 0.00 | 0.0000 | |||||
| LRCX / Lam Research Corporation | 0.00 | -100.00 | 0.00 | 0.0000 |