Mga Batayang Estadistika
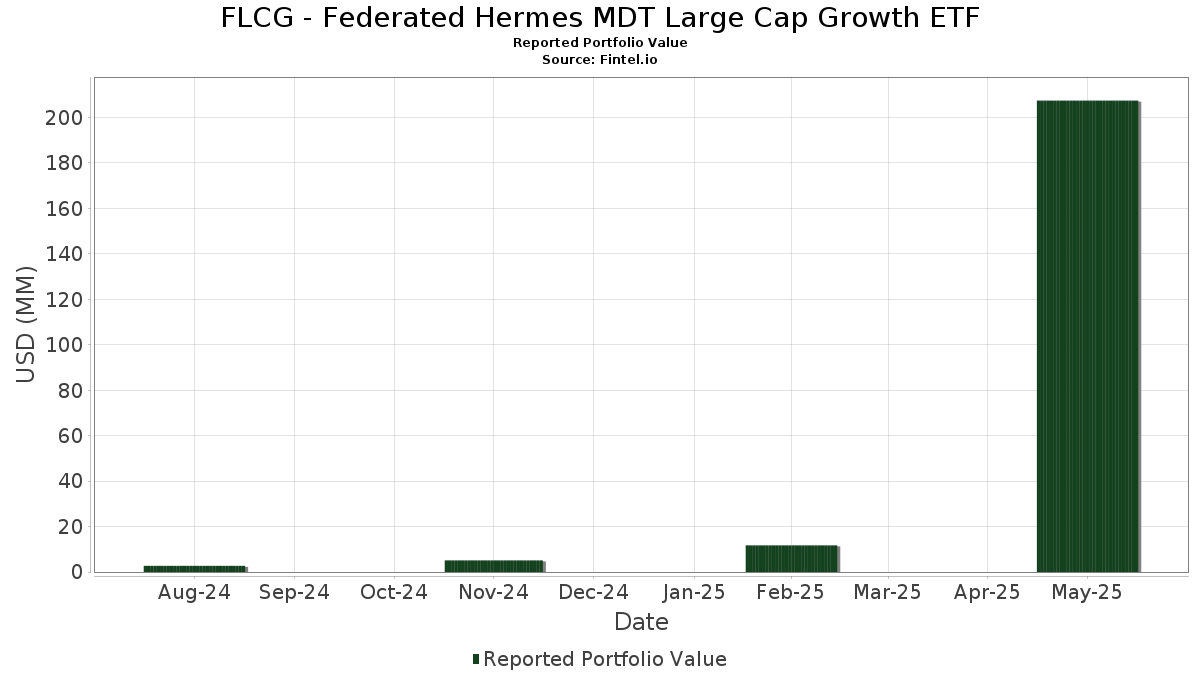
| Nilai Portofolio | $ 207,472,969 |
| Posisi Saat Ini | 96 |
Kepemilikan Terbaru, Kinerja, AUM (dari 13F, 13D)
FLCG - Federated Hermes MDT Large Cap Growth ETF telah mengungkapkan total kepemilikan 96 dalam pengajuan SEC terbaru mereka. Nilai portofolio terbaru dihitung sebesar $ 207,472,969 USD. Aset yang Dikelola (AUM) sebenarnya adalah nilai ini ditambah kas (yang tidak diungkapkan). Aset-aset utama FLCG - Federated Hermes MDT Large Cap Growth ETF adalah Microsoft Corporation (US:MSFT) , Apple Inc. (US:AAPL) , NVIDIA Corporation (US:NVDA) , Amazon.com, Inc. (US:AMZN) , and Alphabet Inc. (US:GOOGL) . Posisi baru FLCG - Federated Hermes MDT Large Cap Growth ETF meliputi: Teradyne, Inc. (US:TER) , DexCom, Inc. (US:DXCM) , Celanese Corporation (US:CE) , Marvell Technology, Inc. (US:MRVL) , and Five Below, Inc. (US:FIVE) .
Peningkatan Tertinggi Kuartal Ini
Kami menggunakan perubahan dalam alokasi portofolio karena ini adalah metrik yang paling bermakna. Perubahan dapat disebabkan oleh perdagangan atau perubahan harga saham.
| Keamanan | Saham (MM) |
Nilai (Juta Dolar AS) |
Portfolio % | ΔPorsyento ng Portfolio |
|---|---|---|---|---|
| 0.02 | 5.96 | 2.8571 | 2.0079 | |
| 0.05 | 22.11 | 10.6025 | 1.6225 | |
| 0.04 | 2.84 | 1.3611 | 1.3611 | |
| 0.03 | 2.42 | 1.1625 | 1.1625 | |
| 0.04 | 2.13 | 1.0192 | 1.0192 | |
| 0.04 | 2.45 | 1.1752 | 0.9453 | |
| 0.01 | 2.81 | 1.3464 | 0.8828 | |
| 0.03 | 1.57 | 0.7524 | 0.7524 | |
| 0.01 | 1.50 | 0.7211 | 0.6916 | |
| 0.01 | 1.42 | 0.6823 | 0.6823 |
Penurunan Tertinggi Kuartal Ini
Kami menggunakan perubahan dalam alokasi portofolio karena ini adalah metrik yang paling bermakna. Perubahan dapat disebabkan oleh perdagangan atau perubahan harga saham.
| Keamanan | Saham (MM) |
Nilai (Juta Dolar AS) |
Portfolio % | ΔPorsyento ng Portfolio |
|---|---|---|---|---|
| 0.09 | 18.07 | 8.6642 | -1.1957 | |
| 0.01 | 1.79 | 0.8563 | -1.0779 | |
| 0.01 | 7.24 | 3.4733 | -1.0776 | |
| 0.02 | 2.79 | 1.3392 | -0.8805 | |
| 0.01 | 4.09 | 1.9607 | -0.8601 | |
| 0.12 | 16.56 | 7.9421 | -0.8169 | |
| 0.01 | 2.64 | 1.2657 | -0.5930 | |
| 0.02 | 1.96 | 0.9375 | -0.5533 | |
| 0.01 | 0.44 | 0.2127 | -0.5159 | |
| 0.00 | 0.46 | 0.2226 | -0.4872 |
Pengajuan 13F dan Dana
Formulir ini diajukan pada 2025-07-22 untuk periode pelaporan 2025-05-31. Klik ikon tautan untuk melihat riwayat transaksi selengkapnya.
Tingkatkan ke versi premium untuk membuka data premium dan ekspor ke Excel. ![]() .
.
| Keamanan | Ketik | Harga Saham Rata-rata | Saham (MM) |
ΔSaham (%) |
ΔSaham (%) |
Nilai ($MM) |
Portpolyo (%) |
ΔPortofolio (%) |
|
|---|---|---|---|---|---|---|---|---|---|
| MSFT / Microsoft Corporation | 0.05 | 1,700.75 | 22.11 | 1,989.70 | 10.6025 | 1.6225 | |||
| AAPL / Apple Inc. | 0.09 | 1,771.33 | 18.07 | 1,454.82 | 8.6642 | -1.1957 | |||
| NVDA / NVIDIA Corporation | 0.12 | 1,382.52 | 16.56 | 1,504.75 | 7.9421 | -0.8169 | |||
| AMZN / Amazon.com, Inc. | 0.07 | 1,731.83 | 15.34 | 1,671.02 | 7.3549 | 0.0019 | |||
| GOOGL / Alphabet Inc. | 0.08 | 1,667.00 | 13.11 | 1,683.95 | 6.2882 | 0.0477 | |||
| META / Meta Platforms, Inc. | 0.01 | 1,293.03 | 7.24 | 1,251.12 | 3.4733 | -1.0776 | |||
| AVGO / Broadcom Inc. | 0.02 | 4,802.79 | 5.96 | 5,857.00 | 2.8571 | 2.0079 | |||
| COST / Costco Wholesale Corporation | 0.01 | 1,564.42 | 5.40 | 1,551.68 | 2.5904 | -0.1845 | |||
| QCOM / QUALCOMM Incorporated | 0.03 | 1,605.66 | 4.94 | 1,479.23 | 2.3706 | -0.2902 | |||
| AMP / Ameriprise Financial, Inc. | 0.01 | 1,620.73 | 4.82 | 1,533.56 | 2.3112 | -0.1953 | |||
| FTNT / Fortinet, Inc. | 0.04 | 1,747.34 | 4.46 | 1,647.45 | 2.1369 | -0.0342 | |||
| SPOT / Spotify Technology S.A. | 0.01 | 1,023.77 | 4.09 | 1,131.33 | 1.9607 | -0.8601 | |||
| NTNX / Nutanix, Inc. | 0.05 | 1,631.15 | 3.74 | 1,630.09 | 1.7922 | -0.0436 | |||
| VLTO / Veralto Corporation | 0.03 | 1,258.90 | 3.15 | 1,279.82 | 1.5090 | -0.4303 | |||
| TER / Teradyne, Inc. | 0.04 | 2.84 | 1.3611 | 1.3611 | |||||
| PANW / Palo Alto Networks, Inc. | 0.01 | 4,983.97 | 2.81 | 5,098.15 | 1.3464 | 0.8828 | |||
| DASH / DoorDash, Inc. | 0.01 | 1,689.75 | 2.80 | 1,781.88 | 1.3449 | 0.0809 | |||
| GDDY / GoDaddy Inc. | 0.02 | 951.58 | 2.79 | 969.73 | 1.3392 | -0.8805 | |||
| TSLA / Tesla, Inc. | 0.01 | 918.45 | 2.64 | 1,105.02 | 1.2657 | -0.5930 | |||
| ADBE / Adobe Inc. | 0.01 | 3,027.36 | 2.61 | 2,864.77 | 1.2513 | 0.5036 | |||
| AMGN / Amgen Inc. | 0.01 | 1,537.50 | 2.53 | 1,432.73 | 1.2129 | -0.1875 | |||
| EL / The Estée Lauder Companies Inc. | 0.04 | 9,610.88 | 2.45 | 8,974.07 | 1.1752 | 0.9453 | |||
| DXCM / DexCom, Inc. | 0.03 | 2.42 | 1.1625 | 1.1625 | |||||
| CE / Celanese Corporation | 0.04 | 2.13 | 1.0192 | 1.0192 | |||||
| ANET / Arista Networks Inc | 0.02 | 1,094.55 | 1.96 | 1,017.14 | 0.9375 | -0.5533 | |||
| LLY / Eli Lilly and Company | 0.00 | 1,356.04 | 1.95 | 1,070.06 | 0.9374 | -0.4837 | |||
| PGR / The Progressive Corporation | 0.01 | 2,311.19 | 1.84 | 2,354.67 | 0.8830 | 0.2420 | |||
| ALSN / Allison Transmission Holdings, Inc. | 0.02 | 1,475.48 | 1.80 | 1,502.68 | 0.8611 | -0.0891 | |||
| ABBV / AbbVie Inc. | 0.01 | 779.47 | 1.79 | 682.89 | 0.8563 | -1.0779 | |||
| NFLX / Netflix, Inc. | 0.00 | 3,902.86 | 1.69 | 4,873.53 | 0.8111 | 0.5200 | |||
| PLTR / Palantir Technologies Inc. | 0.01 | 3,309.70 | 1.67 | 5,277.42 | 0.7994 | 0.5322 | |||
| MS / Morgan Stanley | 0.01 | 4,550.91 | 1.64 | 4,447.22 | 0.7853 | 0.4748 | |||
| COR / Cencora, Inc. | 0.01 | 1,346.58 | 1.60 | 1,566.67 | 0.7677 | -0.0494 | |||
| MRVL / Marvell Technology, Inc. | 0.03 | 1.57 | 0.7524 | 0.7524 | |||||
| DECK / Deckers Outdoor Corporation | 0.01 | 56,904.00 | 1.50 | 50,000.00 | 0.7211 | 0.6916 | |||
| SN / SharkNinja, Inc. | 0.02 | 1,188.56 | 1.43 | 1,033.33 | 0.6851 | -0.3899 | |||
| FIVE / Five Below, Inc. | 0.01 | 1.42 | 0.6823 | 0.6823 | |||||
| ALGN / Align Technology, Inc. | 0.01 | 19,255.26 | 1.33 | 18,900.00 | 0.6382 | 0.5779 | |||
| ZS / Zscaler, Inc. | 0.00 | 1.28 | 0.6157 | 0.6157 | |||||
| PAYC / Paycom Software, Inc. | 0.00 | 1,411.91 | 1.25 | 1,684.29 | 0.5992 | 0.0054 | |||
| V / Visa Inc. | 0.00 | 2,715.83 | 1.23 | 2,767.44 | 0.5918 | 0.2226 | |||
| GSCE / GS Connect S&P GSCI Enhanced Commodity Total Return ETN | 0.00 | 1.18 | 0.5652 | 0.5652 | |||||
| UBER / Uber Technologies, Inc. | 0.01 | 199,614.29 | 1.18 | 0.5642 | 0.5597 | ||||
| RBLX / Roblox Corporation | 0.01 | 1,573.23 | 1.17 | 2,201.96 | 0.5632 | 0.1276 | |||
| TT / Trane Technologies plc | 0.00 | 1,808.66 | 1.04 | 2,268.18 | 0.5002 | 0.1192 | |||
| NTAP / NetApp, Inc. | 0.01 | 1,521.72 | 0.86 | 1,518.87 | 0.4118 | -0.0403 | |||
| CART / Maplebear Inc. | 0.02 | 1,661.50 | 0.80 | 1,860.98 | 0.3858 | 0.0373 | |||
| ULTA / Ulta Beauty, Inc. | 0.00 | 42,450.00 | 0.80 | 80,100.00 | 0.3848 | 0.3547 | |||
| APP / AppLovin Corporation | 0.00 | 1,124.68 | 0.74 | 1,382.00 | 0.3554 | -0.0700 | |||
| STNE / StoneCo Ltd. | 0.05 | 1,534.64 | 0.73 | 2,330.00 | 0.3500 | 0.0934 | |||
| ORLY / O'Reilly Automotive, Inc. | 0.00 | 1,987.50 | 0.69 | 2,040.63 | 0.3285 | 0.0489 | |||
| UNH / UnitedHealth Group Incorporated | 0.00 | 0.68 | 0.3255 | 0.3255 | |||||
| DELL / Dell Technologies Inc. | 0.01 | 561.81 | 0.64 | 621.35 | 0.3079 | -0.4521 | |||
| CRM / Salesforce, Inc. | 0.00 | 1,685.93 | 0.64 | 1,497.50 | 0.3068 | -0.0342 | |||
| ENPH / Enphase Energy, Inc. | 0.02 | 0.63 | 0.3040 | 0.3040 | |||||
| INCY / Incyte Corporation | 0.01 | 1,576.79 | 0.63 | 1,388.10 | 0.2998 | -0.0574 | |||
| RCL / Royal Caribbean Cruises Ltd. | 0.00 | 1,640.88 | 0.61 | 1,754.55 | 0.2939 | 0.0079 | |||
| REGN / Regeneron Pharmaceuticals, Inc. | 0.00 | 1,731.34 | 0.60 | 1,206.52 | 0.2885 | -0.1086 | |||
| PEGA / Pegasystems Inc. | 0.01 | 1,665.99 | 0.60 | 2,107.41 | 0.2859 | 0.0569 | |||
| RYAN / Ryan Specialty Holdings, Inc. | 0.01 | 1,631.45 | 0.57 | 1,684.38 | 0.2740 | 0.0003 | |||
| CAH / Cardinal Health, Inc. | 0.00 | 1,293.02 | 0.56 | 1,581.82 | 0.2662 | -0.0172 | |||
| ILMN / Illumina, Inc. | 0.01 | 1,476.43 | 0.54 | 1,370.27 | 0.2611 | -0.0550 | |||
| EPAM / EPAM Systems, Inc. | 0.00 | 0.50 | 0.2421 | 0.2421 | |||||
| INTU / Intuit Inc. | 0.00 | 939.06 | 0.50 | 1,184.62 | 0.2403 | -0.0929 | |||
| MUSA / Murphy USA Inc. | 0.00 | 1,714.06 | 0.50 | 1,550.00 | 0.2376 | -0.0171 | |||
| VRTX / Vertex Pharmaceuticals Incorporated | 0.00 | 1,511.59 | 0.49 | 1,387.88 | 0.2357 | -0.0451 | |||
| NOW / ServiceNow, Inc. | 0.00 | 410.00 | 0.46 | 459.04 | 0.2226 | -0.4872 | |||
| KMB / Kimberly-Clark Corporation | 0.00 | 445.49 | 0.45 | 456.79 | 0.2166 | -0.4772 | |||
| CAVA / CAVA Group, Inc. | 0.01 | 503.65 | 0.44 | 421.18 | 0.2127 | -0.5159 | |||
| AZO / AutoZone, Inc. | 0.00 | 1,866.67 | 0.44 | 2,100.00 | 0.2112 | 0.0335 | |||
| TEAM / Atlassian Corporation | 0.00 | 1,978.79 | 0.43 | 1,425.00 | 0.2049 | -0.0338 | |||
| MSCI / MSCI Inc. | 0.00 | 1,525.00 | 0.40 | 1,512.00 | 0.1934 | -0.0270 | |||
| WU / The Western Union Company | 0.04 | 1,759.53 | 0.40 | 1,500.00 | 0.1920 | -0.0211 | |||
| EBAY / eBay Inc. | 0.01 | 776.98 | 0.37 | 908.11 | 0.1791 | -0.1405 | |||
| HUBS / HubSpot, Inc. | 0.00 | 1,420.51 | 0.35 | 1,146.43 | 0.1678 | -0.0717 | |||
| KLAC / KLA Corporation | 0.00 | 1,350.00 | 0.29 | 1,483.33 | 0.1368 | -0.0195 | |||
| LYV / Live Nation Entertainment, Inc. | 0.00 | 1,924.18 | 0.25 | 1,838.46 | 0.1212 | 0.0105 | |||
| MCO / Moody's Corporation | 0.00 | 1,336.11 | 0.25 | 1,272.22 | 0.1188 | -0.0350 | |||
| MRK / Merck & Co., Inc. | 0.00 | 512.19 | 0.25 | 412.50 | 0.1184 | -0.2923 | |||
| PSTG / Pure Storage, Inc. | 0.00 | 27,787.50 | 0.24 | 0.1147 | 0.0982 | ||||
| GE / General Electric Company | 0.00 | 1,346.15 | 0.23 | 1,676.92 | 0.1109 | -0.0033 | |||
| WFRD / Weatherford International plc | 0.01 | 0.22 | 0.1076 | 0.1076 | |||||
| ADSK / Autodesk, Inc. | 0.00 | 1,871.05 | 0.22 | 2,110.00 | 0.1064 | 0.0180 | |||
| DPZ / Domino's Pizza, Inc. | 0.00 | 2,042.86 | 0.21 | 2,030.00 | 0.1022 | 0.0150 | |||
| SRPT / Sarepta Therapeutics, Inc. | 0.01 | 0.21 | 0.0992 | 0.0992 | |||||
| LMT / Lockheed Martin Corporation | 0.00 | 0.20 | 0.0944 | 0.0944 | |||||
| ALNY / Alnylam Pharmaceuticals, Inc. | 0.00 | 1,688.89 | 0.20 | 2,350.00 | 0.0941 | 0.0187 | |||
| CTAS / Cintas Corporation | 0.00 | 0.19 | 0.0898 | 0.0898 | |||||
| ONTO / Onto Innovation Inc. | 0.00 | 0.18 | 0.0869 | 0.0869 | |||||
| GTLB / GitLab Inc. | 0.00 | 1,413.73 | 0.16 | 1,042.86 | 0.0770 | -0.0420 | |||
| AYI / Acuity Inc. | 0.00 | 1,600.00 | 0.15 | 1,440.00 | 0.0742 | -0.0140 | |||
| GTM / ZoomInfo Technologies Inc. | 0.01 | 802.24 | 0.12 | 668.75 | 0.0591 | -0.0824 | |||
| CLX / The Clorox Company | 0.00 | 831.63 | 0.12 | 700.00 | 0.0577 | -0.0722 | |||
| NCLH / Norwegian Cruise Line Holdings Ltd. | 0.01 | 2,190.34 | 0.12 | 1,850.00 | 0.0562 | 0.0003 | |||
| TRIP / Tripadvisor, Inc. | 0.00 | 0.06 | 0.0307 | 0.0307 | |||||
| CRWD / CrowdStrike Holdings, Inc. | 0.00 | -16.67 | 0.00 | 0.00 | 0.0023 | -0.0374 | |||
| ELF / e.l.f. Beauty, Inc. | 0.00 | -100.00 | 0.00 | -100.00 | -0.0316 | ||||
| EQH / Equitable Holdings, Inc. | 0.00 | -100.00 | 0.00 | -100.00 | -0.0532 | ||||
| VRT / Vertiv Holdings Co | 0.00 | -100.00 | 0.00 | -100.00 | -0.0718 |