Mga Batayang Estadistika
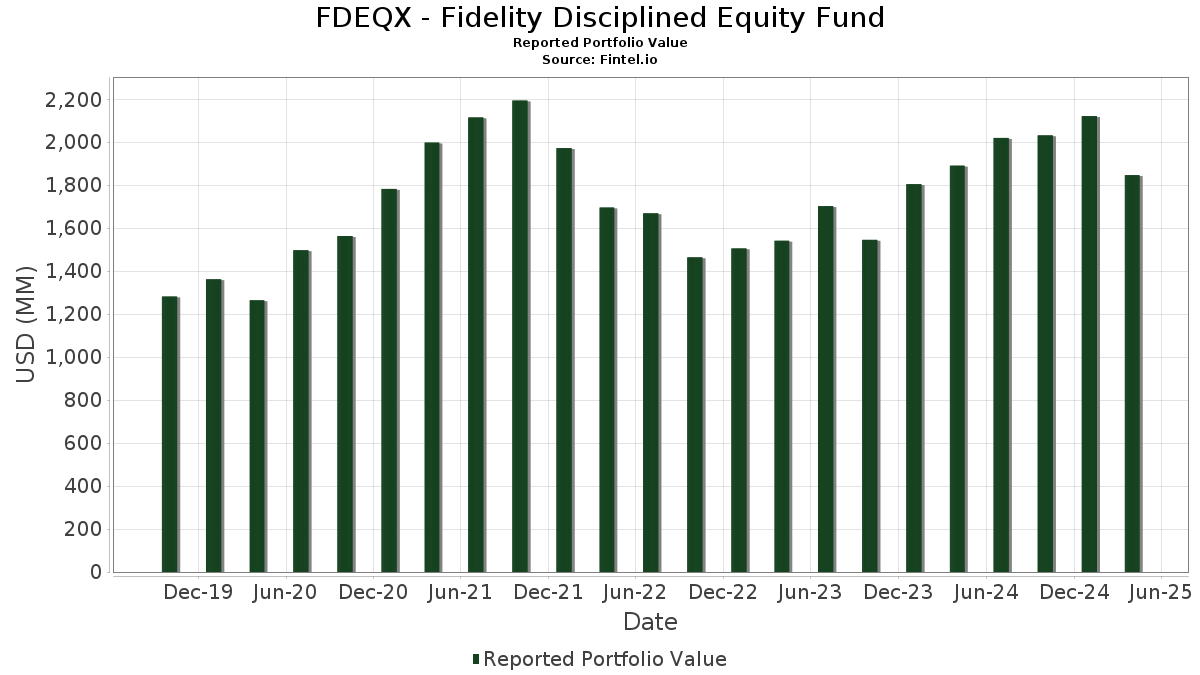
| Nilai Portofolio | $ 1,846,725,718 |
| Posisi Saat Ini | 106 |
Kepemilikan Terbaru, Kinerja, AUM (dari 13F, 13D)
FDEQX - Fidelity Disciplined Equity Fund telah mengungkapkan total kepemilikan 106 dalam pengajuan SEC terbaru mereka. Nilai portofolio terbaru dihitung sebesar $ 1,846,725,718 USD. Aset yang Dikelola (AUM) sebenarnya adalah nilai ini ditambah kas (yang tidak diungkapkan). Aset-aset utama FDEQX - Fidelity Disciplined Equity Fund adalah Microsoft Corporation (US:MSFT) , NVIDIA Corporation (US:NVDA) , Amazon.com, Inc. (US:AMZN) , Meta Platforms, Inc. (US:META) , and Apple Inc. (US:AAPL) . Posisi baru FDEQX - Fidelity Disciplined Equity Fund meliputi: Gilead Sciences, Inc. (US:GILD) , Marsh & McLennan Companies, Inc. (US:MMC) , Axon Enterprise, Inc. (GB:0HKE) , Howmet Aerospace Inc. (US:HWM) , and GE Vernova Inc. (GB:0ADM) .
Peningkatan Tertinggi Kuartal Ini
Kami menggunakan perubahan dalam alokasi portofolio karena ini adalah metrik yang paling bermakna. Perubahan dapat disebabkan oleh perdagangan atau perubahan harga saham.
| Keamanan | Saham (MM) |
Nilai (Juta Dolar AS) |
Portfolio % | ΔPorsyento ng Portfolio |
|---|---|---|---|---|
| 49.30 | 49.31 | 2.6745 | 2.0987 | |
| 0.23 | 24.62 | 1.3355 | 1.3355 | |
| 0.10 | 22.05 | 1.1961 | 1.1961 | |
| 0.03 | 18.77 | 1.0179 | 1.0179 | |
| 0.12 | 17.11 | 0.9283 | 0.9283 | |
| 0.04 | 16.65 | 0.9031 | 0.9031 | |
| 0.01 | 22.28 | 1.2087 | 0.8332 | |
| 0.06 | 50.70 | 2.7501 | 0.7012 | |
| 0.08 | 12.61 | 0.6842 | 0.6842 | |
| 0.04 | 43.16 | 2.3409 | 0.5499 |
Penurunan Tertinggi Kuartal Ini
Kami menggunakan perubahan dalam alokasi portofolio karena ini adalah metrik yang paling bermakna. Perubahan dapat disebabkan oleh perdagangan atau perubahan harga saham.
| Keamanan | Saham (MM) |
Nilai (Juta Dolar AS) |
Portfolio % | ΔPorsyento ng Portfolio |
|---|---|---|---|---|
| 0.48 | 88.92 | 4.8232 | -0.8270 | |
| 0.21 | 40.86 | 2.2164 | -0.7153 | |
| 0.29 | 46.31 | 2.5117 | -0.6288 | |
| 0.25 | 39.74 | 2.1555 | -0.5937 | |
| 0.34 | 133.61 | 7.2474 | -0.5691 | |
| 0.38 | 80.88 | 4.3870 | -0.5084 | |
| 0.00 | 0.00 | -0.4906 | ||
| 0.00 | 3.24 | 0.1759 | -0.4506 | |
| 0.01 | 1.08 | 0.0584 | -0.4411 | |
| 0.04 | 5.72 | 0.3101 | -0.3500 |
Pengajuan 13F dan Dana
Formulir ini diajukan pada 2025-06-26 untuk periode pelaporan 2025-04-30. Klik ikon tautan untuk melihat riwayat transaksi selengkapnya.
Tingkatkan ke versi premium untuk membuka data premium dan ekspor ke Excel. ![]() .
.
| Keamanan | Ketik | Harga Saham Rata-rata | Saham (MM) |
ΔSaham (%) |
ΔSaham (%) |
Nilai ($MM) |
Portpolyo (%) |
ΔPortofolio (%) |
|
|---|---|---|---|---|---|---|---|---|---|
| MSFT / Microsoft Corporation | 0.34 | -15.24 | 133.61 | -19.29 | 7.2474 | -0.5691 | |||
| NVDA / NVIDIA Corporation | 1.17 | -7.37 | 127.94 | -15.97 | 6.9394 | -0.2499 | |||
| AMZN / Amazon.com, Inc. | 0.48 | -4.23 | 88.92 | -25.69 | 4.8232 | -0.8270 | |||
| META / Meta Platforms, Inc. | 0.15 | 2.40 | 84.37 | -18.43 | 4.5763 | -0.3074 | |||
| AAPL / Apple Inc. | 0.38 | -13.36 | 80.88 | -21.99 | 4.3870 | -0.5084 | |||
| LLY / Eli Lilly and Company | 0.06 | 5.42 | 50.70 | 16.84 | 2.7501 | 0.7012 | |||
| US31635A1051 / Fidelity Cash Central Fund | 49.30 | 304.35 | 49.31 | 304.35 | 2.6745 | 2.0987 | |||
| GOOGL / Alphabet Inc. | 0.29 | -10.55 | 46.31 | -30.38 | 2.5117 | -0.6288 | |||
| NFLX / Netflix, Inc. | 0.04 | -1.80 | 43.16 | 13.78 | 2.3409 | 0.5499 | |||
| V / Visa Inc. | 0.12 | 0.00 | 42.68 | 1.08 | 2.3151 | 0.3214 | |||
| AVGO / Broadcom Inc. | 0.21 | -24.34 | 40.86 | -34.19 | 2.2164 | -0.7153 | |||
| GE / General Electric Company | 0.20 | 8.39 | 39.82 | 7.31 | 2.1601 | 0.4078 | |||
| GOOG / Alphabet Inc. | 0.25 | -12.78 | 39.74 | -31.75 | 2.1555 | -0.5937 | |||
| JPM / JPMorgan Chase & Co. | 0.16 | -16.98 | 38.87 | -24.02 | 2.1086 | -0.3073 | |||
| COST / Costco Wholesale Corporation | 0.04 | -7.26 | 38.10 | -5.88 | 2.0668 | 0.1553 | |||
| MA / Mastercard Incorporated | 0.06 | 6.53 | 33.99 | 5.11 | 1.8434 | 0.3168 | |||
| BSX / Boston Scientific Corporation | 0.27 | 0.00 | 28.16 | 0.50 | 1.5274 | 0.2044 | |||
| GILD / Gilead Sciences, Inc. | 0.23 | 24.62 | 1.3355 | 1.3355 | |||||
| ETN / Eaton Corporation plc | 0.08 | -10.25 | 24.49 | -19.06 | 1.3285 | -0.1004 | |||
| APH / Amphenol Corporation | 0.32 | -0.19 | 24.47 | 8.51 | 1.3272 | 0.2625 | |||
| UNH / UnitedHealth Group Incorporated | 0.06 | -1.91 | 23.24 | -25.60 | 1.2604 | -0.2144 | |||
| TT / Trane Technologies plc | 0.06 | 5.36 | 22.62 | 11.33 | 1.2267 | 0.2675 | |||
| TDG / TransDigm Group Incorporated | 0.02 | 0.00 | 22.61 | 4.42 | 1.2264 | 0.2039 | |||
| FICO / Fair Isaac Corporation | 0.01 | -26.10 | 22.28 | 180.65 | 1.2087 | 0.8332 | |||
| MMC / Marsh & McLennan Companies, Inc. | 0.10 | 22.05 | 1.1961 | 1.1961 | |||||
| PH / Parker-Hannifin Corporation | 0.04 | -6.92 | 21.96 | -20.35 | 1.1913 | -0.1107 | |||
| BAC / Bank of America Corporation | 0.54 | -19.22 | 21.40 | -30.43 | 1.1607 | -0.2915 | |||
| CTAS / Cintas Corporation | 0.10 | 33.31 | 20.59 | 40.70 | 1.1166 | 0.4257 | |||
| WFC / Wells Fargo & Company | 0.28 | -22.98 | 20.07 | -30.59 | 1.0885 | -0.2767 | |||
| 0HKE / Axon Enterprise, Inc. | 0.03 | 18.77 | 1.0179 | 1.0179 | |||||
| WAB / Westinghouse Air Brake Technologies Corporation | 0.10 | 14.65 | 17.64 | 1.87 | 0.9570 | 0.1392 | |||
| HWM / Howmet Aerospace Inc. | 0.12 | 17.11 | 0.9283 | 0.9283 | |||||
| 0ADM / GE Vernova Inc. | 0.04 | 16.65 | 0.9031 | 0.9031 | |||||
| ANET / Arista Networks Inc | 0.20 | 18.44 | 16.44 | -15.44 | 0.8916 | -0.0263 | |||
| MCO / Moody's Corporation | 0.04 | 0.00 | 16.42 | -9.28 | 0.8907 | 0.0361 | |||
| CDNS / Cadence Design Systems, Inc. | 0.05 | -20.25 | 15.94 | -20.22 | 0.8648 | -0.0788 | |||
| SPGI / S&P Global Inc. | 0.03 | 103.48 | 15.83 | 95.14 | 0.8587 | 0.4756 | |||
| AJG / Arthur J. Gallagher & Co. | 0.05 | 32.53 | 15.81 | 40.82 | 0.8576 | 0.3274 | |||
| HEIA / Heico Corp. - Class A | 0.08 | 69.68 | 15.46 | 79.14 | 0.8386 | 0.4311 | |||
| TMO / Thermo Fisher Scientific Inc. | 0.04 | 30.00 | 15.06 | -6.70 | 0.8168 | 0.0547 | |||
| KLAC / KLA Corporation | 0.02 | 29.12 | 13.97 | 22.91 | 0.7579 | 0.2211 | |||
| SNPS / Synopsys, Inc. | 0.03 | -21.22 | 13.63 | -31.19 | 0.7395 | -0.1960 | |||
| ISRG / Intuitive Surgical, Inc. | 0.03 | -22.41 | 13.57 | -30.02 | 0.7362 | -0.1796 | |||
| CMG / Chipotle Mexican Grill, Inc. | 0.26 | 12.49 | 13.37 | -2.60 | 0.7254 | 0.0771 | |||
| FTNT / Fortinet, Inc. | 0.13 | -9.68 | 12.98 | -7.10 | 0.7039 | 0.0443 | |||
| KKR / KKR & Co. Inc. | 0.11 | -3.44 | 12.84 | -33.96 | 0.6967 | -0.2216 | |||
| ARES / Ares Management Corporation | 0.08 | 12.61 | 0.6842 | 0.6842 | |||||
| SPOT / Spotify Technology S.A. | 0.02 | 110.23 | 11.36 | 135.30 | 0.6161 | 0.3882 | |||
| AMT / American Tower Corporation | 0.05 | -44.12 | 11.14 | -41.01 | 0.6040 | -0.3266 | |||
| PANW / Palo Alto Networks, Inc. | 0.06 | 9.80 | 10.47 | 11.30 | 0.5678 | 0.1237 | |||
| LRCX / Lam Research Corporation | 0.13 | -6.79 | 9.64 | -17.58 | 0.5231 | -0.0294 | |||
| APO / Apollo Global Management, Inc. | 0.07 | 12.46 | 9.61 | -10.23 | 0.5212 | 0.0158 | |||
| EME / EMCOR Group, Inc. | 0.02 | -7.92 | 8.86 | -17.65 | 0.4803 | -0.0274 | |||
| DHR / Danaher Corporation | 0.04 | -36.58 | 8.78 | -43.24 | 0.4762 | -0.2542 | |||
| HUBS / HubSpot, Inc. | 0.01 | -16.71 | 8.23 | -34.66 | 0.4465 | -0.1484 | |||
| ALNY / Alnylam Pharmaceuticals, Inc. | 0.03 | 67.96 | 8.00 | 62.97 | 0.4341 | 0.2022 | |||
| ITT / ITT Inc. | 0.06 | 0.00 | 7.80 | -9.27 | 0.4232 | 0.0172 | |||
| COMP / Compass, Inc. | 1.00 | 170.25 | 7.76 | 187.83 | 0.4208 | 0.2935 | |||
| CPRT / Copart, Inc. | 0.12 | 32.28 | 7.55 | 39.36 | 0.4097 | 0.1538 | |||
| EVR / Evercore Inc. | 0.04 | -13.03 | 7.53 | -38.70 | 0.4087 | -0.1717 | |||
| VTR / Ventas, Inc. | 0.09 | 6.57 | 0.3566 | 0.3566 | |||||
| CEG / Constellation Energy Corporation | 0.03 | -28.50 | 6.50 | -46.74 | 0.3527 | -0.2238 | |||
| EOG / EOG Resources, Inc. | 0.06 | 82.68 | 6.36 | 60.25 | 0.3451 | 0.1576 | |||
| PHM / PulteGroup, Inc. | 0.06 | -32.20 | 6.33 | -38.87 | 0.3433 | -0.1456 | |||
| Z / Zillow Group, Inc. | 0.09 | 127.66 | 6.04 | 86.45 | 0.3276 | 0.1746 | |||
| SNA / Snap-on Incorporated | 0.02 | -41.59 | 5.99 | -48.39 | 0.3251 | -0.2232 | |||
| MSCI / MSCI Inc. | 0.01 | -16.61 | 5.75 | -23.83 | 0.3118 | -0.0445 | |||
| VST / Vistra Corp. | 0.04 | -47.00 | 5.72 | -59.11 | 0.3101 | -0.3500 | |||
| VMC / Vulcan Materials Company | 0.02 | -50.80 | 5.64 | -52.92 | 0.3059 | -0.2598 | |||
| THC / Tenet Healthcare Corporation | 0.04 | -14.35 | 5.37 | -13.11 | 0.2915 | -0.0005 | |||
| HOOD / Robinhood Markets, Inc. | 0.11 | 5.33 | 0.2890 | 0.2890 | |||||
| NTNX / Nutanix, Inc. | 0.08 | -0.51 | 5.31 | -0.62 | 0.2881 | 0.0358 | |||
| MLM / Martin Marietta Materials, Inc. | 0.01 | -28.87 | 5.29 | -31.50 | 0.2871 | -0.0778 | |||
| BKR / Baker Hughes Company | 0.14 | -36.50 | 5.04 | -12.51 | 0.2732 | -0.0723 | |||
| DOCS / Doximity, Inc. | 0.09 | 4.85 | 0.2629 | 0.2629 | |||||
| TMDX / TransMedics Group, Inc. | 0.05 | 58.54 | 4.78 | 115.98 | 0.2595 | 0.1549 | |||
| HLI / Houlihan Lokey, Inc. | 0.03 | -40.53 | 4.73 | -46.96 | 0.2567 | -0.1646 | |||
| BA / The Boeing Company | 0.03 | 4.58 | 0.2485 | 0.2485 | |||||
| CAVA / CAVA Group, Inc. | 0.05 | -19.64 | 4.54 | -45.00 | 0.2462 | -0.1435 | |||
| VEEV / Veeva Systems Inc. | 0.02 | 97.94 | 4.49 | 98.32 | 0.2434 | 0.1365 | |||
| MNST / Monster Beverage Corporation | 0.07 | -43.98 | 4.39 | -30.87 | 0.2384 | -0.0618 | |||
| FIX / Comfort Systems USA, Inc. | 0.01 | -50.92 | 4.25 | -55.33 | 0.2307 | -0.2188 | |||
| DKS / DICK'S Sporting Goods, Inc. | 0.02 | 0.00 | 4.24 | -21.81 | 0.2301 | -0.0260 | |||
| FTI / TechnipFMC plc | 0.14 | 4.05 | 0.2199 | 0.2199 | |||||
| DASH / DoorDash, Inc. | 0.02 | -12.33 | 3.84 | -10.45 | 0.2082 | 0.0058 | |||
| CF / CF Industries Holdings, Inc. | 0.05 | -8.33 | 3.71 | -22.11 | 0.2011 | -0.0236 | |||
| KBR / KBR, Inc. | 0.07 | 3.69 | 0.2002 | 0.2002 | |||||
| TRV / The Travelers Companies, Inc. | 0.01 | 0.00 | 3.57 | 7.74 | 0.1934 | 0.0371 | |||
| NVR / NVR, Inc. | 0.00 | -72.51 | 3.24 | -75.56 | 0.1759 | -0.4506 | |||
| ROKU / Roku, Inc. | 0.05 | 58.72 | 3.22 | 30.74 | 0.1749 | 0.0585 | |||
| HLT / Hilton Worldwide Holdings Inc. | 0.01 | -15.89 | 3.10 | -25.94 | 0.1684 | -0.0295 | |||
| JLL / Jones Lang LaSalle Incorporated | 0.01 | -60.37 | 2.91 | -68.14 | 0.1579 | -0.2734 | |||
| PCTY / Paylocity Holding Corporation | 0.01 | 51.52 | 2.88 | 41.64 | 0.1563 | 0.0602 | |||
| EXEL / Exelixis, Inc. | 0.07 | 2.86 | 0.1550 | 0.1550 | |||||
| US31635A3032 / Fidelity Securities Lending Cash Central Fund | 2.58 | -2.32 | 2.59 | -2.31 | 0.1402 | 0.0153 | |||
| APP / AppLovin Corporation | 0.01 | -50.26 | 2.53 | -63.77 | 0.1373 | -0.1925 | |||
| PNR / Pentair plc | 0.03 | 0.00 | 2.50 | -12.49 | 0.1353 | 0.0007 | |||
| CVNA / Carvana Co. | 0.01 | 100.00 | 2.10 | 97.46 | 0.1140 | 0.0637 | |||
| DECK / Deckers Outdoor Corporation | 0.02 | 1.92 | 0.1040 | 0.1040 | |||||
| ABNB / Airbnb, Inc. | 0.01 | -60.50 | 1.74 | -63.29 | 0.0946 | -0.1296 | |||
| NOW / ServiceNow, Inc. | 0.00 | 0.00 | 1.29 | -6.18 | 0.0700 | 0.0050 | |||
| SHW / The Sherwin-Williams Company | 0.00 | -82.04 | 1.16 | -82.32 | 0.0628 | -0.2463 | |||
| VRT / Vertiv Holdings Co | 0.01 | -86.06 | 1.08 | -89.84 | 0.0584 | -0.4411 | |||
| MRVL / Marvell Technology, Inc. | 0.02 | 1.02 | 0.0554 | 0.0554 | |||||
| MAR / Marriott International, Inc. | 0.00 | -81.65 | 0.95 | -84.94 | 0.0518 | -0.2474 | |||
| PSTG / Pure Storage, Inc. | 0.00 | 0.00 | 0.00 | -33.33 | 0.0002 | -0.0001 | |||
| ONTO / Onto Innovation Inc. | 0.00 | -100.00 | 0.00 | -100.00 | -0.1972 | ||||
| OVV / Ovintiv Inc. | 0.00 | -100.00 | 0.00 | -100.00 | -0.0443 | ||||
| ZM / Zoom Communications Inc. | 0.00 | -100.00 | 0.00 | -100.00 | -0.1548 | ||||
| ORCL / Oracle Corporation | 0.00 | -100.00 | 0.00 | -100.00 | -0.4906 | ||||
| TOST / Toast, Inc. | 0.00 | -100.00 | 0.00 | -100.00 | -0.1063 | ||||
| CFLT / Confluent, Inc. | 0.00 | -100.00 | 0.00 | -100.00 | -0.0933 | ||||
| COHR / Coherent Corp. | 0.00 | -100.00 | 0.00 | -100.00 | -0.0944 | ||||
| PTON / Peloton Interactive, Inc. | 0.00 | -100.00 | 0.00 | -100.00 | -0.0818 | ||||
| ODFL / Old Dominion Freight Line, Inc. | 0.00 | -100.00 | 0.00 | -100.00 | -0.3313 | ||||
| AME / AMETEK, Inc. | 0.00 | -100.00 | 0.00 | -100.00 | -0.3306 |