Mga Batayang Estadistika
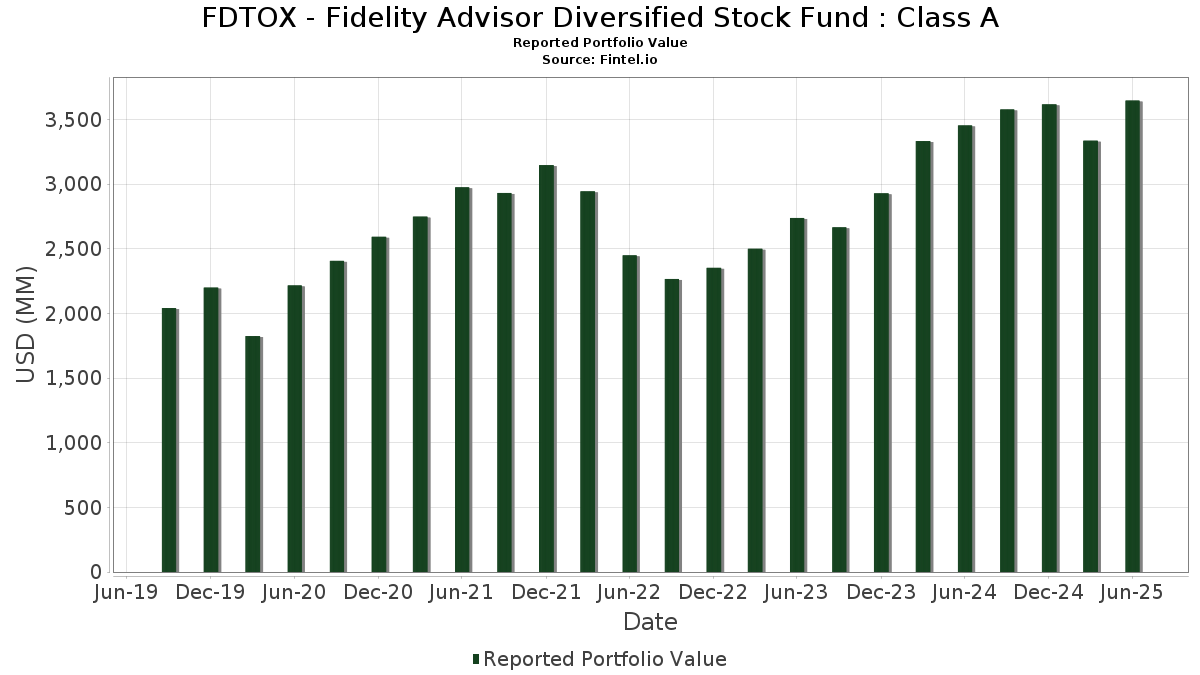
| Nilai Portofolio | $ 3,645,403,048 |
| Posisi Saat Ini | 237 |
Kepemilikan Terbaru, Kinerja, AUM (dari 13F, 13D)
FDTOX - Fidelity Advisor Diversified Stock Fund : Class A telah mengungkapkan total kepemilikan 237 dalam pengajuan SEC terbaru mereka. Nilai portofolio terbaru dihitung sebesar $ 3,645,403,048 USD. Aset yang Dikelola (AUM) sebenarnya adalah nilai ini ditambah kas (yang tidak diungkapkan). Aset-aset utama FDTOX - Fidelity Advisor Diversified Stock Fund : Class A adalah NVIDIA Corporation (US:NVDA) , Microsoft Corporation (US:MSFT) , Apple Inc. (US:AAPL) , Amazon.com, Inc. (US:AMZN) , and Meta Platforms, Inc. (US:META) . Posisi baru FDTOX - Fidelity Advisor Diversified Stock Fund : Class A meliputi: AutoZone, Inc. (US:AZO) , Palantir Technologies Inc. (US:PLTR) , Dycom Industries, Inc. (US:DY) , Tencent Holdings Limited (DE:NNND) , and Zscaler, Inc. (US:ZS) .
Peningkatan Tertinggi Kuartal Ini
Kami menggunakan perubahan dalam alokasi portofolio karena ini adalah metrik yang paling bermakna. Perubahan dapat disebabkan oleh perdagangan atau perubahan harga saham.
| Keamanan | Saham (MM) |
Nilai (Juta Dolar AS) |
Portfolio % | ΔPorsyento ng Portfolio |
|---|---|---|---|---|
| 2.00 | 316.14 | 8.6923 | 3.5339 | |
| 0.58 | 287.06 | 7.8928 | 2.4771 | |
| 0.31 | 85.20 | 2.3427 | 1.2226 | |
| 0.19 | 42.40 | 1.1658 | 0.9135 | |
| 0.21 | 25.36 | 0.6972 | 0.6972 | |
| 0.12 | 28.45 | 0.7823 | 0.6904 | |
| 0.12 | 25.49 | 0.7009 | 0.5962 | |
| 0.29 | 52.87 | 1.4537 | 0.5825 | |
| 0.26 | 19.35 | 0.5320 | 0.5320 | |
| 0.08 | 40.80 | 1.1217 | 0.4961 |
Penurunan Tertinggi Kuartal Ini
Kami menggunakan perubahan dalam alokasi portofolio karena ini adalah metrik yang paling bermakna. Perubahan dapat disebabkan oleh perdagangan atau perubahan harga saham.
| Keamanan | Saham (MM) |
Nilai (Juta Dolar AS) |
Portfolio % | ΔPorsyento ng Portfolio |
|---|---|---|---|---|
| 23.37 | 23.37 | 0.6426 | -2.6583 | |
| 0.86 | 176.50 | 4.8529 | -1.8715 | |
| 0.02 | 7.12 | 0.1956 | -1.0008 | |
| 0.00 | 0.78 | 0.0214 | -0.8384 | |
| 0.01 | 0.66 | 0.0180 | -0.8004 | |
| 0.77 | 29.58 | 0.8132 | -0.7973 | |
| 0.44 | 49.29 | 1.3553 | -0.5276 | |
| 0.03 | 3.89 | 0.1070 | -0.4879 | |
| 0.01 | 2.57 | 0.0706 | -0.4820 | |
| 0.12 | 14.46 | 0.3976 | -0.4783 |
Pengajuan 13F dan Dana
Formulir ini diajukan pada 2025-08-22 untuk periode pelaporan 2025-06-30. Klik ikon tautan untuk melihat riwayat transaksi selengkapnya.
Tingkatkan ke versi premium untuk membuka data premium dan ekspor ke Excel. ![]() .
.
| Keamanan | Ketik | Harga Saham Rata-rata | Saham (MM) |
ΔSaham (%) |
ΔSaham (%) |
Nilai ($MM) |
Portpolyo (%) |
ΔPortofolio (%) |
|
|---|---|---|---|---|---|---|---|---|---|
| NVDA / NVIDIA Corporation | 2.00 | 26.52 | 316.14 | 84.43 | 8.6923 | 3.5339 | |||
| MSFT / Microsoft Corporation | 0.58 | 20.38 | 287.06 | 59.51 | 7.8928 | 2.4771 | |||
| AAPL / Apple Inc. | 0.86 | -14.48 | 176.50 | -21.01 | 4.8529 | -1.8715 | |||
| AMZN / Amazon.com, Inc. | 0.79 | -9.32 | 173.03 | 4.56 | 4.7576 | -0.2225 | |||
| META / Meta Platforms, Inc. | 0.18 | -6.79 | 132.66 | 19.36 | 3.6474 | 0.3029 | |||
| GOOG / Alphabet Inc. | 0.49 | -12.73 | 86.95 | -0.91 | 2.3907 | -0.2499 | |||
| AVGO / Broadcom Inc. | 0.31 | 39.05 | 85.20 | 128.92 | 2.3427 | 1.2226 | |||
| NFLX / Netflix, Inc. | 0.04 | -10.08 | 57.31 | 29.12 | 1.5759 | 0.2401 | |||
| MA / Mastercard Incorporated | 0.10 | -15.07 | 56.68 | -12.93 | 1.5583 | -0.4005 | |||
| PM / Philip Morris International Inc. | 0.29 | 59.16 | 52.87 | 82.62 | 1.4537 | 0.5825 | |||
| DE / Deere & Company | 0.10 | 20.17 | 49.98 | 30.19 | 1.3743 | 0.2190 | |||
| GILD / Gilead Sciences, Inc. | 0.44 | -20.38 | 49.29 | -21.22 | 1.3553 | -0.5276 | |||
| V / Visa Inc. | 0.14 | -16.89 | 48.93 | -15.80 | 1.3452 | -0.4034 | |||
| TSM / Taiwan Semiconductor Manufacturing Company Limited - Depositary Receipt (Common Stock) | 0.19 | 270.69 | 42.40 | 405.76 | 1.1658 | 0.9135 | |||
| BA / The Boeing Company | 0.20 | 21.00 | 41.53 | 48.66 | 1.1420 | 0.3012 | |||
| GEV / GE Vernova Inc. | 0.08 | 13.22 | 40.80 | 96.24 | 1.1217 | 0.4961 | |||
| TT / Trane Technologies plc | 0.09 | -17.63 | 37.59 | 6.93 | 1.0337 | -0.0243 | |||
| LLY / Eli Lilly and Company | 0.05 | -14.14 | 35.50 | -18.96 | 0.9760 | -0.3422 | |||
| LOW / Lowe's Companies, Inc. | 0.16 | -5.96 | 34.98 | -10.54 | 0.9618 | -0.2150 | |||
| BSX / Boston Scientific Corporation | 0.30 | -30.28 | 32.61 | -25.77 | 0.8967 | -0.4255 | |||
| APH / Amphenol Corporation | 0.32 | 27.42 | 31.85 | 91.84 | 0.8756 | 0.3761 | |||
| WFC / Wells Fargo & Company | 0.37 | -37.57 | 30.04 | -30.33 | 0.8259 | -0.4714 | |||
| BKR / Baker Hughes Company | 0.77 | -36.65 | 29.58 | -44.74 | 0.8132 | -0.7973 | |||
| SPF / Spotify Technology S.A. | 0.04 | 65.37 | 29.31 | 130.71 | 0.8059 | 0.4236 | |||
| VTR / Ventas, Inc. | 0.46 | 126.73 | 28.83 | 108.25 | 0.7928 | 0.3761 | |||
| CBOE / Cboe Global Markets, Inc. | 0.12 | 803.70 | 28.45 | 831.60 | 0.7823 | 0.6904 | |||
| SCHW / The Charles Schwab Corporation | 0.31 | 37.66 | 28.45 | 60.45 | 0.7822 | 0.2486 | |||
| WMT / Walmart Inc. | 0.28 | 17.01 | 27.44 | 30.33 | 0.7544 | 0.1209 | |||
| BK / The Bank of New York Mellon Corporation | 0.29 | 6.78 | 26.27 | 16.00 | 0.7222 | 0.0408 | |||
| PSA / Public Storage | 0.09 | 0.23 | 25.64 | -1.74 | 0.7051 | -0.0803 | |||
| ORCL / Oracle Corporation | 0.12 | 368.27 | 25.49 | 632.32 | 0.7009 | 0.5962 | |||
| BC / Brunello Cucinelli S.p.A. | 0.21 | 25.36 | 0.6972 | 0.6972 | |||||
| SAP / SAP SE - Depositary Receipt (Common Stock) | 0.08 | 52.57 | 25.24 | 72.84 | 0.6940 | 0.2545 | |||
| AJG / Arthur J. Gallagher & Co. | 0.07 | 12.47 | 23.39 | 4.29 | 0.6430 | -0.0318 | |||
| US31635A1051 / Fidelity Cash Central Fund | 23.37 | -78.69 | 23.37 | -78.69 | 0.6426 | -2.6583 | |||
| MS / Morgan Stanley | 0.16 | -32.90 | 23.04 | -18.98 | 0.6336 | -0.2224 | |||
| COST / Costco Wholesale Corporation | 0.02 | 30.68 | 22.77 | 36.79 | 0.6260 | 0.1251 | |||
| JPM / JPMorgan Chase & Co. | 0.08 | 0.00 | 22.53 | 18.19 | 0.6194 | 0.0458 | |||
| PODD / Insulet Corporation | 0.07 | -2.07 | 22.28 | 17.16 | 0.6125 | 0.0403 | |||
| ARGX / argenx SE - Depositary Receipt (Common Stock) | 0.04 | -2.94 | 21.83 | -9.61 | 0.6002 | -0.1265 | |||
| IBM / International Business Machines Corporation | 0.07 | 5.98 | 21.43 | 25.63 | 0.5892 | 0.0759 | |||
| ALNY / Alnylam Pharmaceuticals, Inc. | 0.07 | 2.02 | 21.39 | 23.21 | 0.5882 | 0.0657 | |||
| CARR / Carrier Global Corporation | 0.29 | -10.93 | 21.30 | 2.83 | 0.5856 | -0.0377 | |||
| CB / Chubb Limited | 0.07 | 42.03 | 20.66 | 36.27 | 0.5680 | 0.1118 | |||
| HWM / Howmet Aerospace Inc. | 0.11 | 2.40 | 20.64 | 46.92 | 0.5676 | 0.1448 | |||
| ET / Energy Transfer LP - Limited Partnership | 1.13 | 0.31 | 20.50 | -2.17 | 0.5637 | -0.0670 | |||
| CTVA / Corteva, Inc. | 0.26 | 19.35 | 0.5320 | 0.5320 | |||||
| WAB / Westinghouse Air Brake Technologies Corporation | 0.09 | 20.88 | 18.90 | 39.55 | 0.5198 | 0.1121 | |||
| MMM / 3M Company | 0.12 | -35.61 | 18.77 | -33.25 | 0.5161 | -0.3302 | |||
| ABT / Abbott Laboratories | 0.13 | 45.38 | 17.56 | 49.06 | 0.4828 | 0.1283 | |||
| MELI / MercadoLibre, Inc. | 0.01 | 644.44 | 17.51 | 897.78 | 0.4815 | 0.4286 | |||
| CF / CF Industries Holdings, Inc. | 0.18 | 2.42 | 16.73 | 20.57 | 0.4601 | 0.0425 | |||
| Z / Zillow Group, Inc. | 0.23 | -12.95 | 16.38 | -11.06 | 0.4505 | -0.1039 | |||
| CVS / CVS Health Corporation | 0.24 | 240.58 | 16.33 | 246.79 | 0.4489 | 0.3072 | |||
| MOH / Molina Healthcare, Inc. | 0.05 | 21.57 | 16.12 | 9.95 | 0.4431 | 0.0020 | |||
| MRVL / Marvell Technology, Inc. | 0.21 | -20.14 | 15.90 | 0.40 | 0.4372 | -0.0394 | |||
| COF / Capital One Financial Corporation | 0.07 | 27.69 | 15.89 | 51.52 | 0.4370 | 0.1213 | |||
| APO / Apollo Global Management, Inc. | 0.11 | -27.07 | 15.63 | -24.44 | 0.4299 | -0.1928 | |||
| GOOGL / Alphabet Inc. | 0.09 | 0.23 | 15.49 | 14.22 | 0.4259 | 0.0178 | |||
| AEM / Agnico Eagle Mines Limited | 0.12 | -54.71 | 14.46 | -50.32 | 0.3976 | -0.4783 | |||
| MCK / McKesson Corporation | 0.02 | 83.18 | 14.36 | 99.47 | 0.3949 | 0.1782 | |||
| AMD / Advanced Micro Devices, Inc. | 0.10 | 209.17 | 14.35 | 170.48 | 0.3944 | 0.2407 | |||
| MU / Micron Technology, Inc. | 0.12 | 118.90 | 14.27 | 210.53 | 0.3924 | 0.2541 | |||
| STT / State Street Corporation | 0.13 | -26.56 | 14.06 | -12.76 | 0.3865 | -0.0984 | |||
| UBER / Uber Technologies, Inc. | 0.15 | 44.09 | 14.00 | 78.87 | 0.3851 | 0.1650 | |||
| WPM / Wheaton Precious Metals Corp. | 0.15 | -28.98 | 13.80 | -17.70 | 0.3793 | -0.1251 | |||
| ADSK / Autodesk, Inc. | 0.04 | 19.46 | 13.68 | 41.26 | 0.3762 | 0.0847 | |||
| EL / The Estée Lauder Companies Inc. | 0.17 | 142.51 | 13.60 | 196.90 | 0.3739 | 0.2361 | |||
| COREWEAVE INC CL A (180 DAY LOCK-UP) / EC (N/A) | 0.08 | 13.57 | 0.3732 | 0.3732 | |||||
| SGI / Somnigroup International Inc. | 0.20 | 298.85 | 13.44 | 353.27 | 0.3694 | 0.2802 | |||
| LYV / Live Nation Entertainment, Inc. | 0.09 | 197.65 | 13.42 | 244.85 | 0.3689 | 0.2518 | |||
| RRC / Range Resources Corporation | 0.33 | 197.45 | 13.27 | 202.97 | 0.3649 | 0.2331 | |||
| XOM / Exxon Mobil Corporation | 0.12 | -19.55 | 12.86 | -27.09 | 0.3536 | -0.1772 | |||
| NRG / NRG Energy, Inc. | 0.08 | 342.70 | 12.65 | 644.73 | 0.3479 | 0.2968 | |||
| ADI / Analog Devices, Inc. | 0.05 | -17.86 | 12.59 | -3.05 | 0.3462 | -0.0446 | |||
| MMC / Marsh & McLennan Companies, Inc. | 0.06 | 10.96 | 12.40 | -0.59 | 0.3409 | -0.0344 | |||
| AMT / American Tower Corporation | 0.05 | 11.91 | 0.3275 | 0.3275 | |||||
| SHW / The Sherwin-Williams Company | 0.03 | 15.90 | 11.77 | 13.96 | 0.3235 | 0.0128 | |||
| EXC / Exelon Corporation | 0.27 | 204.46 | 11.57 | 186.88 | 0.3180 | 0.1967 | |||
| CSCO / Cisco Systems, Inc. | 0.16 | 11.20 | 0.3081 | 0.3081 | |||||
| EL / EssilorLuxottica Société anonyme | 0.04 | 3.04 | 11.17 | -1.50 | 0.3070 | -0.0341 | |||
| VST / Vistra Corp. | 0.06 | 49.60 | 10.93 | 146.89 | 0.3005 | 0.1673 | |||
| MLM / Martin Marietta Materials, Inc. | 0.02 | 95.10 | 10.92 | 124.04 | 0.3004 | 0.1536 | |||
| KKR / KKR & Co. Inc. | 0.08 | -38.32 | 10.82 | -29.02 | 0.2974 | -0.1612 | |||
| DG / Dollar General Corporation | 0.09 | 10.23 | 0.2812 | 0.2812 | |||||
| ICE / Intercontinental Exchange, Inc. | 0.06 | 3.75 | 10.16 | 10.35 | 0.2795 | 0.0023 | |||
| ETN / Eaton Corporation plc | 0.03 | 0.00 | 10.07 | 31.34 | 0.2768 | 0.0461 | |||
| BX / Blackstone Inc. | 0.07 | 122.30 | 9.84 | 137.90 | 0.2706 | 0.1461 | |||
| LSE N / London Stock Exchange Group plc | 0.07 | -19.95 | 9.74 | -21.18 | 0.2678 | -0.1041 | |||
| FHN / First Horizon Corporation | 0.44 | 4.07 | 9.33 | 13.61 | 0.2565 | 0.0094 | |||
| NEM / Newmont Corporation | 0.16 | 460.35 | 9.30 | 576.65 | 0.2558 | 0.2144 | |||
| AZO / AutoZone, Inc. | 0.00 | 9.09 | 0.2501 | 0.2501 | |||||
| AR / Antero Resources Corporation | 0.22 | 44.09 | 8.79 | 43.54 | 0.2418 | 0.0574 | |||
| US31635A3032 / Fidelity Securities Lending Cash Central Fund | 8.74 | -20.98 | 8.74 | -20.98 | 0.2404 | -0.0925 | |||
| PH / Parker-Hannifin Corporation | 0.01 | -11.97 | 8.73 | 1.15 | 0.2401 | -0.0197 | |||
| ZM / Zoom Communications Inc. | 0.11 | -28.31 | 8.71 | -24.21 | 0.2395 | -0.1064 | |||
| SBUX / Starbucks Corporation | 0.09 | -22.15 | 8.70 | -27.28 | 0.2391 | -0.1207 | |||
| GFL / GFL Environmental Inc. | 0.17 | 16.71 | 8.67 | 21.91 | 0.2384 | 0.0244 | |||
| GWW / W.W. Grainger, Inc. | 0.01 | 0.00 | 8.63 | 5.31 | 0.2374 | -0.0093 | |||
| TJX / The TJX Companies, Inc. | 0.07 | 0.00 | 8.61 | 1.39 | 0.2368 | -0.0188 | |||
| SYK / Stryker Corporation | 0.02 | -17.59 | 8.53 | -12.41 | 0.2344 | -0.0585 | |||
| KR / The Kroger Co. | 0.12 | 8.51 | 0.2339 | 0.2339 | |||||
| PAYC / Paycom Software, Inc. | 0.04 | 134.44 | 8.19 | 148.29 | 0.2252 | 0.1260 | |||
| NTR / Nutrien Ltd. | 0.14 | 8.17 | 0.2245 | 0.2245 | |||||
| TSLA / Tesla, Inc. | 0.03 | 114.29 | 8.10 | 162.65 | 0.2227 | 0.1299 | |||
| DOCS / Doximity, Inc. | 0.13 | -48.34 | 8.10 | -45.39 | 0.2226 | -0.2236 | |||
| NTRS / Northern Trust Corporation | 0.06 | 0.00 | 7.91 | 28.53 | 0.2175 | 0.0323 | |||
| DOV / Dover Corporation | 0.04 | -8.72 | 7.86 | -4.80 | 0.2161 | -0.0323 | |||
| SHEL N / Shell plc | 0.22 | 69.88 | 7.81 | 62.83 | 0.2148 | 0.0704 | |||
| LEGN / Legend Biotech Corporation - Depositary Receipt (Common Stock) | 0.22 | 369.49 | 7.76 | 242.03 | 0.2135 | 0.1497 | |||
| TDG / TransDigm Group Incorporated | 0.01 | 0.00 | 7.76 | 9.94 | 0.2132 | 0.0009 | |||
| RBLX / Roblox Corporation | 0.07 | 135.29 | 7.57 | 324.79 | 0.2083 | 0.1546 | |||
| NKE / NIKE, Inc. | 0.10 | 287.73 | 7.41 | 193.08 | 0.2037 | 0.1276 | |||
| CME / CME Group Inc. | 0.03 | -68.52 | 7.19 | -59.70 | 0.1978 | -0.3397 | |||
| NSC / Norfolk Southern Corporation | 0.03 | -32.69 | 7.17 | -27.25 | 0.1971 | -0.0994 | |||
| UNH / UnitedHealth Group Incorporated | 0.02 | -69.95 | 7.12 | -82.10 | 0.1956 | -1.0008 | |||
| PLTR / Palantir Technologies Inc. | 0.05 | 7.08 | 0.1945 | 0.1945 | |||||
| ABNB / Airbnb, Inc. | 0.05 | -36.10 | 6.93 | -29.21 | 0.1907 | -0.1041 | |||
| OKTA / Okta, Inc. | 0.07 | 6.86 | 0.1886 | 0.1886 | |||||
| EME / EMCOR Group, Inc. | 0.01 | 374.07 | 6.85 | 585.97 | 0.1882 | 0.1582 | |||
| MOLOCO INC SERIES A PC PP / EP (N/A) | 0.10 | 6.70 | 0.1843 | 0.1843 | |||||
| TCOM / Trip.com Group Limited - Depositary Receipt (Common Stock) | 0.11 | 0.00 | 6.67 | -7.77 | 0.1833 | -0.0342 | |||
| FCX / Freeport-McMoRan Inc. | 0.15 | -7.86 | 6.66 | 5.50 | 0.1831 | -0.0068 | |||
| SNOW / Snowflake Inc. | 0.03 | -18.86 | 6.36 | 18.87 | 0.1747 | -0.0275 | |||
| GKOS / Glaukos Corporation | 0.06 | 0.00 | 6.34 | 4.97 | 0.1744 | -0.0075 | |||
| GE / General Electric Company | 0.02 | 9.91 | 6.28 | 41.35 | 0.1727 | 0.0390 | |||
| CANVA INC CL A / EC (N/A) | 0.00 | 6.25 | 0.1719 | 0.1719 | |||||
| VEEV / Veeva Systems Inc. | 0.02 | -15.35 | 6.19 | 5.24 | 0.1702 | -0.0068 | |||
| LIN / Linde plc | 0.01 | 0.00 | 6.19 | 0.77 | 0.1702 | -0.0147 | |||
| SCI / Service Corporation International | 0.07 | -44.07 | 5.99 | -43.23 | 0.1647 | -0.1529 | |||
| TMUS / T-Mobile US, Inc. | 0.03 | 135.85 | 5.96 | 110.68 | 0.1638 | 0.0787 | |||
| DY / Dycom Industries, Inc. | 0.02 | 5.91 | 0.1626 | 0.1626 | |||||
| NNND / Tencent Holdings Limited | 0.09 | 5.85 | 0.1609 | 0.1609 | |||||
| ROP / Roper Technologies, Inc. | 0.01 | 10.75 | 5.84 | 6.47 | 0.1605 | -0.0045 | |||
| SHOP / Shopify Inc. | 0.05 | 0.00 | 5.50 | 20.82 | 0.1513 | 0.0142 | |||
| FLEX / Flex Ltd. | 0.11 | 184.64 | 5.46 | 329.61 | 0.1500 | 0.1118 | |||
| HLT / Hilton Worldwide Holdings Inc. | 0.02 | 0.00 | 5.46 | 17.03 | 0.1500 | 0.0097 | |||
| INTC / Intel Corporation | 0.24 | 250.72 | 5.45 | 245.94 | 0.1499 | 0.1025 | |||
| COIN / Coinbase Global, Inc. | 0.02 | -58.71 | 5.40 | -41.72 | 0.1484 | -0.1080 | |||
| MCO / Moody's Corporation | 0.01 | 0.00 | 5.17 | 7.71 | 0.1421 | -0.0023 | |||
| 6B6 / monday.com Ltd. | 0.02 | 1,383.09 | 5.13 | 1,993.88 | 0.1411 | 0.1328 | |||
| SMURFIT WESTROCK PLC / EC (IE00028FXN24) | 0.12 | -30.79 | 5.04 | -33.72 | 0.1387 | -0.0903 | |||
| ZS / Zscaler, Inc. | 0.02 | 4.83 | 0.1329 | 0.1329 | |||||
| LPX / Louisiana-Pacific Corporation | 0.06 | 24.06 | 4.83 | 15.99 | 0.1329 | 0.0075 | |||
| JBL / Jabil Inc. | 0.02 | 4.67 | 0.1283 | 0.1283 | |||||
| TOL / Toll Brothers, Inc. | 0.04 | -60.60 | 4.65 | -57.41 | 0.1277 | -0.2005 | |||
| FNV / Franco-Nevada Corporation | 0.03 | 4.38 | 0.1205 | 0.1205 | |||||
| DIS / The Walt Disney Company | 0.04 | 18.46 | 4.38 | 48.83 | 0.1204 | 0.0319 | |||
| EXAS / Exact Sciences Corporation | 0.08 | 6.82 | 4.17 | 31.15 | 0.1147 | 0.0190 | |||
| BKNG / Booking Holdings Inc. | 0.00 | 4.05 | 0.1114 | 0.1114 | |||||
| CTAS / Cintas Corporation | 0.02 | 0.00 | 4.02 | 8.44 | 0.1105 | -0.0010 | |||
| USB / U.S. Bancorp | 0.09 | 0.00 | 3.91 | 7.17 | 0.1076 | -0.0023 | |||
| BABA / Alibaba Group Holding Limited - Depositary Receipt (Common Stock) | 0.03 | -77.06 | 3.89 | -80.33 | 0.1070 | -0.4879 | |||
| BYTEDANCE LTD SER E-1 PC PP / EP (N/A) | 0.02 | 3.78 | 0.1039 | 0.1039 | |||||
| ALSN / Allison Transmission Holdings, Inc. | 0.04 | 0.00 | 3.66 | -0.71 | 0.1006 | -0.0103 | |||
| FICO / Fair Isaac Corporation | 0.00 | -64.86 | 3.56 | -65.18 | 0.0980 | -0.2100 | |||
| PANW / Palo Alto Networks, Inc. | 0.02 | 0.00 | 3.48 | 19.93 | 0.0957 | 0.0084 | |||
| DLTR / Dollar Tree, Inc. | 0.04 | 70.73 | 3.47 | 27.01 | 0.0953 | 0.0131 | |||
| BRK.B / Berkshire Hathaway Inc. | 0.01 | -75.66 | 3.42 | -77.80 | 0.0941 | -0.3698 | |||
| LNG / Cheniere Energy, Inc. | 0.01 | 25.23 | 3.38 | 31.78 | 0.0931 | 0.0158 | |||
| DPZ / Domino's Pizza, Inc. | 0.01 | 3.33 | 0.0917 | 0.0917 | |||||
| ISP / Intesa Sanpaolo S.p.A. | 0.57 | -39.34 | 3.29 | -32.21 | 0.0903 | -0.0555 | |||
| CPG / Compass Group PLC | 0.10 | 0.00 | 3.23 | 2.41 | 0.0889 | -0.0061 | |||
| RDDT / Reddit, Inc. | 0.02 | -54.80 | 3.19 | -35.11 | 0.0878 | -0.0603 | |||
| AS / Amer Sports, Inc. | 0.08 | -79.09 | 3.13 | -69.68 | 0.0861 | -0.2247 | |||
| STARLING GROUP HOLDINGS LIMITED / EC (N/A) | 0.88 | 2.92 | 0.0803 | 0.0803 | |||||
| MTB / M&T Bank Corporation | 0.01 | -74.75 | 2.91 | -72.60 | 0.0800 | -0.2395 | |||
| STZ / Constellation Brands, Inc. | 0.02 | 25.00 | 2.85 | 10.78 | 0.0783 | 0.0010 | |||
| SRE / Sempra | 0.04 | 0.00 | 2.81 | 6.20 | 0.0773 | -0.0024 | |||
| WWD / Woodward, Inc. | 0.01 | -25.17 | 2.77 | 0.51 | 0.0761 | -0.0068 | |||
| WH / Wyndham Hotels & Resorts, Inc. | 0.03 | 2.75 | 0.0757 | 0.0757 | |||||
| CMI / Cummins Inc. | 0.01 | 0.00 | 2.75 | 4.52 | 0.0756 | -0.0036 | |||
| PEGA / Pegasystems Inc. | 0.05 | 2.71 | 0.0744 | 0.0744 | |||||
| CAVA / CAVA Group, Inc. | 0.03 | -70.65 | 2.69 | -71.40 | 0.0739 | -0.2088 | |||
| VMC / Vulcan Materials Company | 0.01 | 0.00 | 2.61 | 11.79 | 0.0717 | 0.0015 | |||
| HD / The Home Depot, Inc. | 0.01 | -86.03 | 2.57 | -86.02 | 0.0706 | -0.4820 | |||
| NUVL / Nuvalent, Inc. | 0.03 | 0.00 | 2.43 | 7.58 | 0.0667 | -0.0012 | |||
| BAC / Bank of America Corporation | 0.05 | -86.27 | 2.37 | -77.36 | 0.0651 | -0.3175 | |||
| DG / Vinci SA | 0.02 | 2.36 | 0.0649 | 0.0649 | |||||
| SN / SharkNinja, Inc. | 0.02 | 2.36 | 0.0648 | 0.0648 | |||||
| X.AI HOLDINGS CORP CLASS A P/P / EC (N/A) | 0.06 | 2.32 | 0.0638 | 0.0638 | |||||
| ISRG / Intuitive Surgical, Inc. | 0.00 | -65.29 | 2.28 | -61.92 | 0.0628 | -0.1176 | |||
| ACI / Albertsons Companies, Inc. | 0.10 | 2.19 | 0.0601 | 0.0601 | |||||
| PFGC / Performance Food Group Company | 0.02 | 0.00 | 2.13 | 11.26 | 0.0584 | 0.0009 | |||
| AIT / Applied Industrial Technologies, Inc. | 0.01 | -33.86 | 1.95 | -31.77 | 0.0537 | -0.0324 | |||
| CPT / Camden Property Trust | 0.02 | 0.00 | 1.95 | -7.85 | 0.0536 | -0.0101 | |||
| AEE / Ameren Corporation | 0.02 | 1.92 | 0.0528 | 0.0528 | |||||
| SOBO / South Bow Corporation | 0.07 | 0.00 | 1.88 | 1.62 | 0.0517 | -0.0040 | |||
| SARO / StandardAero, Inc. | 0.05 | 207.87 | 1.73 | 265.82 | 0.0477 | 0.0334 | |||
| ES / Eversource Energy | 0.03 | 1.71 | 0.0471 | 0.0471 | |||||
| FERG / Ferguson Enterprises Inc. | 0.01 | 1.68 | 0.0461 | 0.0461 | |||||
| AG1 / AUTO1 Group SE | 0.05 | 1.59 | 0.0437 | 0.0437 | |||||
| MSCI / MSCI Inc. | 0.00 | 0.00 | 1.56 | 2.03 | 0.0428 | -0.0031 | |||
| NOW / ServiceNow, Inc. | 0.00 | 0.00 | 1.54 | 29.15 | 0.0424 | 0.0065 | |||
| RL / Ralph Lauren Corporation | 0.01 | -75.55 | 1.54 | -69.63 | 0.0422 | -0.1099 | |||
| AFRM / Affirm Holdings, Inc. | 0.02 | 1.49 | 0.0409 | 0.0409 | |||||
| LPLA / LPL Financial Holdings Inc. | 0.00 | 1.35 | 0.0371 | 0.0371 | |||||
| ATZ / Aritzia Inc. | 0.03 | 0.00 | 1.30 | 47.49 | 0.0356 | 0.0092 | |||
| RCL / Royal Caribbean Cruises Ltd. | 0.00 | 1.25 | 0.0344 | 0.0344 | |||||
| REL N / RELX PLC | 0.02 | 0.00 | 1.24 | 7.91 | 0.0341 | -0.0005 | |||
| ANDURIL INDUSTRIES INC SER G PC PP / EP (N/A) | 0.03 | 1.23 | 0.0337 | 0.0337 | |||||
| SATS / EchoStar Corporation | 0.04 | 1.22 | 0.0336 | 0.0336 | |||||
| GPI / Group 1 Automotive, Inc. | 0.00 | -73.83 | 1.22 | -70.09 | 0.0336 | -0.0894 | |||
| CHRW / C.H. Robinson Worldwide, Inc. | 0.01 | 0.00 | 1.14 | -6.32 | 0.0314 | -0.0053 | |||
| YANKA (MASTERCLASS) INDUSTRIES INC SER F PC PP / EP (N/A) | 0.27 | 1.14 | 0.0313 | 0.0313 | |||||
| APPLIED INTUITION INC SER A-2 PC PP / EP (N/A) | 0.01 | 1.11 | 0.0306 | 0.0306 | |||||
| EVRG / Evergy, Inc. | 0.02 | 1.10 | 0.0303 | 0.0303 | |||||
| ECL / Ecolab Inc. | 0.00 | 1.08 | 0.0296 | 0.0296 | |||||
| DEST TB2 HLDG LLC PP / EC (N/A) | 0.03 | 1.06 | 0.0292 | 0.0292 | |||||
| NXPI / NXP Semiconductors N.V. | 0.00 | 0.00 | 0.96 | 14.95 | 0.0264 | 0.0013 | |||
| COREWEAVE INC CL A PUT RIGHT SHARES (180 DAY LOCK-UP) / EC (N/A) | 0.01 | 0.88 | 0.0242 | 0.0242 | |||||
| PEN / Penumbra, Inc. | 0.00 | 385.71 | 0.87 | 415.98 | 0.0240 | 0.0176 | |||
| APPLIED INTUITION INC CL A PP / EC (N/A) | 0.01 | 0.85 | 0.0235 | 0.0235 | |||||
| EIX / Edison International | 0.02 | 0.00 | 0.80 | -12.49 | 0.0220 | -0.0055 | |||
| GS / The Goldman Sachs Group, Inc. | 0.00 | -97.90 | 0.78 | -97.28 | 0.0214 | -0.8384 | |||
| ACVA / ACV Auctions Inc. | 0.05 | 0.00 | 0.75 | 15.03 | 0.0206 | 0.0010 | |||
| BRKR / Bruker Corporation | 0.02 | -85.91 | 0.73 | -86.09 | 0.0201 | -0.1377 | |||
| WSM / Williams-Sonoma, Inc. | 0.00 | 0.72 | 0.0198 | 0.0198 | |||||
| SRRK / Scholar Rock Holding Corporation | 0.02 | 0.00 | 0.68 | 10.21 | 0.0187 | 0.0001 | |||
| IP / International Paper Company | 0.01 | -97.25 | 0.66 | -97.59 | 0.0180 | -0.8004 | |||
| ORLA / Orla Mining Ltd. | 0.06 | 0.60 | 0.0166 | 0.0166 | |||||
| BWXT / BWX Technologies, Inc. | 0.00 | 0.00 | 0.58 | 46.19 | 0.0158 | 0.0040 | |||
| APPLIED INTUITION INC SER B-2 PC PP / EP (N/A) | 0.00 | 0.54 | 0.0148 | 0.0148 | |||||
| REDDIT INC CLASS B / EC (N/A) | 0.00 | 0.53 | 0.0145 | 0.0145 | |||||
| PNR / Pentair plc | 0.01 | -93.50 | 0.51 | -92.37 | 0.0141 | -0.1883 | |||
| DEI / Douglas Emmett, Inc. | 0.03 | 0.00 | 0.45 | -6.04 | 0.0124 | -0.0020 | |||
| YANKA (MASTERCLASS) INDUSTRIES INC SER E 0% PC PP / EP (N/A) | 0.17 | 0.44 | 0.0122 | 0.0122 | |||||
| MAR / Marriott International, Inc. | 0.00 | -94.66 | 0.41 | -93.89 | 0.0113 | -0.1902 | |||
| BPMC / Blueprint Medicines Corporation | 0.00 | 0.00 | 0.38 | 44.91 | 0.0106 | 0.0026 | |||
| KRMN / Karman Holdings Inc. | 0.01 | 0.00 | 0.38 | 50.99 | 0.0105 | 0.0029 | |||
| RVLV / Revolve Group, Inc. | 0.02 | 0.00 | 0.34 | -6.81 | 0.0094 | -0.0016 | |||
| EVOZYNE INC SER A PC PP / EP (N/A) | 0.02 | 0.29 | 0.0079 | 0.0079 | |||||
| IGQ5 / 3i Group plc | 0.01 | 0.00 | 0.28 | 20.00 | 0.0078 | 0.0007 | |||
| BRBR / BellRing Brands, Inc. | 0.00 | 0.24 | 0.0067 | 0.0067 | |||||
| MGNI / Magnite, Inc. | 0.01 | 0.00 | 0.24 | 111.40 | 0.0066 | 0.0032 | |||
| MDGL / Madrigal Pharmaceuticals, Inc. | 0.00 | -82.93 | 0.21 | -84.46 | 0.0058 | -0.0350 | |||
| LRCX / Lam Research Corporation | 0.00 | -99.08 | 0.07 | -98.77 | 0.0019 | -0.1651 | |||
| FLOC / Flowco Holdings Inc. | 0.00 | -100.00 | 0.00 | -100.00 | -0.0377 |