Mga Batayang Estadistika
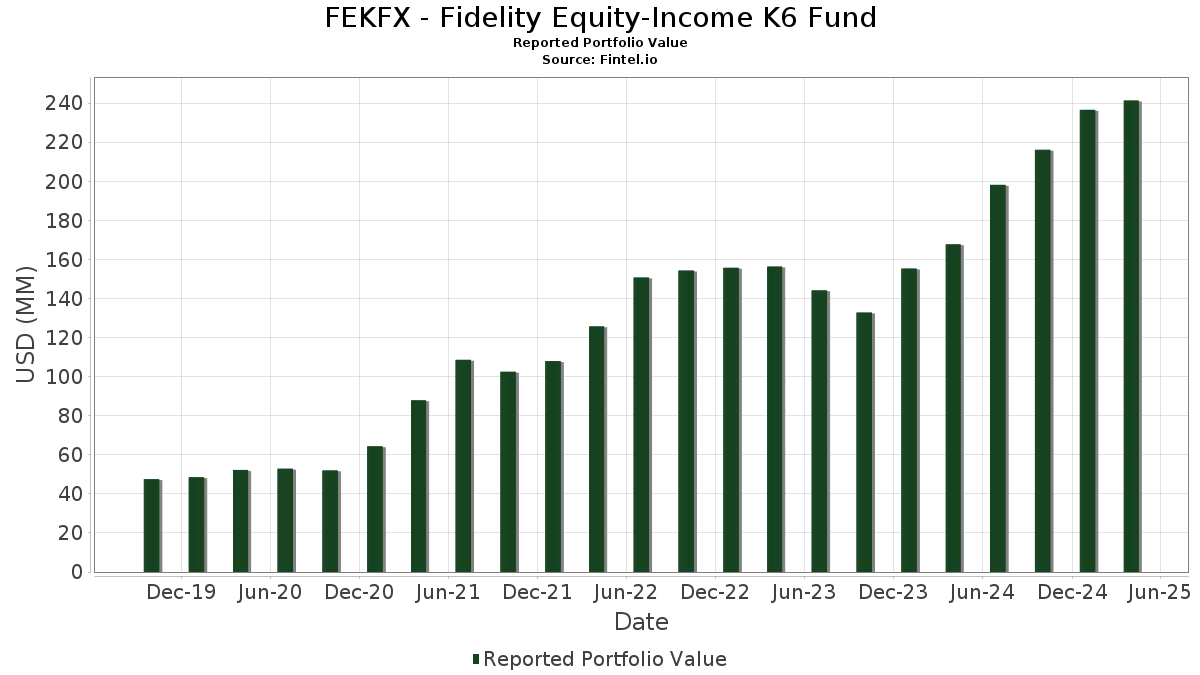
| Nilai Portofolio | $ 241,315,897 |
| Posisi Saat Ini | 124 |
Kepemilikan Terbaru, Kinerja, AUM (dari 13F, 13D)
FEKFX - Fidelity Equity-Income K6 Fund telah mengungkapkan total kepemilikan 124 dalam pengajuan SEC terbaru mereka. Nilai portofolio terbaru dihitung sebesar $ 241,315,897 USD. Aset yang Dikelola (AUM) sebenarnya adalah nilai ini ditambah kas (yang tidak diungkapkan). Aset-aset utama FEKFX - Fidelity Equity-Income K6 Fund adalah JPMorgan Chase & Co. (US:JPM) , Exxon Mobil Corporation (US:XOM) , Walmart Inc. (US:WMT) , Linde plc (US:LIN) , and AbbVie Inc. (US:ABBV) . Posisi baru FEKFX - Fidelity Equity-Income K6 Fund meliputi: The Charles Schwab Corporation (US:SCHW) , .
Peningkatan Tertinggi Kuartal Ini
Kami menggunakan perubahan dalam alokasi portofolio karena ini adalah metrik yang paling bermakna. Perubahan dapat disebabkan oleh perdagangan atau perubahan harga saham.
| Keamanan | Saham (MM) |
Nilai (Juta Dolar AS) |
Portfolio % | ΔPorsyento ng Portfolio |
|---|---|---|---|---|
| 0.03 | 2.37 | 0.9809 | 0.9809 | |
| 0.03 | 5.68 | 2.3511 | 0.2514 | |
| 0.01 | 3.68 | 1.5241 | 0.2187 | |
| 0.04 | 3.81 | 1.5798 | 0.2005 | |
| 0.03 | 3.57 | 1.4791 | 0.1952 | |
| 0.12 | 1.25 | 0.5190 | 0.1784 | |
| 0.01 | 5.73 | 2.3720 | 0.1601 | |
| 0.04 | 2.68 | 1.1103 | 0.1568 | |
| 0.01 | 4.12 | 1.7065 | 0.1539 | |
| 0.08 | 2.22 | 0.9207 | 0.1537 |
Penurunan Tertinggi Kuartal Ini
Kami menggunakan perubahan dalam alokasi portofolio karena ini adalah metrik yang paling bermakna. Perubahan dapat disebabkan oleh perdagangan atau perubahan harga saham.
| Keamanan | Saham (MM) |
Nilai (Juta Dolar AS) |
Portfolio % | ΔPorsyento ng Portfolio |
|---|---|---|---|---|
| 2.12 | 2.12 | 0.8787 | -2.0518 | |
| 0.10 | 0.10 | 0.0407 | -0.8473 | |
| 0.01 | 4.44 | 1.8395 | -0.4477 | |
| 0.03 | 0.91 | 0.3751 | -0.2975 | |
| 0.02 | 3.38 | 1.4017 | -0.2843 | |
| 0.02 | 3.36 | 1.3915 | -0.2703 | |
| 0.01 | 2.12 | 0.8771 | -0.2184 | |
| 0.01 | 1.67 | 0.6913 | -0.2124 | |
| 0.11 | 4.22 | 1.7484 | -0.2077 | |
| 0.02 | 2.25 | 0.9303 | -0.1968 |
Pengajuan 13F dan Dana
Formulir ini diajukan pada 2025-06-26 untuk periode pelaporan 2025-04-30. Klik ikon tautan untuk melihat riwayat transaksi selengkapnya.
Tingkatkan ke versi premium untuk membuka data premium dan ekspor ke Excel. ![]() .
.
| Keamanan | Ketik | Harga Saham Rata-rata | Saham (MM) |
ΔSaham (%) |
ΔSaham (%) |
Nilai ($MM) |
Portpolyo (%) |
ΔPortofolio (%) |
|
|---|---|---|---|---|---|---|---|---|---|
| JPM / JPMorgan Chase & Co. | 0.04 | 8.64 | 9.22 | -0.57 | 3.8197 | -0.1326 | |||
| XOM / Exxon Mobil Corporation | 0.07 | 7.34 | 6.95 | 6.14 | 2.8779 | 0.0884 | |||
| WMT / Walmart Inc. | 0.06 | 9.01 | 6.00 | 8.01 | 2.4853 | 0.1178 | |||
| LIN / Linde plc | 0.01 | 8.59 | 5.73 | 10.33 | 2.3720 | 0.1601 | |||
| ABBV / AbbVie Inc. | 0.03 | 8.58 | 5.68 | 15.20 | 2.3511 | 0.2514 | |||
| GE / General Electric Company | 0.02 | 9.75 | 4.99 | 8.64 | 2.0668 | 0.1099 | |||
| PG / The Procter & Gamble Company | 0.03 | 9.69 | 4.60 | 7.42 | 1.9061 | 0.0807 | |||
| WFC / Wells Fargo & Company | 0.06 | 6.77 | 4.48 | -3.80 | 1.8560 | -0.1286 | |||
| UNH / UnitedHealth Group Incorporated | 0.01 | 9.09 | 4.44 | -17.27 | 1.8395 | -0.4477 | |||
| BAC / Bank of America Corporation | 0.11 | 6.76 | 4.22 | -8.06 | 1.7484 | -0.2077 | |||
| CB / Chubb Limited | 0.01 | 7.46 | 4.12 | 13.06 | 1.7065 | 0.1539 | |||
| GILD / Gilead Sciences, Inc. | 0.04 | 7.51 | 3.81 | 17.83 | 1.5798 | 0.2005 | |||
| JNJ / Johnson & Johnson | 0.02 | 7.07 | 3.79 | 9.99 | 1.5680 | 0.1015 | |||
| MCD / McDonald's Corporation | 0.01 | 8.48 | 3.68 | 20.10 | 1.5241 | 0.2187 | |||
| DHR / Danaher Corporation | 0.02 | 7.17 | 3.57 | -4.08 | 1.4798 | -0.1075 | |||
| HIG / The Hartford Insurance Group, Inc. | 0.03 | 7.77 | 3.57 | 18.52 | 1.4791 | 0.1952 | |||
| TSM / Taiwan Semiconductor Manufacturing Company Limited - Depositary Receipt (Common Stock) | 0.02 | 7.41 | 3.38 | -14.48 | 1.4017 | -0.2843 | |||
| PNC / The PNC Financial Services Group, Inc. | 0.02 | 7.73 | 3.36 | -13.85 | 1.3915 | -0.2703 | |||
| MSFT / Microsoft Corporation | 0.01 | 9.24 | 3.27 | 4.04 | 1.3551 | 0.0149 | |||
| TJX / The TJX Companies, Inc. | 0.02 | 8.76 | 3.20 | 12.14 | 1.3237 | 0.1094 | |||
| TMUS / T-Mobile US, Inc. | 0.01 | 5.03 | 3.09 | 11.31 | 1.2804 | 0.0973 | |||
| TRV / The Travelers Companies, Inc. | 0.01 | 4.79 | 2.89 | 12.91 | 1.1958 | 0.1061 | |||
| ITT / ITT Inc. | 0.02 | 4.67 | 2.77 | -5.05 | 1.1454 | -0.0955 | |||
| KO / The Coca-Cola Company | 0.04 | 4.82 | 2.68 | 19.85 | 1.1103 | 0.1568 | |||
| GEV / GE Vernova Inc. | 0.01 | 5.89 | 2.67 | 5.29 | 1.1043 | 0.0255 | |||
| CSCO / Cisco Systems, Inc. | 0.05 | 4.37 | 2.62 | -0.57 | 1.0851 | -0.0377 | |||
| NEE / NextEra Energy, Inc. | 0.04 | 4.85 | 2.60 | -2.00 | 1.0776 | -0.0537 | |||
| MMC / Marsh & McLennan Companies, Inc. | 0.01 | 5.52 | 2.59 | 9.67 | 1.0712 | 0.0666 | |||
| AZN / Astrazeneca plc | 0.02 | 5.29 | 2.56 | 7.46 | 1.0619 | 0.0453 | |||
| LOW / Lowe's Companies, Inc. | 0.01 | 10.87 | 2.51 | -4.71 | 1.0389 | -0.0824 | |||
| SCHW / The Charles Schwab Corporation | 0.03 | 2.37 | 0.9809 | 0.9809 | |||||
| SO / The Southern Company | 0.03 | 5.88 | 2.32 | 15.91 | 0.9598 | 0.1078 | |||
| MTB / M&T Bank Corporation | 0.01 | 5.43 | 2.31 | -11.07 | 0.9552 | -0.1497 | |||
| KDP / Keurig Dr Pepper Inc. | 0.07 | 6.12 | 2.28 | 14.34 | 0.9443 | 0.0947 | |||
| CMCSA / Comcast Corporation | 0.07 | 5.96 | 2.25 | 7.66 | 0.9312 | 0.0414 | |||
| DIS / The Walt Disney Company | 0.02 | 5.56 | 2.25 | -15.09 | 0.9303 | -0.1968 | |||
| LAMR / Lamar Advertising Company | 0.02 | 5.93 | 2.24 | -4.65 | 0.9266 | -0.0730 | |||
| T / AT&T Inc. | 0.08 | 5.80 | 2.22 | 23.50 | 0.9207 | 0.1537 | |||
| VZ / Verizon Communications Inc. | 0.05 | 5.88 | 2.22 | 18.41 | 0.9193 | 0.1208 | |||
| NXPI / NXP Semiconductors N.V. | 0.01 | 5.36 | 2.17 | -6.90 | 0.9006 | -0.0945 | |||
| CR / Crane Company | 0.01 | 6.40 | 2.14 | 0.56 | 0.8869 | -0.0204 | |||
| US31635A1051 / Fidelity Cash Central Fund | 2.12 | -69.15 | 2.12 | -69.16 | 0.8787 | -2.0518 | |||
| ACN / Accenture plc | 0.01 | 5.99 | 2.12 | -17.66 | 0.8771 | -0.2184 | |||
| CCK / Crown Holdings, Inc. | 0.02 | 6.89 | 2.09 | 17.20 | 0.8665 | 0.1058 | |||
| LLY / Eli Lilly and Company | 0.00 | 9.66 | 2.04 | 21.56 | 0.8454 | 0.1298 | |||
| MRK / Merck & Co., Inc. | 0.02 | 6.21 | 2.04 | -8.39 | 0.8452 | -0.1044 | |||
| NSC / Norfolk Southern Corporation | 0.01 | 5.81 | 2.04 | -7.15 | 0.8443 | -0.0911 | |||
| COF / Capital One Financial Corporation | 0.01 | 13.65 | 1.95 | 0.57 | 0.8080 | -0.0186 | |||
| AME / AMETEK, Inc. | 0.01 | 15.12 | 1.94 | 5.73 | 0.8021 | 0.0220 | |||
| BLK / BlackRock, Inc. | 0.00 | 10.53 | 1.92 | -6.07 | 0.7951 | -0.0755 | |||
| SAN / Santander UK plc - Preferred Stock | 0.02 | 7.54 | 1.87 | 8.27 | 0.7756 | 0.0384 | |||
| HBAN / Huntington Bancshares Incorporated | 0.13 | 6.81 | 1.87 | -9.76 | 0.7734 | -0.1084 | |||
| BJ / BJ's Wholesale Club Holdings, Inc. | 0.02 | 8.25 | 1.85 | 28.54 | 0.7666 | 0.1528 | |||
| JCI / Johnson Controls International plc | 0.02 | 7.34 | 1.84 | 15.51 | 0.7620 | 0.0830 | |||
| V / Visa Inc. | 0.01 | 8.24 | 1.81 | 9.41 | 0.7514 | 0.0449 | |||
| IMO / Imperial Oil Limited | 0.03 | 7.40 | 1.76 | 8.97 | 0.7293 | 0.0404 | |||
| SHEL / Shell plc | 0.05 | 8.44 | 1.76 | 6.60 | 0.7289 | 0.0253 | |||
| NOC / Northrop Grumman Corporation | 0.00 | 0.00 | 1.69 | -0.12 | 0.7003 | -0.0213 | |||
| GD / General Dynamics Corporation | 0.01 | 0.00 | 1.69 | 5.90 | 0.6987 | 0.0199 | |||
| CEG / Constellation Energy Corporation | 0.01 | 5.66 | 1.67 | -21.31 | 0.6913 | -0.2124 | |||
| USB / U.S. Bancorp | 0.04 | 6.91 | 1.62 | -9.74 | 0.6716 | -0.0938 | |||
| DOX / Amdocs Limited | 0.02 | 8.93 | 1.62 | 9.45 | 0.6714 | 0.0401 | |||
| CI / The Cigna Group | 0.00 | 9.46 | 1.57 | 26.53 | 0.6520 | 0.1218 | |||
| GOOGL / Alphabet Inc. | 0.01 | 6.46 | 1.57 | -17.11 | 0.6503 | -0.1571 | |||
| WSO / Watsco, Inc. | 0.00 | 9.90 | 1.53 | 5.59 | 0.6341 | 0.0163 | |||
| SSNLF / Samsung Electronics Co., Ltd. | 0.04 | 0.00 | 1.53 | 9.36 | 0.6338 | 0.0376 | |||
| AMT / American Tower Corporation | 0.01 | 10.03 | 1.48 | 34.09 | 0.6145 | 0.1431 | |||
| EPD / Enterprise Products Partners L.P. - Limited Partnership | 0.05 | 8.36 | 1.43 | -0.76 | 0.5939 | -0.0218 | |||
| APO / Apollo Global Management, Inc. | 0.01 | 8.33 | 1.42 | -13.53 | 0.5878 | -0.1115 | |||
| PSA / Public Storage | 0.00 | 12.07 | 1.39 | 12.78 | 0.5774 | 0.0508 | |||
| RHHBY / Roche Holding AG - Depositary Receipt (Common Stock) | 0.00 | 10.17 | 1.38 | 14.61 | 0.5722 | 0.0585 | |||
| VST / Vistra Corp. | 0.01 | 10.38 | 1.38 | -14.83 | 0.5709 | -0.1188 | |||
| ADI / Analog Devices, Inc. | 0.01 | 9.34 | 1.37 | 0.59 | 0.5668 | -0.0129 | |||
| HES / Hess Corporation | 0.01 | 9.27 | 1.37 | 1.41 | 0.5668 | -0.0081 | |||
| HII / Huntington Ingalls Industries, Inc. | 0.01 | 13.63 | 1.34 | 32.68 | 0.5567 | 0.1251 | |||
| BLL / Ball Corp. | 0.03 | 10.81 | 1.33 | 3.34 | 0.5513 | 0.0024 | |||
| CNQ / Canadian Natural Resources Limited | 0.04 | 9.52 | 1.29 | 3.46 | 0.5332 | 0.0030 | |||
| MDLZ / Mondelez International, Inc. | 0.02 | 12.55 | 1.28 | 32.27 | 0.5314 | 0.1180 | |||
| AFG / American Financial Group, Inc. | 0.01 | 9.82 | 1.28 | 1.92 | 0.5281 | -0.0053 | |||
| RYCEY / Rolls-Royce Holdings plc - Depositary Receipt (Common Stock) | 0.12 | 15.49 | 1.25 | 56.82 | 0.5190 | 0.1784 | |||
| BURL / Burlington Stores, Inc. | 0.01 | 10.10 | 1.23 | -12.74 | 0.5079 | -0.0909 | |||
| TPR / Tapestry, Inc. | 0.02 | 10.86 | 1.23 | 7.36 | 0.5076 | 0.0213 | |||
| DKS / DICK'S Sporting Goods, Inc. | 0.01 | 10.35 | 1.20 | -13.72 | 0.4975 | -0.0956 | |||
| HRB / H&R Block, Inc. | 0.02 | 12.85 | 1.17 | 23.13 | 0.4831 | 0.0796 | |||
| TGT / Target Corporation | 0.01 | 8.37 | 1.13 | -24.02 | 0.4666 | -0.1651 | |||
| AAPL / Apple Inc. | 0.01 | 12.83 | 1.12 | 1.54 | 0.4642 | -0.0058 | |||
| KVUE / Kenvue Inc. | 0.05 | 13.49 | 1.09 | 25.81 | 0.4522 | 0.0824 | |||
| WEC / WEC Energy Group, Inc. | 0.01 | 15.24 | 1.08 | 27.19 | 0.4458 | 0.0851 | |||
| QBCRF / Quebecor Inc. | 0.04 | 17.01 | 1.08 | 44.68 | 0.4453 | 0.1285 | |||
| CNP / CenterPoint Energy, Inc. | 0.03 | 15.88 | 1.05 | 38.13 | 0.4336 | 0.1103 | |||
| UL / Unilever PLC - Depositary Receipt (Common Stock) | 0.02 | 15.44 | 1.00 | 28.24 | 0.4140 | 0.0821 | |||
| MTRAF / Metro Inc. | 0.01 | 14.38 | 0.98 | 41.15 | 0.4063 | 0.1100 | |||
| AEE / Ameren Corporation | 0.01 | 15.28 | 0.97 | 21.47 | 0.4031 | 0.0616 | |||
| HIA1 / Hitachi, Ltd. | 0.04 | 0.00 | 0.97 | -1.63 | 0.4001 | -0.0186 | |||
| ATD / Alimentation Couche-Tard Inc. | 0.02 | 14.24 | 0.96 | 12.90 | 0.3989 | 0.0355 | |||
| EXC / Exelon Corporation | 0.02 | 0.00 | 0.96 | 17.24 | 0.3974 | 0.0487 | |||
| FCX / Freeport-McMoRan Inc. | 0.03 | -42.91 | 0.91 | -42.65 | 0.3751 | -0.2975 | |||
| SIE / Siemens Aktiengesellschaft | 0.00 | 14.58 | 0.90 | 22.99 | 0.3747 | 0.0615 | |||
| SJM / The J. M. Smucker Company | 0.01 | 16.92 | 0.88 | 27.23 | 0.3659 | 0.0699 | |||
| GS71 / GSK plc | 0.04 | 18.68 | 0.85 | 34.70 | 0.3539 | 0.0838 | |||
| PCG / PG&E Corporation | 0.05 | 12.78 | 0.85 | 19.01 | 0.3502 | 0.0476 | |||
| QSR / Restaurant Brands International Inc. | 0.01 | 17.14 | 0.79 | 22.79 | 0.3282 | 0.0532 | |||
| FE / FirstEnergy Corp. | 0.02 | 20.23 | 0.79 | 29.56 | 0.3271 | 0.0673 | |||
| VK / Vallourec S.A. | 0.04 | 47.18 | 0.77 | 42.70 | 0.3197 | 0.0889 | |||
| KBR / KBR, Inc. | 0.01 | 0.00 | 0.76 | -2.92 | 0.3164 | -0.0190 | |||
| PSX / Phillips 66 | 0.01 | 15.78 | 0.76 | 2.14 | 0.3162 | -0.0021 | |||
| CXT / Crane NXT, Co. | 0.02 | 16.66 | 0.72 | -14.45 | 0.2993 | -0.0606 | |||
| GEN / Gen Digital Inc. | 0.03 | 20.13 | 0.69 | 15.47 | 0.2877 | 0.0314 | |||
| VLTO / Veralto Corporation | 0.01 | 22.13 | 0.69 | 13.34 | 0.2849 | 0.0262 | |||
| VLO / Valero Energy Corporation | 0.01 | 20.53 | 0.68 | 5.26 | 0.2822 | 0.0062 | |||
| IPG / The Interpublic Group of Companies, Inc. | 0.03 | 22.97 | 0.65 | 7.68 | 0.2673 | 0.0121 | |||
| GFL / GFL Environmental Inc. | 0.01 | 1.65 | 0.62 | 17.59 | 0.2548 | 0.0318 | |||
| RPRX / Royalty Pharma plc | 0.02 | 1.65 | 0.61 | 5.57 | 0.2513 | 0.0066 | |||
| SWX / Southwest Gas Holdings, Inc. | 0.01 | 23.53 | 0.61 | 19.53 | 0.2512 | 0.0348 | |||
| PRY / Tion Renewables AG | 0.01 | 0.00 | 0.33 | -21.48 | 0.1365 | -0.0421 | |||
| SBUX / Starbucks Corporation | 0.00 | 0.00 | 0.32 | -25.58 | 0.1326 | -0.0509 | |||
| US7587501039 / Regal-Beloit Corp. | 0.00 | 0.00 | 0.32 | -33.33 | 0.1318 | -0.0716 | |||
| ACI / Albertsons Companies, Inc. | 0.01 | 0.00 | 0.30 | 9.63 | 0.1229 | 0.0076 | |||
| COST / Costco Wholesale Corporation | 0.00 | 0.00 | 0.27 | 1.51 | 0.1116 | -0.0015 | |||
| AVGO / Broadcom Inc. | 0.00 | 0.00 | 0.25 | -12.89 | 0.1036 | -0.0189 | |||
| HI / Hillenbrand, Inc. | 0.01 | 0.00 | 0.18 | -40.40 | 0.0746 | -0.0543 | |||
| US31635A3032 / Fidelity Securities Lending Cash Central Fund | 0.10 | -95.29 | 0.10 | -95.30 | 0.0407 | -0.8473 | |||
| COLM / Columbia Sportswear Company | 0.00 | 0.00 | 0.10 | -29.71 | 0.0405 | -0.0187 | |||
| CVE / Cenovus Energy Inc. | 0.01 | 0.00 | 0.06 | -19.23 | 0.0263 | -0.0069 |