Mga Batayang Estadistika
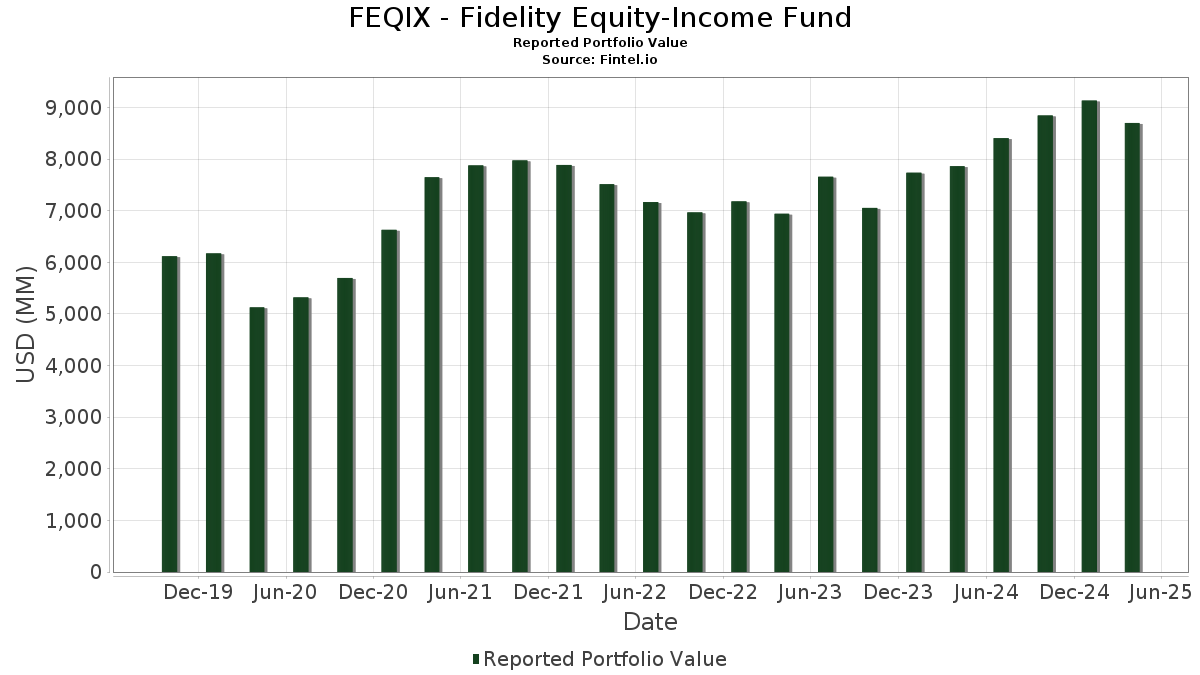
| Nilai Portofolio | $ 8,701,757,595 |
| Posisi Saat Ini | 124 |
Kepemilikan Terbaru, Kinerja, AUM (dari 13F, 13D)
FEQIX - Fidelity Equity-Income Fund telah mengungkapkan total kepemilikan 124 dalam pengajuan SEC terbaru mereka. Nilai portofolio terbaru dihitung sebesar $ 8,701,757,595 USD. Aset yang Dikelola (AUM) sebenarnya adalah nilai ini ditambah kas (yang tidak diungkapkan). Aset-aset utama FEQIX - Fidelity Equity-Income Fund adalah JPMorgan Chase & Co. (US:JPM) , Exxon Mobil Corporation (US:XOM) , Walmart Inc. (US:WMT) , Linde plc (US:LIN) , and AbbVie Inc. (US:ABBV) . Posisi baru FEQIX - Fidelity Equity-Income Fund meliputi: The Charles Schwab Corporation (US:SCHW) , .
Peningkatan Tertinggi Kuartal Ini
Kami menggunakan perubahan dalam alokasi portofolio karena ini adalah metrik yang paling bermakna. Perubahan dapat disebabkan oleh perdagangan atau perubahan harga saham.
| Keamanan | Saham (MM) |
Nilai (Juta Dolar AS) |
Portfolio % | ΔPorsyento ng Portfolio |
|---|---|---|---|---|
| 1.03 | 83.97 | 0.9651 | 0.9651 | |
| 1.04 | 203.88 | 2.3432 | 0.2411 | |
| 0.41 | 131.41 | 1.5103 | 0.2121 | |
| 1.29 | 137.40 | 1.5792 | 0.2080 | |
| 1.05 | 128.38 | 1.4754 | 0.1985 | |
| 1.35 | 97.63 | 1.1220 | 0.1877 | |
| 2.86 | 79.17 | 0.9099 | 0.1680 | |
| 0.52 | 149.34 | 1.7164 | 0.1639 | |
| 0.57 | 67.00 | 0.7700 | 0.1526 | |
| 4.33 | 43.85 | 0.5040 | 0.1507 |
Penurunan Tertinggi Kuartal Ini
Kami menggunakan perubahan dalam alokasi portofolio karena ini adalah metrik yang paling bermakna. Perubahan dapat disebabkan oleh perdagangan atau perubahan harga saham.
| Keamanan | Saham (MM) |
Nilai (Juta Dolar AS) |
Portfolio % | ΔPorsyento ng Portfolio |
|---|---|---|---|---|
| 69.94 | 69.95 | 0.8040 | -2.0472 | |
| 0.39 | 159.60 | 1.8343 | -0.4675 | |
| 0.74 | 122.55 | 1.4085 | -0.2748 | |
| 0.92 | 33.29 | 0.3826 | -0.2710 | |
| 0.76 | 121.97 | 1.4018 | -0.2666 | |
| 0.26 | 76.35 | 0.8775 | -0.1972 | |
| 0.27 | 61.30 | 0.7045 | -0.1957 | |
| 3.87 | 154.37 | 1.7741 | -0.1862 | |
| 0.43 | 41.89 | 0.4814 | -0.1720 | |
| 0.89 | 80.87 | 0.9295 | -0.1702 |
Pengajuan 13F dan Dana
Formulir ini diajukan pada 2025-06-26 untuk periode pelaporan 2025-04-30. Klik ikon tautan untuk melihat riwayat transaksi selengkapnya.
Tingkatkan ke versi premium untuk membuka data premium dan ekspor ke Excel. ![]() .
.
| Keamanan | Ketik | Harga Saham Rata-rata | Saham (MM) |
ΔSaham (%) |
ΔSaham (%) |
Nilai ($MM) |
Portpolyo (%) |
ΔPortofolio (%) |
|
|---|---|---|---|---|---|---|---|---|---|
| JPM / JPMorgan Chase & Co. | 1.36 | 0.00 | 331.49 | -8.48 | 3.8098 | -0.1522 | |||
| XOM / Exxon Mobil Corporation | 2.39 | 0.00 | 252.51 | -1.12 | 2.9021 | 0.1087 | |||
| WMT / Walmart Inc. | 2.21 | 0.00 | 215.13 | -0.93 | 2.4725 | 0.0974 | |||
| LIN / Linde plc | 0.45 | 0.00 | 205.14 | 1.59 | 2.3577 | 0.1490 | |||
| ABBV / AbbVie Inc. | 1.04 | 0.00 | 203.88 | 6.09 | 2.3432 | 0.2411 | |||
| GE / General Electric Company | 0.88 | 0.00 | 177.79 | -1.00 | 2.0434 | 0.0791 | |||
| WFC / Wells Fargo & Company | 2.31 | 0.00 | 163.93 | -9.89 | 1.8840 | -0.1057 | |||
| PG / The Procter & Gamble Company | 1.01 | 0.00 | 163.67 | -2.06 | 1.8811 | 0.0532 | |||
| UNH / UnitedHealth Group Incorporated | 0.39 | 0.00 | 159.60 | -24.16 | 1.8343 | -0.4675 | |||
| BAC / Bank of America Corporation | 3.87 | 0.00 | 154.37 | -13.87 | 1.7741 | -0.1862 | |||
| CB / Chubb Limited | 0.52 | 0.00 | 149.34 | 5.22 | 1.7164 | 0.1639 | |||
| JNJ / Johnson & Johnson | 0.88 | 0.00 | 137.67 | 2.73 | 1.5823 | 0.1165 | |||
| GILD / Gilead Sciences, Inc. | 1.29 | 0.00 | 137.40 | 9.61 | 1.5792 | 0.2080 | |||
| MCD / McDonald's Corporation | 0.41 | 0.00 | 131.41 | 10.72 | 1.5103 | 0.2121 | |||
| DHR / Danaher Corporation | 0.65 | 0.00 | 130.33 | -10.51 | 1.4978 | -0.0951 | |||
| HIG / The Hartford Insurance Group, Inc. | 1.05 | 0.00 | 128.38 | 9.97 | 1.4754 | 0.1985 | |||
| TSM / Taiwan Semiconductor Manufacturing Company Limited - Depositary Receipt (Common Stock) | 0.74 | 0.00 | 122.55 | -20.37 | 1.4085 | -0.2748 | |||
| PNC / The PNC Financial Services Group, Inc. | 0.76 | 0.00 | 121.97 | -20.03 | 1.4018 | -0.2666 | |||
| MSFT / Microsoft Corporation | 0.29 | 0.00 | 116.53 | -4.77 | 1.3393 | 0.0008 | |||
| TMUS / T-Mobile US, Inc. | 0.46 | 0.00 | 113.54 | 6.00 | 1.3049 | 0.1333 | |||
| TJX / The TJX Companies, Inc. | 0.88 | 0.00 | 113.35 | 3.12 | 1.3028 | 0.1004 | |||
| TRV / The Travelers Companies, Inc. | 0.40 | 0.00 | 106.27 | 7.73 | 1.2213 | 0.1424 | |||
| ITT / ITT Inc. | 0.74 | 0.00 | 102.05 | -9.27 | 1.1729 | -0.0574 | |||
| KO / The Coca-Cola Company | 1.35 | 0.00 | 97.63 | 14.29 | 1.1220 | 0.1877 | |||
| GEV / GE Vernova Inc. | 0.26 | 0.00 | 96.37 | -0.55 | 1.1076 | 0.0476 | |||
| CSCO / Cisco Systems, Inc. | 1.67 | 0.00 | 96.30 | -4.74 | 1.1067 | 0.0011 | |||
| NEE / NextEra Energy, Inc. | 1.44 | 0.00 | 96.05 | -6.54 | 1.1039 | -0.0202 | |||
| MMC / Marsh & McLennan Companies, Inc. | 0.42 | 0.00 | 93.94 | 3.96 | 1.0796 | 0.0913 | |||
| AZN / Astrazeneca plc | 0.65 | 0.00 | 93.44 | 2.06 | 1.0739 | 0.0725 | |||
| LOW / Lowe's Companies, Inc. | 0.39 | 0.00 | 88.10 | -14.03 | 1.0125 | -0.1084 | |||
| MTB / M&T Bank Corporation | 0.50 | 0.00 | 84.08 | -15.64 | 0.9663 | -0.1239 | |||
| SCHW / The Charles Schwab Corporation | 1.03 | 83.97 | 0.9651 | 0.9651 | |||||
| KDP / Keurig Dr Pepper Inc. | 2.43 | 0.00 | 83.96 | 7.76 | 0.9649 | 0.1127 | |||
| SO / The Southern Company | 0.90 | 0.00 | 82.86 | 9.46 | 0.9523 | 0.1243 | |||
| CMCSA / Comcast Corporation | 2.38 | 0.00 | 81.52 | 1.60 | 0.9369 | 0.0593 | |||
| LAMR / Lamar Advertising Company | 0.71 | 0.00 | 81.11 | -9.97 | 0.9322 | -0.0533 | |||
| DIS / The Walt Disney Company | 0.89 | 0.00 | 80.87 | -19.56 | 0.9295 | -0.1702 | |||
| VZ / Verizon Communications Inc. | 1.81 | 0.00 | 79.67 | 11.86 | 0.9157 | 0.1366 | |||
| T / AT&T Inc. | 2.86 | 0.00 | 79.17 | 16.73 | 0.9099 | 0.1680 | |||
| NXPI / NXP Semiconductors N.V. | 0.43 | 0.00 | 78.81 | -11.62 | 0.9058 | -0.0696 | |||
| CR / Crane Company | 0.47 | 0.00 | 76.45 | -5.48 | 0.8786 | -0.0061 | |||
| ACN / Accenture plc | 0.26 | 0.00 | 76.35 | -22.29 | 0.8775 | -0.1972 | |||
| NSC / Norfolk Southern Corporation | 0.34 | 0.00 | 75.26 | -12.24 | 0.8649 | -0.0731 | |||
| MRK / Merck & Co., Inc. | 0.87 | 0.00 | 73.86 | -13.78 | 0.8488 | -0.0882 | |||
| CCK / Crown Holdings, Inc. | 0.77 | 0.00 | 73.73 | 9.64 | 0.8474 | 0.1118 | |||
| LLY / Eli Lilly and Company | 0.08 | 0.00 | 73.37 | 10.83 | 0.8432 | 0.1192 | |||
| US31635A1051 / Fidelity Cash Central Fund | 69.94 | -73.16 | 69.95 | -73.16 | 0.8040 | -2.0472 | |||
| BLK / BlackRock, Inc. | 0.08 | 0.00 | 69.76 | -14.99 | 0.8017 | -0.0959 | |||
| COF / Capital One Financial Corporation | 0.38 | 0.00 | 68.50 | -11.51 | 0.7873 | -0.0595 | |||
| AME / AMETEK, Inc. | 0.40 | 0.00 | 67.54 | -8.12 | 0.7763 | -0.0278 | |||
| BJ / BJ's Wholesale Club Holdings, Inc. | 0.57 | 0.00 | 67.00 | 18.69 | 0.7700 | 0.1526 | |||
| V / Visa Inc. | 0.19 | 0.00 | 66.43 | 1.08 | 0.7634 | 0.0446 | |||
| HBAN / Huntington Bancshares Incorporated | 4.56 | 0.00 | 66.25 | -15.52 | 0.7614 | -0.0964 | |||
| SAN / Santander UK plc - Preferred Stock | 0.60 | 0.00 | 65.20 | 0.65 | 0.7493 | 0.0408 | |||
| JCI / Johnson Controls International plc | 0.77 | 0.00 | 64.41 | 7.57 | 0.7402 | 0.0853 | |||
| SHEL / Shell plc | 1.98 | 1.01 | 63.94 | -0.72 | 0.7348 | 0.0304 | |||
| NOC / Northrop Grumman Corporation | 0.13 | 0.00 | 63.23 | -0.16 | 0.7267 | 0.0340 | |||
| GD / General Dynamics Corporation | 0.23 | 0.00 | 62.97 | 5.89 | 0.7237 | 0.0733 | |||
| IMO / Imperial Oil Limited | 0.92 | 0.00 | 61.82 | 1.41 | 0.7105 | 0.0437 | |||
| CEG / Constellation Energy Corporation | 0.27 | 0.00 | 61.30 | -25.52 | 0.7045 | -0.1957 | |||
| USB / U.S. Bancorp | 1.47 | 0.00 | 59.22 | -15.57 | 0.6807 | -0.0866 | |||
| DOX / Amdocs Limited | 0.66 | 0.00 | 58.14 | 0.44 | 0.6682 | 0.0351 | |||
| GOOGL / Alphabet Inc. | 0.36 | 0.00 | 57.89 | -22.16 | 0.6654 | -0.1482 | |||
| CI / The Cigna Group | 0.17 | 0.00 | 57.19 | 15.58 | 0.6572 | 0.1160 | |||
| WSO / Watsco, Inc. | 0.12 | 0.00 | 57.04 | -3.92 | 0.6556 | 0.0062 | |||
| 005930 / Samsung Electronics Co., Ltd. | 1.46 | 0.00 | 56.98 | 9.37 | 0.6548 | 0.0850 | |||
| AMT / American Tower Corporation | 0.24 | 0.00 | 53.69 | 21.87 | 0.6170 | 0.1352 | |||
| EPD / Enterprise Products Partners L.P. - Limited Partnership | 1.77 | 0.00 | 52.94 | -8.42 | 0.6085 | -0.0239 | |||
| APO / Apollo Global Management, Inc. | 0.38 | 0.00 | 51.45 | -20.18 | 0.5913 | -0.1137 | |||
| RHHBY / Roche Holding AG - Depositary Receipt (Common Stock) | 0.16 | 0.00 | 50.72 | 4.01 | 0.5829 | 0.0495 | |||
| HES / Hess Corporation | 0.38 | 0.00 | 49.65 | -7.18 | 0.5707 | -0.0144 | |||
| ADI / Analog Devices, Inc. | 0.25 | 0.00 | 49.58 | -8.01 | 0.5699 | -0.0197 | |||
| VST / Vistra Corp. | 0.38 | 0.00 | 48.73 | -22.85 | 0.5601 | -0.1309 | |||
| PSA / Public Storage | 0.16 | 0.00 | 48.37 | 0.65 | 0.5559 | 0.0303 | |||
| HII / Huntington Ingalls Industries, Inc. | 0.21 | 0.00 | 47.65 | 16.77 | 0.5476 | 0.1013 | |||
| CNQ / Canadian Natural Resources Limited | 1.65 | 0.00 | 47.29 | -5.54 | 0.5435 | -0.0041 | |||
| BLL / Ball Corp. | 0.90 | 0.00 | 46.87 | -6.75 | 0.5387 | -0.0111 | |||
| AFG / American Financial Group, Inc. | 0.37 | 0.00 | 46.27 | -7.25 | 0.5318 | -0.0139 | |||
| MDLZ / Mondelez International, Inc. | 0.66 | 0.00 | 45.25 | 17.48 | 0.5200 | 0.0988 | |||
| BURL / Burlington Stores, Inc. | 0.20 | 0.00 | 44.60 | -20.74 | 0.5126 | -0.1029 | |||
| TPR / Tapestry, Inc. | 0.63 | 0.00 | 44.51 | -3.14 | 0.5115 | 0.0089 | |||
| RYCEY / Rolls-Royce Holdings plc - Depositary Receipt (Common Stock) | 4.33 | 0.00 | 43.85 | 35.76 | 0.5040 | 0.1507 | |||
| DKS / DICK'S Sporting Goods, Inc. | 0.23 | 0.00 | 42.71 | -21.79 | 0.4908 | -0.1065 | |||
| TGT / Target Corporation | 0.43 | 0.00 | 41.89 | -29.88 | 0.4814 | -0.1720 | |||
| HRB / H&R Block, Inc. | 0.69 | 0.00 | 41.64 | 9.15 | 0.4785 | 0.0613 | |||
| AAPL / Apple Inc. | 0.19 | 0.00 | 39.97 | -9.96 | 0.4593 | -0.0262 | |||
| KVUE / Kenvue Inc. | 1.65 | 0.00 | 38.90 | 10.85 | 0.4471 | 0.0632 | |||
| WEC / WEC Energy Group, Inc. | 0.35 | 0.00 | 37.94 | 10.34 | 0.4361 | 0.0599 | |||
| QBCRF / Quebecor Inc. | 1.35 | 0.00 | 37.08 | 23.59 | 0.4262 | 0.0980 | |||
| HIA1 / Hitachi, Ltd. | 1.49 | 0.00 | 36.92 | -1.69 | 0.4243 | 0.0135 | |||
| CNP / CenterPoint Energy, Inc. | 0.94 | 0.00 | 36.49 | 19.07 | 0.4194 | 0.0842 | |||
| EXC / Exelon Corporation | 0.75 | 0.00 | 35.27 | 17.25 | 0.4053 | 0.0763 | |||
| UL / Unilever PLC - Depositary Receipt (Common Stock) | 0.55 | 0.00 | 35.00 | 11.16 | 0.4022 | 0.0579 | |||
| MTRAF / Metro Inc. | 0.45 | 0.00 | 34.67 | 23.33 | 0.3984 | 0.0910 | |||
| ATD / Alimentation Couche-Tard Inc. | 0.65 | 0.00 | 34.11 | -1.16 | 0.3921 | 0.0146 | |||
| AEE / Ameren Corporation | 0.34 | 0.00 | 34.00 | 5.35 | 0.3907 | 0.0378 | |||
| FCX / Freeport-McMoRan Inc. | 0.92 | -44.56 | 33.29 | -44.29 | 0.3826 | -0.2710 | |||
| SIE / Siemens Aktiengesellschaft | 0.14 | 0.00 | 31.66 | 7.41 | 0.3639 | 0.0415 | |||
| PCG / PG&E Corporation | 1.84 | 0.00 | 30.31 | 5.56 | 0.3484 | 0.0343 | |||
| VK / Vallourec S.A. | 1.63 | 47.83 | 30.17 | 43.13 | 0.3467 | 0.1162 | |||
| KBR / KBR, Inc. | 0.57 | 0.00 | 29.84 | -2.96 | 0.3429 | 0.0066 | |||
| SJM / The J. M. Smucker Company | 0.25 | 0.00 | 29.64 | 8.78 | 0.3406 | 0.0426 | |||
| GS71 / GSK plc | 1.47 | 0.00 | 29.13 | 13.56 | 0.3348 | 0.0542 | |||
| QSR / Restaurant Brands International Inc. | 0.42 | 0.00 | 27.26 | 4.79 | 0.3133 | 0.0288 | |||
| PSX / Phillips 66 | 0.26 | 0.00 | 26.85 | -11.72 | 0.3086 | -0.0241 | |||
| FE / FirstEnergy Corp. | 0.62 | 0.00 | 26.56 | 7.74 | 0.3052 | 0.0356 | |||
| CXT / Crane NXT, Co. | 0.53 | 0.00 | 24.96 | -26.65 | 0.2869 | -0.0854 | |||
| GFL / GFL Environmental Inc. | 0.49 | 0.00 | 24.50 | 15.66 | 0.2816 | 0.0499 | |||
| RPRX / Royalty Pharma plc | 0.73 | 0.00 | 24.06 | 3.93 | 0.2765 | 0.0233 | |||
| GEN / Gen Digital Inc. | 0.90 | 0.00 | 23.40 | -3.87 | 0.2690 | 0.0027 | |||
| VLO / Valero Energy Corporation | 0.20 | 0.00 | 23.04 | -12.71 | 0.2648 | -0.0239 | |||
| VLTO / Veralto Corporation | 0.24 | 0.00 | 22.94 | -7.24 | 0.2637 | -0.0069 | |||
| IPG / The Interpublic Group of Companies, Inc. | 0.85 | 0.00 | 21.24 | -12.38 | 0.2441 | -0.0210 | |||
| SWX / Southwest Gas Holdings, Inc. | 0.28 | 0.00 | 19.94 | -3.31 | 0.2292 | 0.0036 | |||
| PRY / Tion Renewables AG | 0.25 | 0.00 | 13.59 | -21.37 | 0.1562 | -0.0328 | |||
| US7587501039 / Regal-Beloit Corp. | 0.12 | 0.00 | 12.80 | -33.32 | 0.1471 | -0.0628 | |||
| SBUX / Starbucks Corporation | 0.16 | 0.00 | 12.49 | -25.66 | 0.1435 | -0.0402 | |||
| ACI / Albertsons Companies, Inc. | 0.53 | 0.00 | 11.55 | 9.63 | 0.1327 | 0.0175 | |||
| US31635A3032 / Fidelity Securities Lending Cash Central Fund | 10.95 | 320.29 | 10.95 | 320.34 | 0.1259 | 0.0974 | |||
| COST / Costco Wholesale Corporation | 0.01 | 0.00 | 10.24 | 1.50 | 0.1177 | 0.0073 | |||
| AVGO / Broadcom Inc. | 0.05 | 0.00 | 9.82 | -13.02 | 0.1128 | -0.0106 | |||
| HI / Hillenbrand, Inc. | 0.35 | 0.00 | 7.14 | -40.48 | 0.0821 | -0.0492 | |||
| COLM / Columbia Sportswear Company | 0.06 | 0.00 | 3.74 | -29.59 | 0.0430 | -0.0151 | |||
| CVE / Cenovus Energy Inc. | 0.23 | 0.00 | 2.70 | -18.60 | 0.0310 | -0.0053 |