Mga Batayang Estadistika
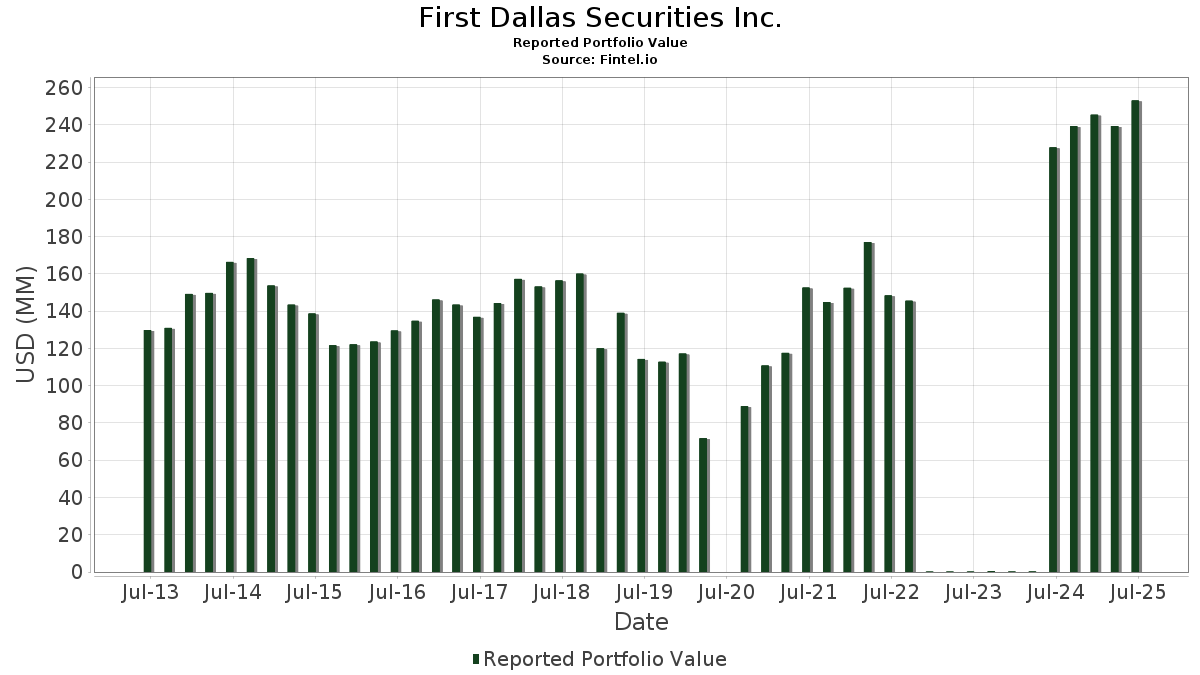
| Nilai Portofolio | $ 252,998,596 |
| Posisi Saat Ini | 123 |
Kepemilikan Terbaru, Kinerja, AUM (dari 13F, 13D)
First Dallas Securities Inc. telah mengungkapkan total kepemilikan 123 dalam pengajuan SEC terbaru mereka. Nilai portofolio terbaru dihitung sebesar $ 252,998,596 USD. Aset yang Dikelola (AUM) sebenarnya adalah nilai ini ditambah kas (yang tidak diungkapkan). Aset-aset utama First Dallas Securities Inc. adalah NVIDIA Corporation (US:NVDA) , Texas Pacific Land Corporation (US:TPL) , Apple Inc. (US:AAPL) , Amazon.com, Inc. (US:AMZN) , and Microsoft Corporation (US:MSFT) . Posisi baru First Dallas Securities Inc. meliputi: Millrose Properties, Inc. (US:MRP) , Powell Industries, Inc. (US:POWL) , Nebius Group N.V. (US:NBIS) , Eaton Corporation plc (US:ETN) , and GE Vernova Inc. (US:GEV) .
Peningkatan Tertinggi Kuartal Ini
Kami menggunakan perubahan dalam alokasi portofolio karena ini adalah metrik yang paling bermakna. Perubahan dapat disebabkan oleh perdagangan atau perubahan harga saham.
| Keamanan | Saham (MM) |
Nilai (Juta Dolar AS) |
Portfolio % | ΔPorsyento ng Portfolio |
|---|---|---|---|---|
| 0.21 | 33.01 | 13.0456 | 3.5412 | |
| 0.03 | 5.81 | 2.2980 | 1.1806 | |
| 0.06 | 1.62 | 0.6421 | 0.6421 | |
| 0.01 | 7.04 | 2.7824 | 0.6308 | |
| 0.02 | 8.32 | 3.2890 | 0.5904 | |
| 0.04 | 8.73 | 3.4489 | 0.5823 | |
| 0.03 | 3.37 | 1.3338 | 0.5006 | |
| 0.01 | 1.26 | 0.4982 | 0.4982 | |
| 0.03 | 2.41 | 0.9543 | 0.4654 | |
| 0.10 | 4.29 | 1.6938 | 0.4021 |
Penurunan Tertinggi Kuartal Ini
Kami menggunakan perubahan dalam alokasi portofolio karena ini adalah metrik yang paling bermakna. Perubahan dapat disebabkan oleh perdagangan atau perubahan harga saham.
| Keamanan | Saham (MM) |
Nilai (Juta Dolar AS) |
Portfolio % | ΔPorsyento ng Portfolio |
|---|---|---|---|---|
| 0.02 | 24.54 | 9.7015 | -4.2052 | |
| 0.07 | 14.30 | 5.6531 | -1.0135 | |
| 0.07 | 5.82 | 2.2990 | -0.7297 | |
| 0.00 | 0.28 | 0.1118 | -0.5125 | |
| 0.03 | 1.01 | 0.3994 | -0.4768 | |
| 0.05 | 5.26 | 2.0808 | -0.4348 | |
| 0.01 | 0.94 | 0.3732 | -0.4020 | |
| 0.04 | 3.45 | 1.3631 | -0.3823 | |
| 0.02 | 3.10 | 1.2247 | -0.3122 | |
| 0.00 | 0.35 | 0.1389 | -0.2719 |
Pengajuan 13F dan Dana
Formulir ini diajukan pada 2025-08-07 untuk periode pelaporan 2025-06-30. Klik ikon tautan untuk melihat riwayat transaksi selengkapnya.
Tingkatkan ke versi premium untuk membuka data premium dan ekspor ke Excel. ![]() .
.
| Keamanan | Ketik | Harga Saham Rata-rata | Saham (MM) |
ΔSaham (%) |
ΔSaham (%) |
Nilai ($MM) |
Portpolyo (%) |
ΔPortofolio (%) |
|
|---|---|---|---|---|---|---|---|---|---|
| NVDA / NVIDIA Corporation | 0.21 | -0.46 | 33.01 | 45.11 | 13.0456 | 3.5412 | |||
| TPL / Texas Pacific Land Corporation | 0.02 | -7.50 | 24.54 | -26.25 | 9.7015 | -4.2052 | |||
| AAPL / Apple Inc. | 0.07 | -2.94 | 14.30 | -10.35 | 5.6531 | -1.0135 | |||
| AMZN / Amazon.com, Inc. | 0.04 | 10.30 | 8.73 | 27.19 | 3.4489 | 0.5823 | |||
| MSFT / Microsoft Corporation | 0.02 | -2.76 | 8.32 | 28.85 | 3.2890 | 0.5904 | |||
| UBER / Uber Technologies, Inc. | 0.08 | -9.11 | 7.33 | 16.38 | 2.8959 | 0.2654 | |||
| META / Meta Platforms, Inc. | 0.01 | 6.75 | 7.04 | 36.71 | 2.7824 | 0.6308 | |||
| OKE / ONEOK, Inc. | 0.07 | -2.45 | 5.82 | -19.76 | 2.2990 | -0.7297 | |||
| BA / The Boeing Company | 0.03 | 77.00 | 5.81 | 117.39 | 2.2980 | 1.1806 | |||
| XOM / Exxon Mobil Corporation | 0.05 | -3.52 | 5.26 | -12.56 | 2.0808 | -0.4348 | |||
| FCX / Freeport-McMoRan Inc. | 0.11 | -2.45 | 4.80 | 11.68 | 1.8977 | 0.1013 | |||
| DKNG / DraftKings Inc. | 0.10 | 7.36 | 4.29 | 38.63 | 1.6938 | 0.4021 | |||
| JPM / JPMorgan Chase & Co. | 0.01 | -2.22 | 4.08 | 15.55 | 1.6129 | 0.1374 | |||
| CAT / Caterpillar Inc. | 0.01 | 0.86 | 3.86 | 18.71 | 1.5251 | 0.1671 | |||
| IBM / International Business Machines Corporation | 0.01 | -3.38 | 3.78 | 14.54 | 1.4946 | 0.1153 | |||
| VST / Vistra Corp. | 0.02 | -21.56 | 3.72 | 29.42 | 1.4714 | 0.2697 | |||
| LLY / Eli Lilly and Company | 0.00 | 0.11 | 3.46 | -5.51 | 1.3690 | -0.1625 | |||
| WYNN / Wynn Resorts, Limited | 0.04 | -26.40 | 3.45 | -17.45 | 1.3631 | -0.3823 | |||
| HD / The Home Depot, Inc. | 0.01 | -3.83 | 3.44 | -3.80 | 1.3603 | -0.1344 | |||
| SN / SharkNinja, Inc. | 0.03 | 42.61 | 3.37 | 69.21 | 1.3338 | 0.5006 | |||
| KEX / Kirby Corporation | 0.03 | -0.51 | 3.30 | 11.70 | 1.3060 | 0.0700 | |||
| EXP / Eagle Materials Inc. | 0.02 | 2.14 | 3.19 | -7.00 | 1.2607 | -0.1722 | |||
| ABBV / AbbVie Inc. | 0.02 | -4.90 | 3.10 | -15.77 | 1.2247 | -0.3122 | |||
| ETD / Ethan Allen Interiors Inc. | 0.11 | -4.48 | 3.03 | -3.99 | 1.1976 | -0.1208 | |||
| EXE / Expand Energy Corporation | 0.03 | -2.81 | 3.00 | 2.07 | 1.1862 | -0.0423 | |||
| WMT / Walmart Inc. | 0.03 | -1.68 | 2.85 | 9.51 | 1.1247 | 0.0391 | |||
| COST / Costco Wholesale Corporation | 0.00 | 0.00 | 2.68 | 4.66 | 1.0575 | -0.0105 | |||
| TSM / Taiwan Semiconductor Manufacturing Company Limited - Depositary Receipt (Common Stock) | 0.01 | -4.19 | 2.65 | 30.70 | 1.0469 | 0.2003 | |||
| T / AT&T Inc. | 0.09 | -6.92 | 2.47 | -4.78 | 0.9762 | -0.1074 | |||
| C / Citigroup Inc. | 0.03 | 72.06 | 2.41 | 106.32 | 0.9543 | 0.4654 | |||
| CLF / Cleveland-Cliffs Inc. | 0.31 | 27.24 | 2.37 | 17.61 | 0.9374 | 0.0949 | |||
| BAC / Bank of America Corporation | 0.04 | -16.55 | 1.94 | -5.37 | 0.7661 | -0.0896 | |||
| XEL / Xcel Energy Inc. | 0.03 | -3.26 | 1.71 | -6.96 | 0.6764 | -0.0921 | |||
| CSWC / Capital Southwest Corporation | 0.08 | 7.20 | 1.70 | 5.86 | 0.6717 | 0.0010 | |||
| MU / Micron Technology, Inc. | 0.01 | -6.32 | 1.69 | 32.89 | 0.6676 | 0.1365 | |||
| MRP / Millrose Properties, Inc. | 0.06 | 1.62 | 0.6421 | 0.6421 | |||||
| JNJ / Johnson & Johnson | 0.01 | -5.42 | 1.62 | -12.89 | 0.6384 | -0.1364 | |||
| AXP / American Express Company | 0.00 | -5.60 | 1.55 | 11.88 | 0.6144 | 0.0340 | |||
| WFC / Wells Fargo & Company | 0.02 | -3.10 | 1.50 | 8.09 | 0.5916 | 0.0132 | |||
| AMGN / Amgen Inc. | 0.01 | -18.91 | 1.43 | -27.33 | 0.5645 | -0.2566 | |||
| MTZ / MasTec, Inc. | 0.01 | -5.65 | 1.42 | 37.75 | 0.5625 | 0.1308 | |||
| GOOGL / Alphabet Inc. | 0.01 | -17.34 | 1.41 | -5.80 | 0.5582 | -0.0682 | |||
| UPS / United Parcel Service, Inc. | 0.01 | 20.13 | 1.38 | 10.19 | 0.5474 | 0.0225 | |||
| SCHW / The Charles Schwab Corporation | 0.02 | -17.96 | 1.38 | -4.44 | 0.5449 | -0.0577 | |||
| CMC / Commercial Metals Company | 0.03 | -10.35 | 1.31 | -4.73 | 0.5180 | -0.0566 | |||
| WHR / Whirlpool Corporation | 0.01 | 28.15 | 1.27 | 44.15 | 0.5022 | 0.1340 | |||
| RHP / Ryman Hospitality Properties, Inc. | 0.01 | 1.26 | 0.4982 | 0.4982 | |||||
| PLTR / Palantir Technologies Inc. | 0.01 | 33.73 | 1.24 | 115.80 | 0.4913 | 0.2507 | |||
| VZ / Verizon Communications Inc. | 0.03 | -5.61 | 1.20 | -10.02 | 0.4724 | -0.0825 | |||
| AEP / American Electric Power Company, Inc. | 0.01 | -5.95 | 1.15 | -10.76 | 0.4561 | -0.0838 | |||
| DUK / Duke Energy Corporation | 0.01 | -10.35 | 1.06 | -13.28 | 0.4206 | -0.0921 | |||
| CRS / Carpenter Technology Corporation | 0.00 | 38.53 | 1.04 | 111.13 | 0.4124 | 0.2060 | |||
| MMM / 3M Company | 0.01 | 0.01 | 1.04 | 3.68 | 0.4119 | -0.0080 | |||
| DVN / Devon Energy Corporation | 0.03 | -43.34 | 1.01 | -51.84 | 0.3994 | -0.4768 | |||
| HPE / Hewlett Packard Enterprise Company | 0.05 | -4.96 | 1.00 | 25.85 | 0.3947 | 0.0633 | |||
| BX / Blackstone Inc. | 0.01 | -3.10 | 0.96 | 3.57 | 0.3790 | -0.0076 | |||
| MRK / Merck & Co., Inc. | 0.01 | -42.28 | 0.94 | -49.11 | 0.3732 | -0.4020 | |||
| BANC / Banc of California, Inc. | 0.07 | -14.43 | 0.94 | -15.28 | 0.3705 | -0.0916 | |||
| GS / The Goldman Sachs Group, Inc. | 0.00 | -0.79 | 0.88 | 28.49 | 0.3497 | 0.0622 | |||
| HR / Healthcare Realty Trust Incorporated | 0.06 | -34.12 | 0.88 | -38.20 | 0.3479 | -0.2471 | |||
| KO / The Coca-Cola Company | 0.01 | -3.26 | 0.83 | -4.49 | 0.3279 | -0.0348 | |||
| PR / Permian Resources Corporation | 0.05 | 6.40 | 0.75 | 4.62 | 0.2954 | -0.0030 | |||
| ATO / Atmos Energy Corporation | 0.00 | 0.06 | 0.74 | -0.27 | 0.2926 | -0.0175 | |||
| BRK.A / Berkshire Hathaway Inc. | 0.00 | 0.00 | 0.73 | -8.77 | 0.2881 | -0.0454 | |||
| ONON / On Holding AG | 0.01 | -2.45 | 0.73 | 15.45 | 0.2868 | 0.0244 | |||
| MS / Morgan Stanley | 0.01 | 0.00 | 0.71 | 20.64 | 0.2818 | 0.0349 | |||
| TSLA / Tesla, Inc. | 0.00 | 80.65 | 0.71 | 121.50 | 0.2812 | 0.1471 | |||
| BRK.B / Berkshire Hathaway Inc. | 0.00 | -9.36 | 0.71 | -17.35 | 0.2788 | -0.0777 | |||
| CYBR / CyberArk Software Ltd. | 0.00 | 0.65 | 0.2573 | 0.2573 | |||||
| SO / The Southern Company | 0.01 | 0.00 | 0.64 | -0.16 | 0.2548 | -0.0147 | |||
| NFLX / Netflix, Inc. | 0.00 | 0.00 | 0.62 | 43.59 | 0.2435 | 0.0642 | |||
| SPOT / Spotify Technology S.A. | 0.00 | 2.67 | 0.59 | 43.31 | 0.2329 | 0.0612 | |||
| WULF / TeraWulf Inc. | 0.13 | 126.50 | 0.58 | 262.50 | 0.2294 | 0.1625 | |||
| MTDR / Matador Resources Company | 0.01 | 7.25 | 0.57 | 0.18 | 0.2253 | -0.0125 | |||
| MTN / Vail Resorts, Inc. | 0.00 | 17.36 | 0.56 | 15.08 | 0.2205 | 0.0182 | |||
| HON / Honeywell International Inc. | 0.00 | 0.00 | 0.55 | 9.84 | 0.2163 | 0.0082 | |||
| RH / RH | 0.00 | 0.53 | 0.2110 | 0.2110 | |||||
| PANW / Palo Alto Networks, Inc. | 0.00 | -18.99 | 0.52 | -2.97 | 0.2071 | -0.0182 | |||
| VRT / Vertiv Holdings Co | 0.00 | 32.44 | 0.51 | 134.86 | 0.2027 | 0.1116 | |||
| AEE / Ameren Corporation | 0.01 | -8.72 | 0.50 | -12.87 | 0.1984 | -0.0419 | |||
| SPG / Simon Property Group, Inc. | 0.00 | 0.00 | 0.50 | -3.30 | 0.1970 | -0.0182 | |||
| MCD / McDonald's Corporation | 0.00 | -39.64 | 0.49 | -43.60 | 0.1934 | -0.1689 | |||
| ISRG / Intuitive Surgical, Inc. | 0.00 | 0.00 | 0.49 | 9.64 | 0.1933 | 0.0069 | |||
| ORCL / Oracle Corporation | 0.00 | -4.35 | 0.48 | 49.07 | 0.1901 | 0.0556 | |||
| DELL / Dell Technologies Inc. | 0.00 | 5.56 | 0.47 | 41.77 | 0.1839 | 0.0468 | |||
| FDX / FedEx Corporation | 0.00 | -20.85 | 0.46 | -26.29 | 0.1808 | -0.0783 | |||
| PTLO / Portillo's Inc. | 0.04 | -9.70 | 0.43 | -11.43 | 0.1718 | -0.0329 | |||
| AVGO / Broadcom Inc. | 0.00 | -25.24 | 0.43 | 22.73 | 0.1711 | 0.0240 | |||
| DE / Deere & Company | 0.00 | 0.12 | 0.43 | 8.38 | 0.1689 | 0.0043 | |||
| CFR / Cullen/Frost Bankers, Inc. | 0.00 | -15.47 | 0.42 | -13.37 | 0.1665 | -0.0365 | |||
| TFC / Truist Financial Corporation | 0.01 | 21.53 | 0.42 | 26.52 | 0.1644 | 0.0273 | |||
| POWL / Powell Industries, Inc. | 0.00 | 0.41 | 0.1622 | 0.1622 | |||||
| GEO / The GEO Group, Inc. | 0.02 | 0.40 | 0.1584 | 0.1584 | |||||
| RTX / RTX Corporation | 0.00 | -9.30 | 0.35 | -0.28 | 0.1401 | -0.0082 | |||
| ABNB / Airbnb, Inc. | 0.00 | -67.74 | 0.35 | -64.29 | 0.1389 | -0.2719 | |||
| NCLH / Norwegian Cruise Line Holdings Ltd. | 0.02 | -45.02 | 0.35 | -41.36 | 0.1371 | -0.1095 | |||
| TXN / Texas Instruments Incorporated | 0.00 | 0.00 | 0.33 | 15.57 | 0.1322 | 0.0114 | |||
| LIF / Life360, Inc. | 0.01 | -51.67 | 0.33 | -17.96 | 0.1302 | -0.0373 | |||
| LUV / Southwest Airlines Co. | 0.01 | -7.32 | 0.33 | -10.63 | 0.1298 | -0.0235 | |||
| FOUR / Shift4 Payments, Inc. | 0.00 | -19.38 | 0.32 | -2.45 | 0.1263 | -0.0103 | |||
| NBIS / Nebius Group N.V. | 0.01 | 0.32 | 0.1247 | 0.1247 | |||||
| PEP / PepsiCo, Inc. | 0.00 | -14.49 | 0.31 | -24.88 | 0.1219 | -0.0494 | |||
| COP / ConocoPhillips | 0.00 | -18.73 | 0.28 | -30.56 | 0.1124 | -0.0585 | |||
| GOOG / Alphabet Inc. | 0.00 | -78.56 | 0.28 | -81.12 | 0.1118 | -0.5125 | |||
| ETN / Eaton Corporation plc | 0.00 | 0.28 | 0.1101 | 0.1101 | |||||
| CVX / Chevron Corporation | 0.00 | -33.05 | 0.28 | -42.83 | 0.1089 | -0.0921 | |||
| PG / The Procter & Gamble Company | 0.00 | -2.83 | 0.27 | -9.30 | 0.1080 | -0.0178 | |||
| LMT / Lockheed Martin Corporation | 0.00 | 0.00 | 0.27 | 3.50 | 0.1053 | -0.0021 | |||
| GEV / GE Vernova Inc. | 0.00 | 0.25 | 0.0985 | 0.0985 | |||||
| EQT / EQT Corporation | 0.00 | -6.91 | 0.24 | 1.29 | 0.0931 | -0.0038 | |||
| GE / General Electric Company | 0.00 | 0.23 | 0.0902 | 0.0902 | |||||
| URI / United Rentals, Inc. | 0.00 | -6.25 | 0.23 | 12.44 | 0.0893 | 0.0053 | |||
| TFIN / Triumph Financial, Inc. | 0.00 | -4.68 | 0.22 | -9.31 | 0.0888 | -0.0144 | |||
| GNRC / Generac Holdings Inc. | 0.00 | 0.22 | 0.0877 | 0.0877 | |||||
| GENI / Genius Sports Limited | 0.02 | 0.22 | 0.0863 | 0.0863 | |||||
| V / Visa Inc. | 0.00 | 0.21 | 0.0842 | 0.0842 | |||||
| FANG / Diamondback Energy, Inc. | 0.00 | -38.98 | 0.21 | -47.78 | 0.0842 | -0.0855 | |||
| UAL / United Airlines Holdings, Inc. | 0.00 | 0.21 | 0.0818 | 0.0818 | |||||
| TTWO / Take-Two Interactive Software, Inc. | 0.00 | 0.20 | 0.0792 | 0.0792 | |||||
| AIOT / PowerFleet, Inc. | 0.04 | 26.23 | 0.17 | -1.20 | 0.0656 | -0.0042 | |||
| GMRE / Global Medical REIT Inc. | 0.02 | -57.89 | 0.11 | -66.97 | 0.0438 | -0.0953 | |||
| SFIX / Stitch Fix, Inc. | 0.01 | 0.04 | 0.0146 | 0.0146 | |||||
| TTGPF / TT Electronics plc | 0.02 | 0.02 | 0.0097 | 0.0097 | |||||
| DRI / Darden Restaurants, Inc. | 0.00 | -100.00 | 0.00 | 0.0000 | |||||
| BLDR / Builders FirstSource, Inc. | 0.00 | -100.00 | 0.00 | 0.0000 | |||||
| ET / Energy Transfer LP - Limited Partnership | 0.00 | -100.00 | 0.00 | 0.0000 | |||||
| STKL / SunOpta Inc. | 0.00 | -100.00 | 0.00 | 0.0000 | |||||
| SNBR / Sleep Number Corporation | 0.00 | -100.00 | 0.00 | 0.0000 | |||||
| SYM / Symbotic Inc. | 0.00 | -100.00 | 0.00 | 0.0000 |