Mga Batayang Estadistika
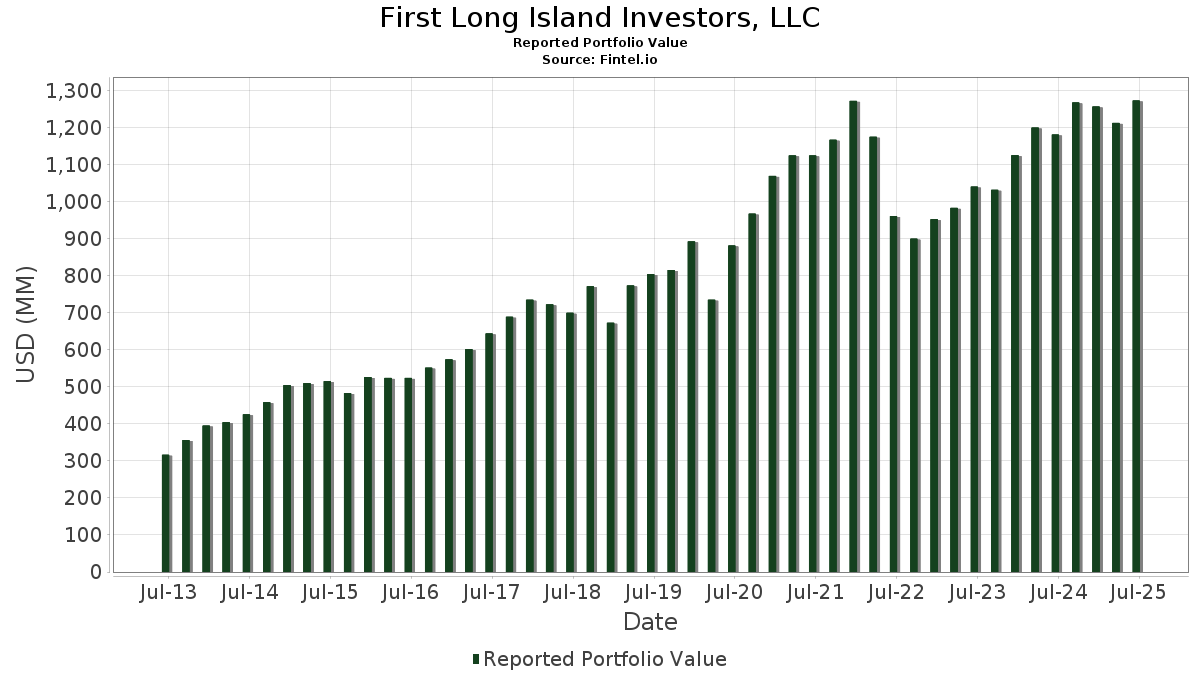
| Nilai Portofolio | $ 1,273,970,946 |
| Posisi Saat Ini | 65 |
Kepemilikan Terbaru, Kinerja, AUM (dari 13F, 13D)
First Long Island Investors, LLC telah mengungkapkan total kepemilikan 65 dalam pengajuan SEC terbaru mereka. Nilai portofolio terbaru dihitung sebesar $ 1,273,970,946 USD. Aset yang Dikelola (AUM) sebenarnya adalah nilai ini ditambah kas (yang tidak diungkapkan). Aset-aset utama First Long Island Investors, LLC adalah Microsoft Corporation (US:MSFT) , Amazon.com, Inc. (US:AMZN) , Automatic Data Processing, Inc. (US:ADP) , NVIDIA Corporation (US:NVDA) , and Abbott Laboratories (US:ABT) . Posisi baru First Long Island Investors, LLC meliputi: Agnico Eagle Mines Limited (US:AEM) , .
Peningkatan Tertinggi Kuartal Ini
Kami menggunakan perubahan dalam alokasi portofolio karena ini adalah metrik yang paling bermakna. Perubahan dapat disebabkan oleh perdagangan atau perubahan harga saham.
| Keamanan | Saham (MM) |
Nilai (Juta Dolar AS) |
Portfolio % | ΔPorsyento ng Portfolio |
|---|---|---|---|---|
| 0.12 | 31.84 | 2.4991 | 1.4490 | |
| 0.16 | 79.52 | 6.2417 | 1.2868 | |
| 0.37 | 59.01 | 4.6318 | 1.1849 | |
| 0.25 | 24.97 | 1.9599 | 0.6035 | |
| 0.05 | 34.73 | 2.7263 | 0.4987 | |
| 0.29 | 63.59 | 4.9915 | 0.4652 | |
| 0.12 | 26.80 | 2.1036 | 0.4510 | |
| 0.04 | 11.25 | 0.8832 | 0.4436 | |
| 0.22 | 34.46 | 2.7050 | 0.3754 | |
| 0.05 | 19.46 | 1.5274 | 0.3155 |
Penurunan Tertinggi Kuartal Ini
Kami menggunakan perubahan dalam alokasi portofolio karena ini adalah metrik yang paling bermakna. Perubahan dapat disebabkan oleh perdagangan atau perubahan harga saham.
| Keamanan | Saham (MM) |
Nilai (Juta Dolar AS) |
Portfolio % | ΔPorsyento ng Portfolio |
|---|---|---|---|---|
| 0.05 | 16.77 | 1.3167 | -3.2644 | |
| 0.08 | 15.71 | 1.2328 | -1.4837 | |
| 0.05 | 6.51 | 0.5112 | -0.3602 | |
| 0.02 | 9.73 | 0.7638 | -0.3493 | |
| 0.12 | 22.18 | 1.7411 | -0.3453 | |
| 0.16 | 34.91 | 2.7406 | -0.2968 | |
| 0.07 | 19.81 | 1.5551 | -0.2895 | |
| 0.10 | 13.90 | 1.0908 | -0.2603 | |
| 0.11 | 14.17 | 1.1125 | -0.2381 | |
| 0.11 | 17.51 | 1.3741 | -0.2239 |
Pengajuan 13F dan Dana
Formulir ini diajukan pada 2025-08-12 untuk periode pelaporan 2025-06-30. Klik ikon tautan untuk melihat riwayat transaksi selengkapnya.
Tingkatkan ke versi premium untuk membuka data premium dan ekspor ke Excel. ![]() .
.
| Keamanan | Ketik | Harga Saham Rata-rata | Saham (MM) |
ΔSaham (%) |
ΔSaham (%) |
Nilai ($MM) |
Portpolyo (%) |
ΔPortofolio (%) |
|
|---|---|---|---|---|---|---|---|---|---|
| MSFT / Microsoft Corporation | 0.16 | -0.20 | 79.52 | 32.24 | 6.2417 | 1.2868 | |||
| AMZN / Amazon.com, Inc. | 0.29 | 0.40 | 63.59 | 15.77 | 4.9915 | 0.4652 | |||
| ADP / Automatic Data Processing, Inc. | 0.20 | -0.28 | 61.29 | 0.65 | 4.8112 | -0.2068 | |||
| NVDA / NVIDIA Corporation | 0.37 | -3.23 | 59.01 | 41.07 | 4.6318 | 1.1849 | |||
| ABT / Abbott Laboratories | 0.43 | -0.28 | 57.89 | 2.24 | 4.5439 | -0.1216 | |||
| PH / Parker-Hannifin Corporation | 0.06 | -0.64 | 42.14 | 14.18 | 3.3078 | 0.2665 | |||
| MA / Mastercard Incorporated | 0.07 | 0.70 | 38.54 | 3.24 | 3.0253 | -0.0509 | |||
| V / Visa Inc. | 0.10 | 0.09 | 36.13 | 1.40 | 2.8357 | -0.1001 | |||
| LOW / Lowe's Companies, Inc. | 0.16 | -0.43 | 34.91 | -5.28 | 2.7406 | -0.2968 | |||
| META / Meta Platforms, Inc. | 0.05 | 0.33 | 34.73 | 28.48 | 2.7263 | 0.4987 | |||
| ZTS / Zoetis Inc. | 0.22 | 28.70 | 34.46 | 21.90 | 2.7050 | 0.3754 | |||
| JPM / JPMorgan Chase & Co. | 0.12 | -1.31 | 34.25 | 16.64 | 2.6881 | 0.2686 | |||
| GOOGL / Alphabet Inc. | 0.19 | -3.30 | 33.70 | 10.20 | 2.6449 | 0.1253 | |||
| AVGO / Broadcom Inc. | 0.12 | 51.74 | 31.84 | 149.83 | 2.4991 | 1.4490 | |||
| PM / Philip Morris International Inc. | 0.16 | -1.63 | 29.35 | 12.87 | 2.3042 | 0.1611 | |||
| QCOM / QUALCOMM Incorporated | 0.18 | -1.38 | 29.30 | 2.25 | 2.2999 | -0.0614 | |||
| TSM / Taiwan Semiconductor Manufacturing Company Limited - Depositary Receipt (Common Stock) | 0.12 | -2.06 | 26.80 | 33.63 | 2.1036 | 0.4510 | |||
| APH / Amphenol Corporation | 0.25 | 0.75 | 24.97 | 51.69 | 1.9599 | 0.6035 | |||
| BX / Blackstone Inc. | 0.16 | 0.20 | 24.54 | 7.23 | 1.9263 | 0.0404 | |||
| C.WSA / Citigroup, Inc. | 0.02 | -1.55 | 22.84 | 9.14 | 1.7932 | 0.0683 | |||
| ABBV / AbbVie Inc. | 0.12 | -1.11 | 22.18 | -12.39 | 1.7411 | -0.3453 | |||
| LLY / Eli Lilly and Company | 0.03 | 5.09 | 22.13 | -0.82 | 1.7375 | -0.1015 | |||
| ACN / Accenture plc | 0.07 | -1.79 | 22.01 | -5.93 | 1.7277 | -0.2004 | |||
| WSM / Williams-Sonoma, Inc. | 0.13 | -1.52 | 21.61 | 1.77 | 1.6961 | -0.0535 | |||
| FAST / Fastenal Company | 0.51 | 96.94 | 21.27 | 6.66 | 1.6696 | 0.0263 | |||
| AMGN / Amgen Inc. | 0.07 | -1.25 | 19.81 | -11.50 | 1.5551 | -0.2895 | |||
| CNI / Canadian National Railway Company | 0.19 | 19.25 | 19.48 | 27.30 | 1.5290 | 0.2681 | |||
| ETN / Eaton Corporation plc | 0.05 | 0.74 | 19.46 | 32.30 | 1.5274 | 0.3155 | |||
| ADBE / Adobe Inc. | 0.05 | -3.07 | 18.31 | -2.23 | 1.4374 | -0.1059 | |||
| JNJ / Johnson & Johnson | 0.11 | -2.00 | 17.51 | -9.73 | 1.3741 | -0.2239 | |||
| UBER / Uber Technologies, Inc. | 0.19 | 0.35 | 17.39 | 28.50 | 1.3652 | 0.2499 | |||
| MDLZ / Mondelez International, Inc. | 0.25 | -0.33 | 16.87 | -0.93 | 1.3243 | -0.0790 | |||
| UNH / UnitedHealth Group Incorporated | 0.05 | -49.34 | 16.77 | -69.83 | 1.3167 | -3.2644 | |||
| AAPL / Apple Inc. | 0.08 | -48.42 | 15.71 | -52.36 | 1.2328 | -1.4837 | |||
| HD / The Home Depot, Inc. | 0.04 | -1.05 | 15.32 | -1.01 | 1.2025 | -0.0727 | |||
| MCD / McDonald's Corporation | 0.05 | -0.92 | 15.02 | -7.33 | 1.1793 | -0.1566 | |||
| DIS / The Walt Disney Company | 0.12 | 0.19 | 14.87 | 25.88 | 1.1672 | 0.1938 | |||
| USB / U.S. Bancorp | 0.32 | -2.54 | 14.64 | 4.45 | 1.1495 | -0.0058 | |||
| PEP / PepsiCo, Inc. | 0.11 | -1.81 | 14.17 | -13.53 | 1.1125 | -0.2381 | |||
| CVX / Chevron Corporation | 0.10 | -0.98 | 13.90 | -15.24 | 1.0908 | -0.2603 | |||
| ITW / Illinois Tool Works Inc. | 0.06 | -1.06 | 13.80 | -1.36 | 1.0836 | -0.0697 | |||
| NFLX / Netflix, Inc. | 0.01 | -15.02 | 12.88 | 22.03 | 1.0108 | 0.1412 | |||
| INTU / Intuit Inc. | 0.02 | 0.00 | 12.05 | 28.28 | 0.9462 | 0.1719 | |||
| PAYX / Paychex, Inc. | 0.08 | 16.41 | 11.70 | 9.76 | 0.9182 | 0.0399 | |||
| CDNS / Cadence Design Systems, Inc. | 0.04 | 74.08 | 11.25 | 110.93 | 0.8832 | 0.4436 | |||
| GOOG / Alphabet Inc. | 0.06 | -1.69 | 11.22 | 11.63 | 0.8810 | 0.0525 | |||
| MSCI / MSCI Inc. | 0.02 | 0.33 | 10.08 | 2.32 | 0.7912 | -0.0205 | |||
| SNPS / Synopsys, Inc. | 0.02 | -39.74 | 9.73 | -27.96 | 0.7638 | -0.3493 | |||
| ABNB / Airbnb, Inc. | 0.05 | -44.41 | 6.51 | -38.41 | 0.5112 | -0.3602 | |||
| ISRG / Intuitive Surgical, Inc. | 0.01 | 0.00 | 6.30 | 9.71 | 0.4948 | 0.0214 | |||
| WDAY / Workday, Inc. | 0.03 | 49.14 | 6.26 | 53.30 | 0.4917 | 0.1549 | |||
| QQQ / Invesco QQQ Trust, Series 1 | 0.00 | 0.00 | 0.48 | 17.56 | 0.0379 | 0.0041 | |||
| TMO / Thermo Fisher Scientific Inc. | 0.00 | -8.14 | 0.36 | -25.26 | 0.0284 | -0.0114 | |||
| SYK / Stryker Corporation | 0.00 | 0.00 | 0.35 | 6.42 | 0.0273 | 0.0003 | |||
| ICE / Intercontinental Exchange, Inc. | 0.00 | 0.00 | 0.31 | 6.14 | 0.0245 | 0.0003 | |||
| MRK / Merck & Co., Inc. | 0.00 | -10.30 | 0.29 | -20.92 | 0.0229 | -0.0075 | |||
| AZN / AstraZeneca PLC - Depositary Receipt (Common Stock) | 0.00 | 0.00 | 0.27 | -4.96 | 0.0211 | -0.0022 | |||
| TXN / Texas Instruments Incorporated | 0.00 | 0.00 | 0.26 | 15.35 | 0.0207 | 0.0019 | |||
| XLV / The Select Sector SPDR Trust - The Health Care Select Sector SPDR Fund | 0.00 | 0.00 | 0.25 | -7.66 | 0.0199 | -0.0027 | |||
| VO / Vanguard Index Funds - Vanguard Mid-Cap ETF | 0.00 | 0.00 | 0.25 | 8.26 | 0.0195 | 0.0006 | |||
| SCHW / The Charles Schwab Corporation | 0.00 | 0.24 | 0.0189 | 0.0189 | |||||
| PRF / Invesco Exchange-Traded Fund Trust - Invesco RAFI US 1000 ETF | 0.01 | 0.00 | 0.23 | 4.50 | 0.0182 | -0.0001 | |||
| ADSK / Autodesk, Inc. | 0.00 | -17.00 | 0.22 | -1.82 | 0.0170 | -0.0012 | |||
| PAAS / Pan American Silver Corp. | 0.01 | 0.21 | 0.0165 | 0.0165 | |||||
| AEM / Agnico Eagle Mines Limited | 0.00 | 0.21 | 0.0161 | 0.0161 | |||||
| UPS / United Parcel Service, Inc. | 0.00 | -100.00 | 0.00 | 0.0000 | |||||
| CMCSA / Comcast Corporation | 0.00 | -100.00 | 0.00 | 0.0000 | |||||
| STZ / Constellation Brands, Inc. | 0.00 | -100.00 | 0.00 | 0.0000 |