Mga Batayang Estadistika
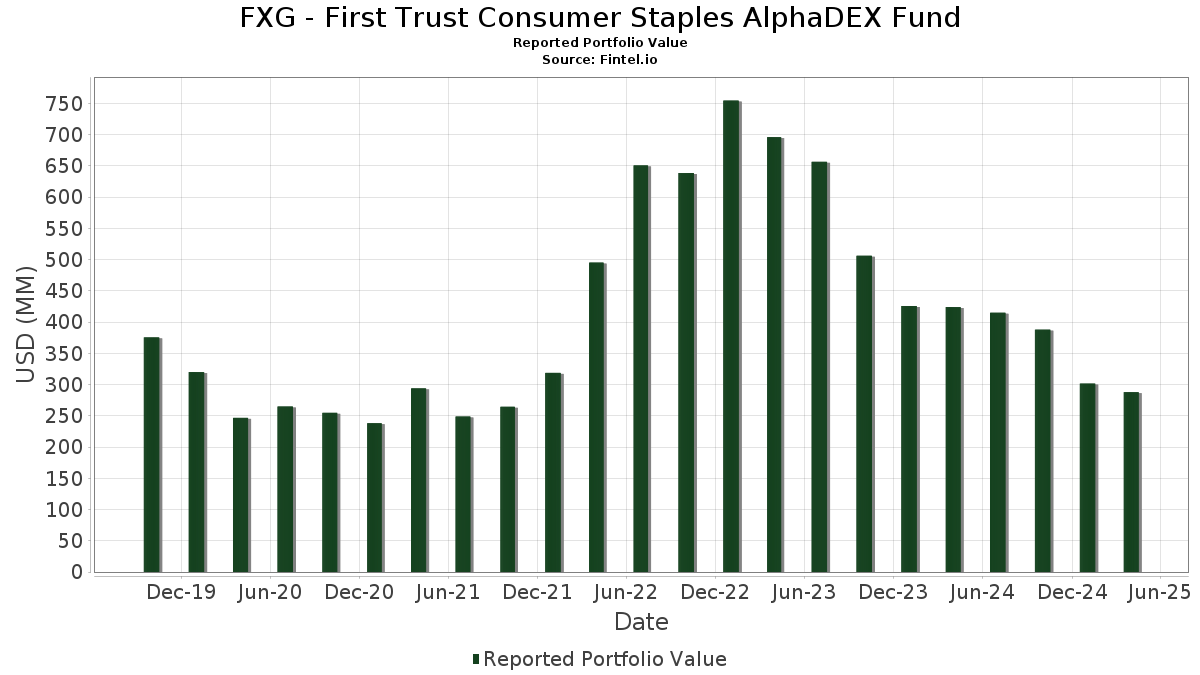
| Nilai Portofolio | $ 287,779,580 |
| Posisi Saat Ini | 41 |
Kepemilikan Terbaru, Kinerja, AUM (dari 13F, 13D)
FXG - First Trust Consumer Staples AlphaDEX Fund telah mengungkapkan total kepemilikan 41 dalam pengajuan SEC terbaru mereka. Nilai portofolio terbaru dihitung sebesar $ 287,779,580 USD. Aset yang Dikelola (AUM) sebenarnya adalah nilai ini ditambah kas (yang tidak diungkapkan). Aset-aset utama FXG - First Trust Consumer Staples AlphaDEX Fund adalah Pilgrim's Pride Corporation (US:PPC) , McKesson Corporation (US:MCK) , Cencora, Inc. (US:COR) , Casey's General Stores, Inc. (US:CASY) , and Bunge Global SA (CH:CH1300646267) .
Peningkatan Tertinggi Kuartal Ini
Kami menggunakan perubahan dalam alokasi portofolio karena ini adalah metrik yang paling bermakna. Perubahan dapat disebabkan oleh perdagangan atau perubahan harga saham.
| Keamanan | Saham (MM) |
Nilai (Juta Dolar AS) |
Portfolio % | ΔPorsyento ng Portfolio |
|---|---|---|---|---|
| 0.03 | 12.60 | 4.3777 | 1.7529 | |
| 0.07 | 4.85 | 1.6837 | 1.6837 | |
| 0.04 | 12.67 | 4.3993 | 1.6093 | |
| 0.32 | 9.22 | 3.2007 | 1.6034 | |
| 0.22 | 7.49 | 2.6020 | 1.1732 | |
| 0.04 | 7.10 | 2.4661 | 1.0173 | |
| 0.02 | 12.70 | 4.4120 | 0.9807 | |
| 0.08 | 4.89 | 1.6985 | 0.8654 | |
| 0.07 | 2.35 | 0.8160 | 0.8160 | |
| 0.01 | 2.29 | 0.7949 | 0.7949 |
Penurunan Tertinggi Kuartal Ini
Kami menggunakan perubahan dalam alokasi portofolio karena ini adalah metrik yang paling bermakna. Perubahan dapat disebabkan oleh perdagangan atau perubahan harga saham.
| Keamanan | Saham (MM) |
Nilai (Juta Dolar AS) |
Portfolio % | ΔPorsyento ng Portfolio |
|---|---|---|---|---|
| 0.14 | 9.43 | 3.2736 | -1.8973 | |
| 0.09 | 7.31 | 2.5400 | -1.8498 | |
| 0.03 | 2.36 | 0.8188 | -1.5151 | |
| 0.07 | 9.38 | 3.2588 | -0.8175 | |
| 0.16 | 4.67 | 1.6224 | -0.7343 | |
| 0.11 | 7.63 | 2.6514 | -0.6628 | |
| 0.37 | 11.98 | 4.1621 | -0.4076 | |
| 0.13 | 8.52 | 2.9580 | -0.3326 | |
| 0.40 | 9.25 | 3.2143 | -0.1491 | |
| 0.04 | 2.34 | 0.8135 | -0.1284 |
Pengajuan 13F dan Dana
Formulir ini diajukan pada 2025-06-25 untuk periode pelaporan 2025-04-30. Klik ikon tautan untuk melihat riwayat transaksi selengkapnya.
Tingkatkan ke versi premium untuk membuka data premium dan ekspor ke Excel. ![]() .
.
| Keamanan | Ketik | Harga Saham Rata-rata | Saham (MM) |
ΔSaham (%) |
ΔSaham (%) |
Nilai ($MM) |
Portpolyo (%) |
ΔPortofolio (%) |
|
|---|---|---|---|---|---|---|---|---|---|
| PPC / Pilgrim's Pride Corporation | 0.24 | -11.84 | 13.15 | 3.39 | 4.5655 | 0.3515 | |||
| MCK / McKesson Corporation | 0.02 | 2.38 | 12.70 | 22.71 | 4.4120 | 0.9807 | |||
| COR / Cencora, Inc. | 0.04 | 30.70 | 12.67 | 50.48 | 4.3993 | 1.6093 | |||
| CASY / Casey's General Stores, Inc. | 0.03 | 45.11 | 12.60 | 59.16 | 4.3777 | 1.7529 | |||
| CH1300646267 / Bunge Global SA | 0.15 | -3.29 | 12.14 | 0.00 | 4.2165 | 0.1928 | |||
| DAR / Darling Ingredients Inc. | 0.37 | 1.15 | 11.98 | -13.08 | 4.1621 | -0.4076 | |||
| ADM / Archer-Daniels-Midland Company | 0.25 | 1.46 | 11.89 | -5.43 | 4.1301 | -0.0375 | |||
| TAP / Molson Coors Beverage Company | 0.20 | -9.37 | 11.28 | -4.78 | 3.9173 | -0.0083 | |||
| CVS / CVS Health Corporation | 0.14 | -48.85 | 9.43 | -39.59 | 3.2736 | -1.8973 | |||
| INGR / Ingredion Incorporated | 0.07 | -21.63 | 9.38 | -23.71 | 3.2588 | -0.8175 | |||
| TSN / Tyson Foods, Inc. | 0.15 | -11.88 | 9.32 | -4.47 | 3.2371 | 0.0036 | |||
| POST / Post Holdings, Inc. | 0.08 | -5.38 | 9.28 | 0.87 | 3.2231 | 0.1737 | |||
| REYN / Reynolds Consumer Products Inc. | 0.40 | 9.48 | 9.25 | -8.81 | 3.2143 | -0.1491 | |||
| KHC / The Kraft Heinz Company | 0.32 | 96.08 | 9.22 | 91.22 | 3.2007 | 1.6034 | |||
| FLO / Flowers Foods, Inc. | 0.51 | 5.62 | 8.92 | -4.97 | 3.0981 | -0.0131 | |||
| GO / Grocery Outlet Holding Corp. | 0.52 | 9.13 | 8.73 | 13.17 | 3.0330 | 0.4755 | |||
| SPB / Spectrum Brands Holdings, Inc. | 0.13 | 14.96 | 8.52 | -14.21 | 2.9580 | -0.3326 | |||
| KR / The Kroger Co. | 0.11 | -34.83 | 7.63 | -23.65 | 2.6514 | -0.6628 | |||
| BFB / Brown-Forman Corp. - Class B | 0.22 | 64.66 | 7.49 | 73.76 | 2.6020 | 1.1732 | |||
| PFGC / Performance Food Group Company | 0.09 | -38.18 | 7.31 | -44.78 | 2.5400 | -1.8498 | |||
| MO / Altria Group, Inc. | 0.12 | -13.88 | 7.25 | -2.48 | 2.5173 | 0.0542 | |||
| HSY / The Hershey Company | 0.04 | 45.00 | 7.10 | 62.43 | 2.4661 | 1.0173 | |||
| ACI / Albertsons Companies, Inc. | 0.32 | -15.07 | 7.07 | -6.90 | 2.4561 | -0.0613 | |||
| GIS / General Mills, Inc. | 0.12 | 3.39 | 6.84 | -2.45 | 2.3771 | 0.0516 | |||
| MNST / Monster Beverage Corporation | 0.08 | 21.07 | 4.89 | 41.49 | 1.6985 | 0.8654 | |||
| KO / The Coca-Cola Company | 0.07 | 4.85 | 1.6837 | 1.6837 | |||||
| MDLZ / Mondelez International, Inc. | 0.07 | -14.51 | 4.84 | 0.44 | 1.6798 | 0.0838 | |||
| COKE / Coca-Cola Consolidated, Inc. | 0.00 | 75.71 | 4.69 | 74.21 | 1.6283 | 0.7363 | |||
| HRL / Hormel Foods Corporation | 0.16 | -34.13 | 4.67 | -34.30 | 1.6224 | -0.7343 | |||
| SYY / Sysco Corporation | 0.06 | -1.84 | 4.55 | -3.89 | 1.5791 | 0.0112 | |||
| CAG / Conagra Brands, Inc. | 0.18 | 1.01 | 4.46 | -3.59 | 1.5494 | 0.0157 | |||
| KMB / Kimberly-Clark Corporation | 0.03 | 77.41 | 4.42 | 79.91 | 1.5367 | 0.7215 | |||
| SAM / The Boston Beer Company, Inc. | 0.01 | 19.31 | 2.42 | 16.99 | 0.8420 | 0.1552 | |||
| USFD / US Foods Holding Corp. | 0.04 | -1.00 | 2.39 | -8.36 | 0.8299 | -0.0343 | |||
| LW / Lamb Weston Holdings, Inc. | 0.05 | 21.38 | 2.38 | 6.92 | 0.8262 | 0.0889 | |||
| CL / Colgate-Palmolive Company | 0.03 | -73.54 | 2.36 | -73.97 | 0.8188 | -1.5151 | |||
| CELH / Celsius Holdings, Inc. | 0.07 | 2.35 | 0.8160 | 0.8160 | |||||
| CTVA / Corteva, Inc. | 0.04 | -13.22 | 2.34 | -17.56 | 0.8135 | -0.1284 | |||
| PG / The Procter & Gamble Company | 0.01 | 2.29 | 0.7949 | 0.7949 | |||||
| CPB / The Campbell's Company | 0.06 | 1.63 | 2.19 | -4.40 | 0.7621 | 0.0011 | |||
| US61747C5821 / Morgan Stanley Institutional Liquidity Funds - Treasury Portfolio | 0.52 | 206.55 | 0.52 | 206.51 | 0.1799 | 0.1239 |