Mga Batayang Estadistika
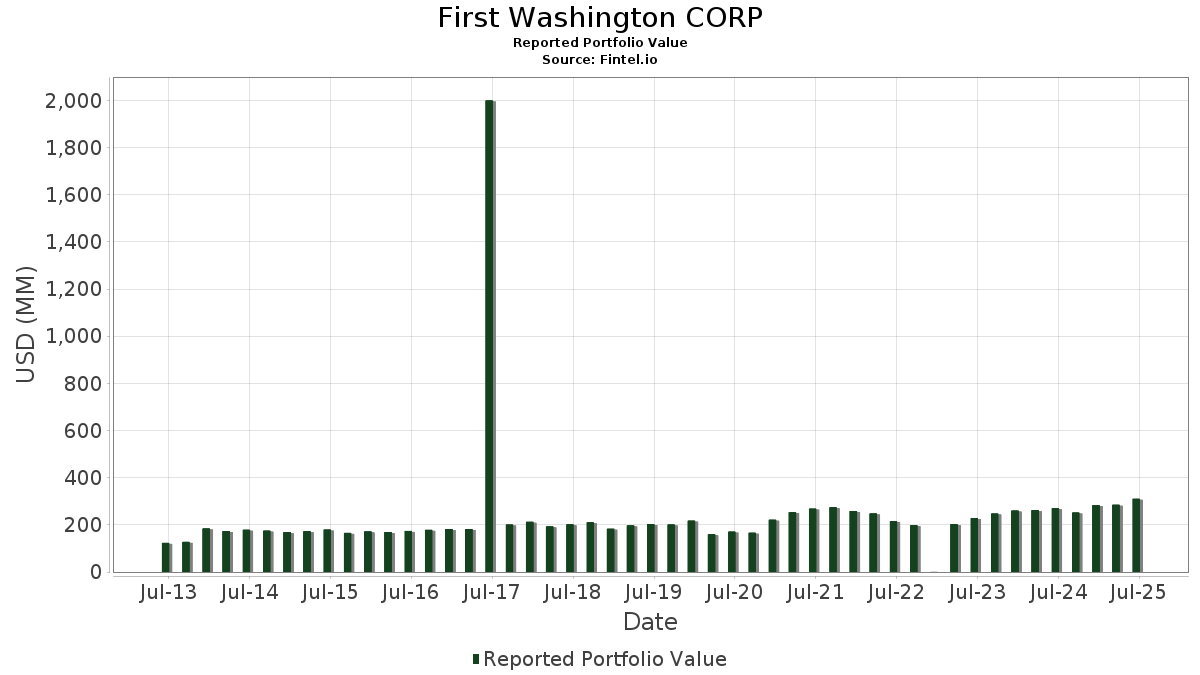
| Nilai Portofolio | $ 310,211,066 |
| Posisi Saat Ini | 53 |
Kepemilikan Terbaru, Kinerja, AUM (dari 13F, 13D)
First Washington CORP telah mengungkapkan total kepemilikan 53 dalam pengajuan SEC terbaru mereka. Nilai portofolio terbaru dihitung sebesar $ 310,211,066 USD. Aset yang Dikelola (AUM) sebenarnya adalah nilai ini ditambah kas (yang tidak diungkapkan). Aset-aset utama First Washington CORP adalah iShares Trust - iShares Core U.S. Aggregate Bond ETF (US:AGG) , PACCAR Inc (US:PCAR) , SPDR S&P 500 ETF (US:SPY) , Microsoft Corporation (US:MSFT) , and Dycom Industries, Inc. (US:DY) .
Peningkatan Tertinggi Kuartal Ini
Kami menggunakan perubahan dalam alokasi portofolio karena ini adalah metrik yang paling bermakna. Perubahan dapat disebabkan oleh perdagangan atau perubahan harga saham.
| Keamanan | Saham (MM) |
Nilai (Juta Dolar AS) |
Portfolio % | ΔPorsyento ng Portfolio |
|---|---|---|---|---|
| 0.39 | 7.75 | 2.4968 | 1.4130 | |
| 0.08 | 7.25 | 2.3386 | 1.1480 | |
| 0.02 | 12.13 | 3.9093 | 1.0359 | |
| 0.03 | 8.26 | 2.6637 | 0.8556 | |
| 0.06 | 4.32 | 1.3937 | 0.6563 | |
| 0.01 | 7.51 | 2.4218 | 0.5962 | |
| 0.04 | 7.20 | 2.3210 | 0.5902 | |
| 0.02 | 10.22 | 3.2956 | 0.5391 | |
| 0.06 | 7.08 | 2.2831 | 0.5107 | |
| 0.04 | 6.95 | 2.2396 | 0.4982 |
Penurunan Tertinggi Kuartal Ini
Kami menggunakan perubahan dalam alokasi portofolio karena ini adalah metrik yang paling bermakna. Perubahan dapat disebabkan oleh perdagangan atau perubahan harga saham.
| Keamanan | Saham (MM) |
Nilai (Juta Dolar AS) |
Portfolio % | ΔPorsyento ng Portfolio |
|---|---|---|---|---|
| 0.37 | 35.26 | 11.3654 | -1.3116 | |
| 0.38 | 38.07 | 12.2722 | -1.0537 | |
| 0.57 | 6.15 | 1.9813 | -0.8317 | |
| 0.01 | 1.35 | 0.4354 | -0.4969 | |
| 0.08 | 5.99 | 1.9295 | -0.3600 | |
| 0.01 | 6.80 | 2.1913 | -0.3369 | |
| 0.17 | 8.23 | 2.6521 | -0.2207 | |
| 0.11 | 4.73 | 1.5245 | -0.2163 | |
| 0.35 | 2.65 | 0.8544 | -0.1587 | |
| 0.02 | 3.10 | 1.0000 | -0.1201 |
Pengajuan 13F dan Dana
Formulir ini diajukan pada 2025-08-12 untuk periode pelaporan 2025-06-30. Klik ikon tautan untuk melihat riwayat transaksi selengkapnya.
Tingkatkan ke versi premium untuk membuka data premium dan ekspor ke Excel. ![]() .
.
| Keamanan | Ketik | Harga Saham Rata-rata | Saham (MM) |
ΔSaham (%) |
ΔSaham (%) |
Nilai ($MM) |
Portpolyo (%) |
ΔPortofolio (%) |
|
|---|---|---|---|---|---|---|---|---|---|
| AGG / iShares Trust - iShares Core U.S. Aggregate Bond ETF | 0.38 | 0.00 | 38.07 | 0.28 | 12.2722 | -1.0537 | |||
| PCAR / PACCAR Inc | 0.37 | 0.00 | 35.26 | -2.37 | 11.3654 | -1.3116 | |||
| SPY / SPDR S&P 500 ETF | 0.02 | 34.14 | 12.13 | 48.16 | 3.9093 | 1.0359 | |||
| MSFT / Microsoft Corporation | 0.02 | -1.74 | 10.22 | 30.20 | 3.2956 | 0.5391 | |||
| DY / Dycom Industries, Inc. | 0.03 | 0.00 | 8.26 | 60.45 | 2.6637 | 0.8556 | |||
| ALK / Alaska Air Group, Inc. | 0.17 | 0.00 | 8.23 | 0.54 | 2.6521 | -0.2207 | |||
| LASR / nLIGHT, Inc. | 0.39 | -0.96 | 7.75 | 150.89 | 2.4968 | 1.4130 | |||
| CRWD / CrowdStrike Holdings, Inc. | 0.01 | 0.00 | 7.51 | 44.46 | 2.4218 | 0.5962 | |||
| GEV / GE Vernova Inc. | 0.01 | -35.65 | 7.31 | 11.55 | 2.3562 | 0.0559 | |||
| MDT / Medtronic plc | 0.08 | 120.48 | 7.25 | 113.92 | 2.3386 | 1.1480 | |||
| MTZ / MasTec, Inc. | 0.04 | 0.00 | 7.20 | 46.02 | 2.3210 | 0.5902 | |||
| LEN / Lennar Corporation | 0.06 | 45.56 | 7.08 | 40.27 | 2.2831 | 0.5107 | |||
| RSP / Invesco Exchange-Traded Fund Trust - Invesco S&P 500 Equal Weight ETF | 0.04 | 33.49 | 6.95 | 40.06 | 2.2396 | 0.4982 | |||
| LLY / Eli Lilly and Company | 0.01 | 0.00 | 6.80 | -5.61 | 2.1913 | -0.3369 | |||
| GDX / VanEck ETF Trust - VanEck Gold Miners ETF | 0.13 | -0.37 | 6.73 | 12.84 | 2.1709 | 0.0757 | |||
| BAC / Bank of America Corporation | 0.14 | 0.00 | 6.71 | 13.41 | 2.1625 | 0.0859 | |||
| AMZN / Amazon.com, Inc. | 0.03 | 0.00 | 6.47 | 15.32 | 2.0867 | 0.1161 | |||
| ETN / Eaton Corporation plc | 0.02 | 0.00 | 6.35 | 31.33 | 2.0462 | 0.3496 | |||
| COST / Costco Wholesale Corporation | 0.01 | 0.00 | 6.34 | 4.67 | 2.0446 | -0.0825 | |||
| GVA / Granite Construction Incorporated | 0.07 | 0.00 | 6.32 | 24.03 | 2.0380 | 0.2485 | |||
| UBER / Uber Technologies, Inc. | 0.07 | 0.00 | 6.23 | 28.06 | 2.0096 | 0.3007 | |||
| F / Ford Motor Company | 0.57 | -29.10 | 6.15 | -23.30 | 1.9813 | -0.8317 | |||
| DAR / Darling Ingredients Inc. | 0.16 | -0.66 | 6.14 | 20.67 | 1.9800 | 0.1929 | |||
| GEHC / GE HealthCare Technologies Inc. | 0.08 | 0.00 | 5.99 | -8.23 | 1.9295 | -0.3600 | |||
| ICE / Intercontinental Exchange, Inc. | 0.03 | 0.00 | 5.48 | 6.35 | 1.7661 | -0.0421 | |||
| CME / CME Group Inc. | 0.02 | -0.89 | 5.06 | 2.97 | 1.6327 | -0.0939 | |||
| VCEL / Vericel Corporation | 0.11 | 0.00 | 4.73 | -4.64 | 1.5245 | -0.2163 | |||
| AVGO / Broadcom Inc. | 0.02 | 0.00 | 4.52 | 64.65 | 1.4582 | 0.4937 | |||
| ANET / Arista Networks Inc | 0.04 | 10.03 | 4.47 | 45.30 | 1.4413 | 0.3611 | |||
| ZS / Zscaler, Inc. | 0.01 | -23.38 | 4.47 | 21.26 | 1.4397 | 0.1465 | |||
| MRVL / Marvell Technology, Inc. | 0.06 | 63.71 | 4.32 | 105.86 | 1.3937 | 0.6563 | |||
| MU / Micron Technology, Inc. | 0.03 | 0.00 | 4.10 | 41.83 | 1.3216 | 0.3070 | |||
| CBOE / Cboe Global Markets, Inc. | 0.02 | 0.00 | 4.05 | 3.05 | 1.3060 | -0.0740 | |||
| NVDA / NVIDIA Corporation | 0.03 | 0.00 | 4.04 | 45.76 | 1.3031 | 0.3297 | |||
| NDAQ / Nasdaq, Inc. | 0.04 | 0.00 | 3.66 | 17.90 | 1.1809 | 0.0900 | |||
| EQT / EQT Corporation | 0.06 | -0.36 | 3.57 | 8.79 | 1.1496 | -0.0014 | |||
| BABA / Alibaba Group Holding Limited - Depositary Receipt (Common Stock) | 0.03 | 20.80 | 3.46 | 3.60 | 1.1141 | -0.0568 | |||
| ALL / The Allstate Corporation | 0.02 | 0.00 | 3.10 | -2.76 | 1.0000 | -0.1201 | |||
| VKTX / Viking Therapeutics, Inc. | 0.11 | 0.00 | 2.82 | 9.72 | 0.9096 | 0.0069 | |||
| CP / Canadian Pacific Kansas City Limited | 0.03 | 0.00 | 2.66 | 12.88 | 0.8560 | 0.0304 | |||
| CLF / Cleveland-Cliffs Inc. | 0.35 | -0.67 | 2.65 | -8.18 | 0.8544 | -0.1587 | |||
| IGSB / iShares Trust - iShares 1-5 Year Investment Grade Corporate Bond ETF | 0.03 | 0.00 | 1.66 | 0.73 | 0.5344 | -0.0432 | |||
| GOOGL / Alphabet Inc. | 0.01 | -55.37 | 1.35 | -49.17 | 0.4354 | -0.4969 | |||
| GNRC / Generac Holdings Inc. | 0.01 | 0.00 | 1.17 | 13.08 | 0.3765 | 0.0139 | |||
| AAPL / Apple Inc. | 0.01 | -1.55 | 1.11 | -9.09 | 0.3581 | -0.0707 | |||
| DVN / Devon Energy Corporation | 0.03 | -0.78 | 1.04 | -15.58 | 0.3338 | -0.0969 | |||
| QCOM / QUALCOMM Incorporated | 0.01 | 0.00 | 0.84 | 3.69 | 0.2720 | -0.0137 | |||
| MRK / Merck & Co., Inc. | 0.01 | -1.94 | 0.80 | -13.59 | 0.2585 | -0.0670 | |||
| AMD / Advanced Micro Devices, Inc. | 0.00 | 0.00 | 0.53 | 37.96 | 0.1701 | 0.0360 | |||
| BRK.B / Berkshire Hathaway Inc. | 0.00 | 0.00 | 0.32 | -8.96 | 0.1018 | -0.0197 | |||
| Z / Zillow Group, Inc. | 0.00 | -10.00 | 0.32 | -7.89 | 0.1016 | -0.0187 | |||
| TRGP / Targa Resources Corp. | 0.00 | 0.00 | 0.26 | -13.16 | 0.0852 | -0.0217 | |||
| FIX / Comfort Systems USA, Inc. | 0.00 | 0.20 | 0.0650 | 0.0650 | |||||
| CTLP / Cantaloupe, Inc. | 0.00 | -100.00 | 0.00 | 0.0000 | |||||
| TENB / Tenable Holdings, Inc. | 0.00 | -100.00 | 0.00 | 0.0000 | |||||
| QQQ / Invesco QQQ Trust, Series 1 | 0.00 | -100.00 | 0.00 | 0.0000 | |||||
| LSEA / Landsea Homes Corporation | 0.00 | -100.00 | 0.00 | 0.0000 | |||||
| NWN / Northwest Natural Holding Company | 0.00 | -100.00 | 0.00 | 0.0000 |