Mga Batayang Estadistika
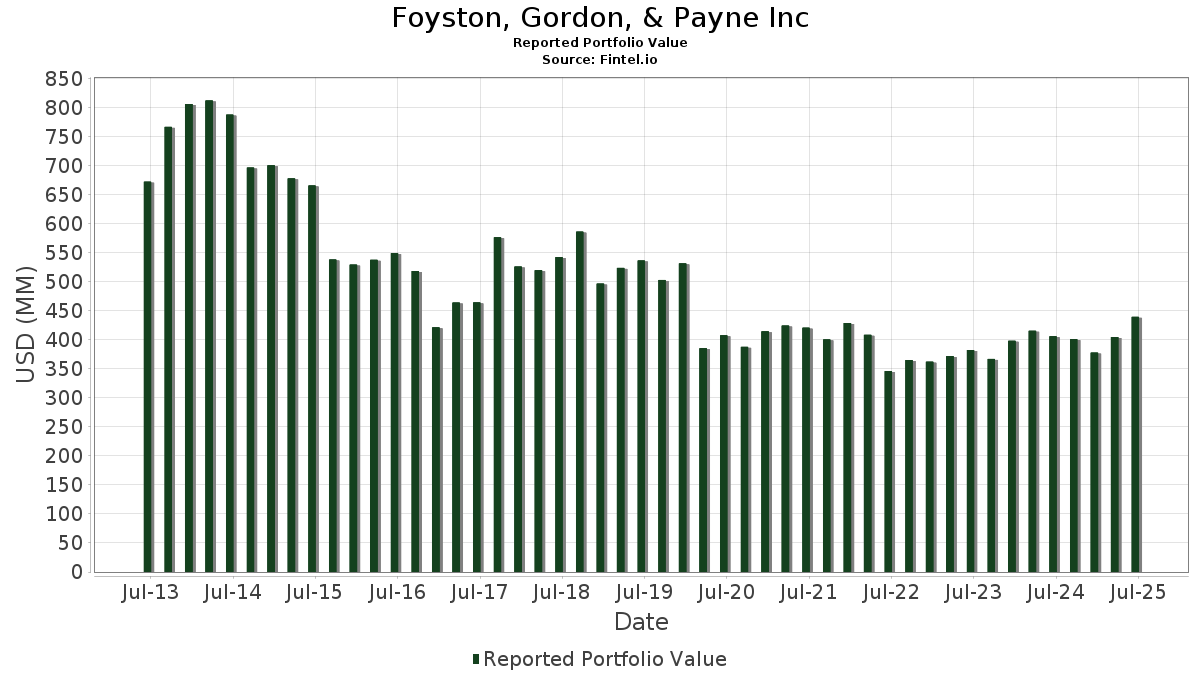
| Nilai Portofolio | $ 439,203,297 |
| Posisi Saat Ini | 53 |
Kepemilikan Terbaru, Kinerja, AUM (dari 13F, 13D)
Foyston, Gordon, & Payne Inc telah mengungkapkan total kepemilikan 53 dalam pengajuan SEC terbaru mereka. Nilai portofolio terbaru dihitung sebesar $ 439,203,297 USD. Aset yang Dikelola (AUM) sebenarnya adalah nilai ini ditambah kas (yang tidak diungkapkan). Aset-aset utama Foyston, Gordon, & Payne Inc adalah Microsoft Corporation (US:MSFT) , Philip Morris International Inc. (US:PM) , Meta Platforms, Inc. (US:META) , Broadcom Inc. (US:AVGO) , and Fiserv, Inc. (US:FI) . Posisi baru Foyston, Gordon, & Payne Inc meliputi: RTX Corporation (US:RTX) , .
Peningkatan Tertinggi Kuartal Ini
Kami menggunakan perubahan dalam alokasi portofolio karena ini adalah metrik yang paling bermakna. Perubahan dapat disebabkan oleh perdagangan atau perubahan harga saham.
| Keamanan | Saham (MM) |
Nilai (Juta Dolar AS) |
Portfolio % | ΔPorsyento ng Portfolio |
|---|---|---|---|---|
| 0.10 | 27.07 | 6.1629 | 2.0250 | |
| 0.07 | 37.14 | 8.4566 | 1.7881 | |
| 0.04 | 28.72 | 6.5381 | 1.2591 | |
| 0.05 | 17.44 | 3.9704 | 0.9003 | |
| 0.04 | 7.19 | 1.6377 | 0.6252 | |
| 0.12 | 21.55 | 4.9076 | 0.5096 | |
| 0.15 | 13.61 | 3.0993 | 0.3789 | |
| 0.08 | 11.52 | 2.6233 | 0.2064 | |
| 0.03 | 3.26 | 0.7412 | 0.1426 | |
| 0.06 | 10.25 | 2.3331 | 0.1170 |
Penurunan Tertinggi Kuartal Ini
Kami menggunakan perubahan dalam alokasi portofolio karena ini adalah metrik yang paling bermakna. Perubahan dapat disebabkan oleh perdagangan atau perubahan harga saham.
| Keamanan | Saham (MM) |
Nilai (Juta Dolar AS) |
Portfolio % | ΔPorsyento ng Portfolio |
|---|---|---|---|---|
| 0.05 | 15.19 | 3.4593 | -2.2853 | |
| 0.13 | 21.63 | 4.9259 | -0.9646 | |
| 0.06 | 9.92 | 2.2588 | -0.8039 | |
| 0.06 | 8.67 | 1.9744 | -0.4382 | |
| 0.06 | 12.51 | 2.8483 | -0.4038 | |
| 0.18 | 32.33 | 7.3613 | -0.3825 | |
| 0.02 | 7.93 | 1.8054 | -0.3439 | |
| 0.04 | 18.40 | 4.1905 | -0.3253 | |
| 0.04 | 6.17 | 1.4050 | -0.2513 | |
| 0.12 | 5.31 | 1.2080 | -0.2218 |
Pengajuan 13F dan Dana
Formulir ini diajukan pada 2025-08-13 untuk periode pelaporan 2025-06-30. Klik ikon tautan untuk melihat riwayat transaksi selengkapnya.
Tingkatkan ke versi premium untuk membuka data premium dan ekspor ke Excel. ![]() .
.
| Keamanan | Ketik | Harga Saham Rata-rata | Saham (MM) |
ΔSaham (%) |
ΔSaham (%) |
Nilai ($MM) |
Portpolyo (%) |
ΔPortofolio (%) |
|
|---|---|---|---|---|---|---|---|---|---|
| MSFT / Microsoft Corporation | 0.07 | 3.92 | 37.14 | 37.70 | 8.4566 | 1.7881 | |||
| PM / Philip Morris International Inc. | 0.18 | -10.04 | 32.33 | 3.22 | 7.3613 | -0.3825 | |||
| META / Meta Platforms, Inc. | 0.04 | 5.02 | 28.72 | 34.48 | 6.5381 | 1.2591 | |||
| AVGO / Broadcom Inc. | 0.10 | -1.77 | 27.07 | 61.73 | 6.1629 | 2.0250 | |||
| FI / Fiserv, Inc. | 0.13 | 16.31 | 21.63 | -9.20 | 4.9259 | -0.9646 | |||
| GOOGL / Alphabet Inc. | 0.12 | 6.32 | 21.55 | 21.16 | 4.9076 | 0.5096 | |||
| MSI / Motorola Solutions, Inc. | 0.04 | 4.92 | 18.40 | 0.76 | 4.1905 | -0.3253 | |||
| AXP / American Express Company | 0.05 | 18.44 | 17.44 | 40.42 | 3.9704 | 0.9003 | |||
| UNH / UnitedHealth Group Incorporated | 0.05 | 9.78 | 15.19 | -34.61 | 3.4593 | -2.2853 | |||
| BKNG / Booking Holdings Inc. | 0.00 | -16.76 | 14.95 | 4.60 | 3.4034 | -0.1297 | |||
| SEIC / SEI Investments Company | 0.15 | 6.87 | 13.61 | 23.71 | 3.0993 | 0.3789 | |||
| MMC / Marsh & McLennan Companies, Inc. | 0.06 | 6.15 | 12.51 | -4.90 | 2.8483 | -0.4038 | |||
| ALLE / Allegion plc | 0.08 | 6.69 | 11.52 | 17.86 | 2.6233 | 0.2064 | |||
| ALSN / Allison Transmission Holdings, Inc. | 0.11 | 6.66 | 10.51 | 5.90 | 2.3921 | -0.0607 | |||
| KEYS / Keysight Technologies, Inc. | 0.06 | 4.49 | 10.25 | 14.33 | 2.3331 | 0.1170 | |||
| BDX / Becton, Dickinson and Company | 0.06 | 6.49 | 9.92 | -19.92 | 2.2588 | -0.8039 | |||
| ICLR / ICON Public Limited Company | 0.06 | 6.91 | 8.67 | -11.14 | 1.9744 | -0.4382 | |||
| HSIC / Henry Schein, Inc. | 0.11 | 5.45 | 8.32 | 12.47 | 1.8932 | 0.0654 | |||
| BRK.B / Berkshire Hathaway Inc. | 0.02 | 0.00 | 7.93 | -8.79 | 1.8054 | -0.3439 | |||
| MDLZ / Mondelez International, Inc. | 0.12 | 0.74 | 7.79 | 0.13 | 1.7735 | -0.1497 | |||
| GWW / W.W. Grainger, Inc. | 0.01 | 4.61 | 7.35 | 10.17 | 1.6726 | 0.0239 | |||
| CDW / CDW Corporation | 0.04 | 57.61 | 7.19 | 75.63 | 1.6377 | 0.6252 | |||
| KO / The Coca-Cola Company | 0.09 | 0.00 | 6.63 | -1.22 | 1.5097 | -0.1498 | |||
| JNJ / Johnson & Johnson | 0.04 | 0.00 | 6.17 | -7.90 | 1.4050 | -0.2513 | |||
| V / Visa Inc. | 0.02 | 0.85 | 6.08 | 2.17 | 1.3833 | -0.0868 | |||
| WMT / Walmart Inc. | 0.06 | 0.00 | 5.85 | 11.38 | 1.3324 | 0.0334 | |||
| OTIS / Otis Worldwide Corporation | 0.06 | 0.84 | 5.63 | -3.25 | 1.2812 | -0.1567 | |||
| ROST / Ross Stores, Inc. | 0.04 | 4.42 | 5.59 | 4.25 | 1.2738 | -0.0530 | |||
| G / Genpact Limited | 0.12 | 5.02 | 5.31 | -8.27 | 1.2080 | -0.2218 | |||
| EA / Electronic Arts Inc. | 0.03 | 8.33 | 4.95 | 19.71 | 1.1272 | 0.1047 | |||
| WTW / Willis Towers Watson Public Limited Company | 0.02 | -0.30 | 4.74 | -9.58 | 1.0791 | -0.2167 | |||
| CME / CME Group Inc. | 0.02 | 1.04 | 4.24 | 4.97 | 0.9660 | -0.0332 | |||
| AOS / A. O. Smith Corporation | 0.06 | 1.82 | 4.05 | 2.14 | 0.9227 | -0.0582 | |||
| LHX / L3Harris Technologies, Inc. | 0.01 | 0.52 | 3.67 | 20.46 | 0.8352 | 0.0824 | |||
| WEX / WEX Inc. | 0.02 | 4.83 | 3.27 | -1.95 | 0.7442 | -0.0798 | |||
| LRCX / Lam Research Corporation | 0.03 | 0.42 | 3.26 | 34.45 | 0.7412 | 0.1426 | |||
| UNP / Union Pacific Corporation | 0.01 | 1.13 | 2.33 | -1.52 | 0.5307 | -0.0544 | |||
| ABBV / AbbVie Inc. | 0.01 | 0.00 | 2.26 | -11.42 | 0.5156 | -0.1163 | |||
| SONY / Sony Group Corporation - Depositary Receipt (Common Stock) | 0.09 | -0.71 | 2.25 | 1.77 | 0.5116 | -0.0341 | |||
| RTX / RTX Corporation | 0.01 | 2.17 | 0.0000 | ||||||
| EXPE / Expedia Group, Inc. | 0.01 | 5.02 | 2.13 | 5.35 | 0.4847 | -0.0147 | |||
| ABT / Abbott Laboratories | 0.01 | 0.00 | 1.66 | 2.53 | 0.3778 | -0.0223 | |||
| KVUE / Kenvue Inc. | 0.06 | -0.05 | 1.31 | -12.79 | 0.2982 | -0.0730 | |||
| NVS / Novartis AG - Depositary Receipt (Common Stock) | 0.01 | -1.29 | 1.30 | 7.10 | 0.2957 | -0.0040 | |||
| HL / Hecla Mining Company | 0.18 | 67.03 | 1.10 | 79.90 | 0.2508 | 0.0995 | |||
| PG / The Procter & Gamble Company | 0.00 | 0.00 | 0.56 | -6.49 | 0.1281 | -0.0207 | |||
| LECO / Lincoln Electric Holdings, Inc. | 0.00 | 24.24 | 0.53 | 36.32 | 0.1215 | 0.0246 | |||
| KHC / The Kraft Heinz Company | 0.02 | 0.00 | 0.48 | -15.18 | 0.1083 | -0.0303 | |||
| EXP / Eagle Materials Inc. | 0.00 | 67.79 | 0.40 | 52.85 | 0.0916 | 0.0265 | |||
| AX / Axos Financial, Inc. | 0.00 | 22.04 | 0.35 | 43.75 | 0.0786 | 0.0193 | |||
| XOM / Exxon Mobil Corporation | 0.00 | 0.00 | 0.34 | -9.26 | 0.0781 | -0.0155 | |||
| SPNS / Sapiens International Corporation N.V. | 0.01 | 21.21 | 0.33 | 31.10 | 0.0759 | 0.0129 | |||
| SNY / Sanofi - Depositary Receipt (Common Stock) | 0.01 | -1.34 | 0.27 | -14.01 | 0.0616 | -0.0162 | |||
| NEM / Newmont Corporation | 0.00 | -100.00 | 0.00 | 0.0000 | |||||
| NSP / Insperity, Inc. | 0.00 | -100.00 | 0.00 | 0.0000 | |||||
| SKX / Skechers U.S.A., Inc. | 0.00 | -100.00 | 0.00 | 0.0000 | |||||
| UL / Unilever PLC - Depositary Receipt (Common Stock) | 0.00 | -100.00 | 0.00 | 0.0000 |