Mga Batayang Estadistika
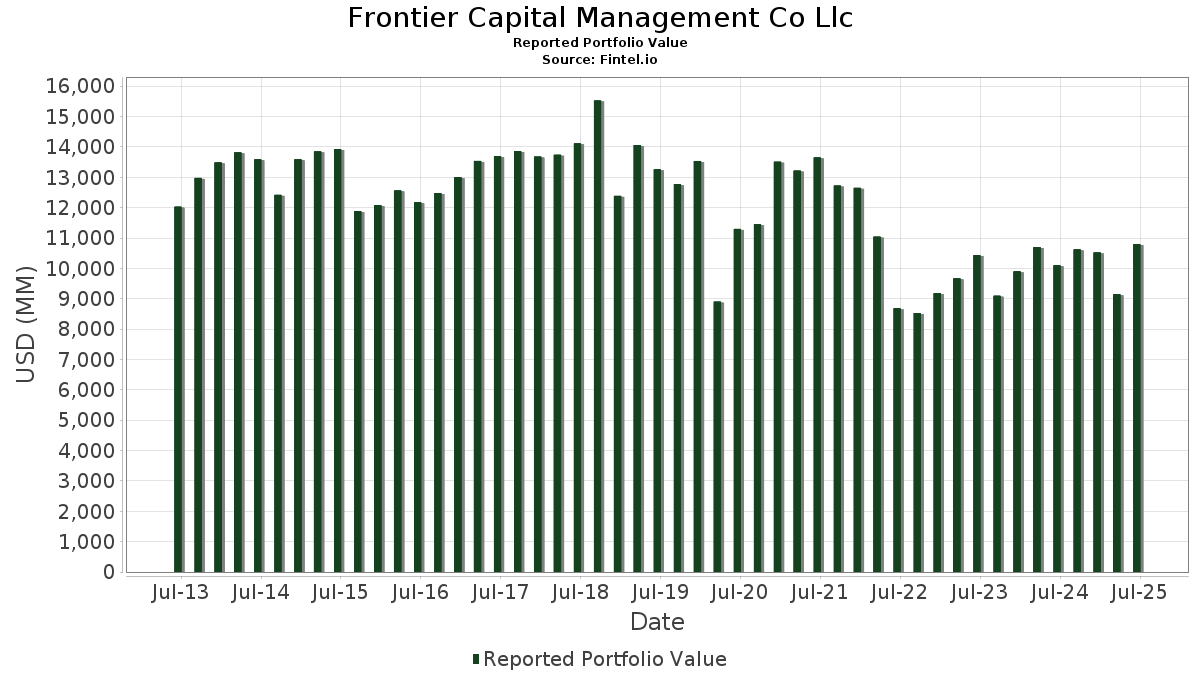
| Nilai Portofolio | $ 10,801,284,212 |
| Posisi Saat Ini | 294 |
Kepemilikan Terbaru, Kinerja, AUM (dari 13F, 13D)
Frontier Capital Management Co Llc telah mengungkapkan total kepemilikan 294 dalam pengajuan SEC terbaru mereka. Nilai portofolio terbaru dihitung sebesar $ 10,801,284,212 USD. Aset yang Dikelola (AUM) sebenarnya adalah nilai ini ditambah kas (yang tidak diungkapkan). Aset-aset utama Frontier Capital Management Co Llc adalah FTAI Aviation Ltd. (US:FTAI) , ATI Inc. (US:ATI) , Mattel, Inc. (US:MAT) , Eagle Materials Inc. (US:EXP) , and XPO, Inc. (US:XPO) . Posisi baru Frontier Capital Management Co Llc meliputi: Roblox Corporation (US:RBLX) , Vistra Corp. (US:VST) , First American Financial Corporation (US:FAF) , APi Group Corporation (US:APG) , and RBC Bearings Incorporated (US:RBC) .
Peningkatan Tertinggi Kuartal Ini
Kami menggunakan perubahan dalam alokasi portofolio karena ini adalah metrik yang paling bermakna. Perubahan dapat disebabkan oleh perdagangan atau perubahan harga saham.
| Keamanan | Saham (MM) |
Nilai (Juta Dolar AS) |
Portfolio % | ΔPorsyento ng Portfolio |
|---|---|---|---|---|
| 0.64 | 67.65 | 0.6263 | 0.6263 | |
| 0.33 | 63.87 | 0.5913 | 0.5913 | |
| 1.28 | 96.30 | 0.8916 | 0.5627 | |
| 0.91 | 90.65 | 0.8393 | 0.5148 | |
| 0.27 | 53.41 | 0.4945 | 0.4897 | |
| 3.32 | 126.09 | 1.1674 | 0.4833 | |
| 5.46 | 128.93 | 1.1936 | 0.4814 | |
| 4.68 | 51.76 | 0.4792 | 0.4792 | |
| 0.59 | 53.02 | 0.4909 | 0.4499 | |
| 0.78 | 47.60 | 0.4407 | 0.4407 |
Penurunan Tertinggi Kuartal Ini
Kami menggunakan perubahan dalam alokasi portofolio karena ini adalah metrik yang paling bermakna. Perubahan dapat disebabkan oleh perdagangan atau perubahan harga saham.
| Keamanan | Saham (MM) |
Nilai (Juta Dolar AS) |
Portfolio % | ΔPorsyento ng Portfolio |
|---|---|---|---|---|
| 1.59 | 45.22 | 0.4186 | -0.6226 | |
| 0.20 | 57.06 | 0.5283 | -0.5296 | |
| 0.36 | 49.06 | 0.4543 | -0.4946 | |
| 1.89 | 97.00 | 0.8980 | -0.3574 | |
| 0.28 | 21.56 | 0.1996 | -0.3426 | |
| 0.08 | 3.55 | 0.0329 | -0.3321 | |
| 0.15 | 14.87 | 0.1377 | -0.3274 | |
| 0.80 | 38.45 | 0.3560 | -0.3251 | |
| 0.71 | 33.07 | 0.3062 | -0.3119 | |
| 0.50 | 11.53 | 0.1067 | -0.2914 |
Pengajuan 13F dan Dana
Formulir ini diajukan pada 2025-08-14 untuk periode pelaporan 2025-06-30. Klik ikon tautan untuk melihat riwayat transaksi selengkapnya.
Tingkatkan ke versi premium untuk membuka data premium dan ekspor ke Excel. ![]() .
.
| Keamanan | Ketik | Harga Saham Rata-rata | Saham (MM) |
ΔSaham (%) |
ΔSaham (%) |
Nilai ($MM) |
Portpolyo (%) |
ΔPortofolio (%) |
|
|---|---|---|---|---|---|---|---|---|---|
| FTAI / FTAI Aviation Ltd. | 2.14 | 5.89 | 246.72 | 9.71 | 2.2842 | -0.1749 | |||
| ATI / ATI Inc. | 2.23 | -14.47 | 192.17 | 41.93 | 1.7791 | 0.2986 | |||
| MAT / Mattel, Inc. | 8.98 | 0.63 | 177.09 | 2.13 | 1.6395 | -0.2566 | |||
| EXP / Eagle Materials Inc. | 0.83 | 35.97 | 167.81 | 23.82 | 1.5536 | 0.0717 | |||
| XPO / XPO, Inc. | 1.13 | -4.00 | 143.20 | 12.70 | 1.3257 | -0.0637 | |||
| AMTM / Amentum Holdings, Inc. | 5.46 | 52.59 | 128.93 | 97.95 | 1.1936 | 0.4814 | |||
| GVA / Granite Construction Incorporated | 1.37 | 14.35 | 128.11 | 41.81 | 1.1861 | 0.1982 | |||
| DAR / Darling Ingredients Inc. | 3.32 | 65.95 | 126.09 | 101.55 | 1.1674 | 0.4833 | |||
| SANM / Sanmina Corporation | 1.23 | 20.91 | 120.52 | 55.27 | 1.1157 | 0.2670 | |||
| BPOP / Popular, Inc. | 1.08 | 13.99 | 119.25 | 36.01 | 1.1040 | 0.1453 | |||
| LNG / Cheniere Energy, Inc. | 0.42 | -0.58 | 101.55 | 4.63 | 0.9402 | -0.1211 | |||
| MPWR / Monolithic Power Systems, Inc. | 0.13 | 3.20 | 97.16 | 30.14 | 0.8995 | 0.0832 | |||
| CG / The Carlyle Group Inc. | 1.89 | -28.35 | 97.00 | -15.51 | 0.8980 | -0.3574 | |||
| SIMO / Silicon Motion Technology Corporation - Depositary Receipt (Common Stock) | 1.28 | 115.37 | 96.30 | 220.20 | 0.8916 | 0.5627 | |||
| DLB / Dolby Laboratories, Inc. | 1.24 | 2.34 | 91.91 | -5.37 | 0.8509 | -0.2112 | |||
| TWLO / Twilio Inc. | 0.73 | -3.64 | 90.93 | 22.39 | 0.8418 | 0.0294 | |||
| MKSI / MKS Inc. | 0.91 | 146.40 | 90.65 | 205.46 | 0.8393 | 0.5148 | |||
| CRS / Carpenter Technology Corporation | 0.33 | -1.26 | 90.09 | 50.62 | 0.8340 | 0.1800 | |||
| INSP / Inspire Medical Systems, Inc. | 0.69 | 59.91 | 89.96 | 30.29 | 0.8328 | 0.0778 | |||
| VRT / Vertiv Holdings Co | 0.69 | 13.76 | 88.69 | 102.32 | 0.8211 | 0.3418 | |||
| XYZ / Block, Inc. | 1.30 | 6.14 | 88.08 | 32.71 | 0.8155 | 0.0897 | |||
| DXCM / DexCom, Inc. | 0.93 | -3.71 | 81.39 | 23.08 | 0.7535 | 0.0304 | |||
| ALGM / Allegro MicroSystems, Inc. | 2.37 | -18.69 | 80.89 | 10.63 | 0.7489 | -0.0507 | |||
| MDB / MongoDB, Inc. | 0.37 | -23.68 | 77.55 | -8.63 | 0.7179 | -0.2101 | |||
| KNX / Knight-Swift Transportation Holdings Inc. | 1.73 | 3.45 | 76.33 | 5.21 | 0.7066 | -0.0866 | |||
| ADC / Agree Realty Corporation | 1.04 | -0.65 | 75.78 | -5.97 | 0.7016 | -0.1796 | |||
| RRX / Regal Rexnord Corporation | 0.52 | 50.37 | 75.09 | 91.46 | 0.6952 | 0.2663 | |||
| EPRT / Essential Properties Realty Trust, Inc. | 2.21 | 12.27 | 70.67 | 9.76 | 0.6543 | -0.0498 | |||
| BLDR / Builders FirstSource, Inc. | 0.60 | -4.36 | 70.15 | -10.68 | 0.6495 | -0.2093 | |||
| VEEV / Veeva Systems Inc. | 0.24 | -12.31 | 68.46 | 9.02 | 0.6339 | -0.0529 | |||
| PWR / Quanta Services, Inc. | 0.18 | -10.37 | 67.66 | 33.32 | 0.6264 | 0.0715 | |||
| RBLX / Roblox Corporation | 0.64 | 67.65 | 0.6263 | 0.6263 | |||||
| AON / Aon plc | 0.19 | 4.40 | 66.66 | -6.67 | 0.6171 | -0.1639 | |||
| JBL / Jabil Inc. | 0.30 | -15.15 | 65.93 | 36.01 | 0.6104 | 0.0803 | |||
| COHR / Coherent Corp. | 0.73 | 142.47 | 65.05 | 233.11 | 0.6022 | 0.3887 | |||
| NTRA / Natera, Inc. | 0.38 | -3.44 | 65.04 | 15.36 | 0.6021 | -0.0144 | |||
| BFAM / Bright Horizons Family Solutions Inc. | 0.52 | -11.49 | 64.71 | -13.89 | 0.5991 | -0.2226 | |||
| WTFC / Wintrust Financial Corporation | 0.52 | -4.57 | 64.03 | 5.21 | 0.5928 | -0.0727 | |||
| INDI / indie Semiconductor, Inc. | 17.96 | 29.95 | 63.94 | 127.33 | 0.5920 | 0.2844 | |||
| ZS / Zscaler, Inc. | 0.20 | -37.57 | 63.91 | -1.23 | 0.5917 | -0.1158 | |||
| VST / Vistra Corp. | 0.33 | 63.87 | 0.5913 | 0.5913 | |||||
| FR / First Industrial Realty Trust, Inc. | 1.31 | -6.99 | 63.24 | -17.04 | 0.5855 | -0.2480 | |||
| LTH / Life Time Group Holdings, Inc. | 2.06 | 19.00 | 62.62 | 19.51 | 0.5797 | 0.0068 | |||
| UCTT / Ultra Clean Holdings, Inc. | 2.75 | 41.54 | 62.16 | 49.21 | 0.5755 | 0.1199 | |||
| IRT / Independence Realty Trust, Inc. | 3.48 | 2.78 | 61.63 | -14.36 | 0.5706 | -0.2163 | |||
| TRU / TransUnion | 0.70 | 3.39 | 61.49 | 9.63 | 0.5693 | -0.0441 | |||
| MRC / MRC Global Inc. | 4.45 | -21.49 | 61.05 | -6.24 | 0.5652 | -0.1468 | |||
| FBP / First BanCorp. | 2.91 | -4.63 | 60.64 | 3.63 | 0.5614 | -0.0785 | |||
| FICO / Fair Isaac Corporation | 0.03 | -10.17 | 60.63 | -10.96 | 0.5614 | -0.1833 | |||
| APP / AppLovin Corporation | 0.17 | -33.41 | 60.35 | -12.02 | 0.5588 | -0.1914 | |||
| BURL / Burlington Stores, Inc. | 0.26 | -4.32 | 60.20 | -6.61 | 0.5573 | -0.1475 | |||
| DKNG / DraftKings Inc. | 1.40 | 10.29 | 60.11 | 42.44 | 0.5565 | 0.0950 | |||
| SILA / Sila Realty Trust, Inc. | 2.53 | 8.72 | 59.91 | -3.66 | 0.5547 | -0.1253 | |||
| FTNT / Fortinet, Inc. | 0.57 | -18.90 | 59.78 | -10.93 | 0.5535 | -0.1805 | |||
| HUBS / HubSpot, Inc. | 0.11 | -15.44 | 59.65 | -17.61 | 0.5523 | -0.2395 | |||
| DBRG / DigitalBridge Group, Inc. | 5.67 | 29.82 | 58.68 | 52.34 | 0.5432 | 0.1220 | |||
| IDXX / IDEXX Laboratories, Inc. | 0.11 | -5.91 | 58.50 | 20.17 | 0.5416 | 0.0093 | |||
| PNFP / Pinnacle Financial Partners, Inc. | 0.53 | -1.55 | 58.41 | 2.51 | 0.5407 | -0.0823 | |||
| STE / STERIS plc | 0.24 | -5.45 | 57.98 | 0.21 | 0.5368 | -0.0959 | |||
| STAG / STAG Industrial, Inc. | 1.59 | 24.30 | 57.63 | 24.86 | 0.5335 | 0.0288 | |||
| PRDO / Perdoceo Education Corporation | 1.75 | 1.98 | 57.29 | 32.39 | 0.5304 | 0.0572 | |||
| UTHR / United Therapeutics Corporation | 0.20 | -36.72 | 57.06 | -41.02 | 0.5283 | -0.5296 | |||
| TKR / The Timken Company | 0.77 | 33.09 | 55.63 | 34.35 | 0.5150 | 0.0622 | |||
| PR / Permian Resources Corporation | 4.04 | 4.92 | 55.07 | 3.18 | 0.5098 | -0.0738 | |||
| PGY / Pagaya Technologies Ltd. | 2.57 | -36.59 | 54.89 | 29.00 | 0.5081 | 0.0429 | |||
| EPAM / EPAM Systems, Inc. | 0.31 | 10.16 | 54.42 | 15.37 | 0.5038 | -0.0120 | |||
| PLNT / Planet Fitness, Inc. | 0.50 | 28.93 | 54.38 | 45.53 | 0.5034 | 0.0949 | |||
| NET / Cloudflare, Inc. | 0.27 | 6,945.67 | 53.41 | 12,150.00 | 0.4945 | 0.4897 | |||
| ENTG / Entegris, Inc. | 0.66 | 53.85 | 53.17 | 41.84 | 0.4923 | 0.0824 | |||
| TER / Teradyne, Inc. | 0.59 | 1,198.41 | 53.02 | 1,313.60 | 0.4909 | 0.4499 | |||
| LSCC / Lattice Semiconductor Corporation | 1.07 | -18.76 | 52.51 | -24.12 | 0.4861 | -0.2706 | |||
| LAD / Lithia Motors, Inc. | 0.15 | -21.34 | 51.84 | -9.47 | 0.4799 | -0.1462 | |||
| CWK / Cushman & Wakefield plc | 4.68 | 51.76 | 0.4792 | 0.4792 | |||||
| U / Unity Software Inc. | 2.14 | 74.51 | 51.72 | 115.58 | 0.4788 | 0.2165 | |||
| HXL / Hexcel Corporation | 0.91 | 88.55 | 51.40 | 94.51 | 0.4759 | 0.1869 | |||
| APH / Amphenol Corporation | 0.51 | -17.03 | 49.96 | 24.91 | 0.4625 | 0.0252 | |||
| ALK / Alaska Air Group, Inc. | 1.01 | 78.40 | 49.94 | 79.35 | 0.4624 | 0.1579 | |||
| GWRE / Guidewire Software, Inc. | 0.21 | -17.50 | 49.81 | 3.67 | 0.4612 | -0.0642 | |||
| BDC / Belden Inc. | 0.43 | -11.49 | 49.58 | 2.24 | 0.4590 | -0.0712 | |||
| MRVL / Marvell Technology, Inc. | 0.64 | -19.87 | 49.40 | 0.73 | 0.4573 | -0.0789 | |||
| TTD / The Trade Desk, Inc. | 0.69 | 110.58 | 49.38 | 177.04 | 0.4572 | 0.2623 | |||
| ROL / Rollins, Inc. | 0.87 | 0.83 | 49.34 | 5.29 | 0.4568 | -0.0556 | |||
| PLTR / Palantir Technologies Inc. | 0.36 | -64.99 | 49.06 | -43.46 | 0.4543 | -0.4946 | |||
| PSTG / Pure Storage, Inc. | 0.85 | 4.39 | 48.90 | 35.78 | 0.4527 | 0.0589 | |||
| DDOG / Datadog, Inc. | 0.36 | 7.70 | 48.76 | 45.82 | 0.4514 | 0.0858 | |||
| EFX / Equifax Inc. | 0.18 | 0.11 | 47.63 | 6.61 | 0.4410 | -0.0476 | |||
| FAF / First American Financial Corporation | 0.78 | 47.60 | 0.4407 | 0.4407 | |||||
| NMIH / NMI Holdings, Inc. | 1.12 | 3.94 | 47.25 | 21.64 | 0.4375 | 0.0127 | |||
| ALC / Alcon Inc. | 0.53 | -5.91 | 47.13 | -12.50 | 0.4363 | -0.1526 | |||
| RMD / ResMed Inc. | 0.18 | -5.91 | 46.84 | 8.44 | 0.4336 | -0.0387 | |||
| MDU / MDU Resources Group, Inc. | 2.79 | 19.74 | 46.52 | 18.04 | 0.4307 | -0.0002 | |||
| LCII / LCI Industries | 0.50 | 47.04 | 46.03 | 53.36 | 0.4261 | 0.0979 | |||
| CZR / Caesars Entertainment, Inc. | 1.59 | -58.18 | 45.22 | -52.51 | 0.4186 | -0.6226 | |||
| MGNI / Magnite, Inc. | 1.79 | 419.39 | 43.27 | 998.15 | 0.4006 | 0.3575 | |||
| GTLS / Chart Industries, Inc. | 0.26 | 166.48 | 42.66 | 203.94 | 0.3950 | 0.2415 | |||
| SNX / TD SYNNEX Corporation | 0.31 | -7.86 | 42.42 | 20.27 | 0.3927 | 0.0071 | |||
| ALGN / Align Technology, Inc. | 0.22 | -7.51 | 42.41 | 10.23 | 0.3927 | -0.0281 | |||
| CSGP / CoStar Group, Inc. | 0.53 | 20.04 | 42.41 | 21.81 | 0.3926 | 0.0119 | |||
| WBS / Webster Financial Corporation | 0.78 | 2.76 | 42.37 | 8.84 | 0.3923 | -0.0334 | |||
| WSFS / WSFS Financial Corporation | 0.77 | 1.29 | 42.26 | 7.40 | 0.3912 | -0.0390 | |||
| BWXT / BWX Technologies, Inc. | 0.29 | 10.16 | 42.25 | 60.87 | 0.3911 | 0.1040 | |||
| EBC / Eastern Bankshares, Inc. | 2.77 | 0.01 | 42.22 | -6.88 | 0.3909 | -0.1049 | |||
| SNOW / Snowflake Inc. | 0.19 | 83.68 | 42.06 | 181.22 | 0.3894 | 0.2258 | |||
| SNCY / Sun Country Airlines Holdings, Inc. | 3.53 | 53.31 | 41.52 | 46.22 | 0.3844 | 0.0739 | |||
| CACI / CACI International Inc | 0.09 | 28.50 | 41.47 | 66.94 | 0.3839 | 0.1123 | |||
| MOD / Modine Manufacturing Company | 0.42 | -2.69 | 41.19 | 24.89 | 0.3813 | 0.0207 | |||
| SLGN / Silgan Holdings Inc. | 0.76 | -7.91 | 41.08 | -2.39 | 0.3803 | -0.0799 | |||
| RNST / Renasant Corporation | 1.14 | 1.00 | 40.85 | 6.95 | 0.3782 | -0.0395 | |||
| APG / APi Group Corporation | 0.78 | 39.83 | 0.3687 | 0.3687 | |||||
| RBC / RBC Bearings Incorporated | 0.10 | 39.82 | 0.3686 | 0.3686 | |||||
| ATGE / Adtalem Global Education Inc. | 0.31 | -44.06 | 39.41 | -29.28 | 0.3648 | -0.2445 | |||
| CRDO / Credo Technology Group Holding Ltd | 0.43 | 184.82 | 39.37 | 556.67 | 0.3645 | 0.2990 | |||
| AGCO / AGCO Corporation | 0.37 | 38.53 | 0.3568 | 0.3568 | |||||
| KBR / KBR, Inc. | 0.80 | -35.86 | 38.45 | -38.26 | 0.3560 | -0.3251 | |||
| ELAN / Elanco Animal Health Incorporated | 2.67 | -6.67 | 38.19 | 26.93 | 0.3535 | 0.0246 | |||
| LHX / L3Harris Technologies, Inc. | 0.15 | 62.65 | 38.10 | 94.92 | 0.3528 | 0.1390 | |||
| TEM / Tempus AI, Inc. | 0.59 | -10.59 | 37.53 | 17.77 | 0.3475 | -0.0010 | |||
| WING / Wingstop Inc. | 0.11 | 37.49 | 0.3471 | 0.3471 | |||||
| ABG / Asbury Automotive Group, Inc. | 0.16 | -7.85 | 37.10 | -0.46 | 0.3434 | -0.0641 | |||
| MTD / Mettler-Toledo International Inc. | 0.03 | -5.94 | 36.95 | -6.43 | 0.3421 | -0.0897 | |||
| PSN / Parsons Corporation | 0.51 | 568.38 | 36.64 | 710.26 | 0.3392 | 0.2898 | |||
| LXP / LXP Industrial Trust | 4.41 | -6.93 | 36.43 | -11.12 | 0.3373 | -0.1109 | |||
| APO / Apollo Global Management, Inc. | 0.26 | -34.61 | 36.38 | -32.26 | 0.3368 | -0.2504 | |||
| ARW / Arrow Electronics, Inc. | 0.28 | -7.86 | 36.23 | 13.08 | 0.3354 | -0.0149 | |||
| STRL / Sterling Infrastructure, Inc. | 0.16 | 35.93 | 0.3327 | 0.3327 | |||||
| WFRD / Weatherford International plc | 0.71 | 110.78 | 35.63 | 98.02 | 0.3299 | 0.1331 | |||
| WCN / Waste Connections, Inc. | 0.19 | 8.25 | 35.54 | 3.55 | 0.3290 | -0.0462 | |||
| ECG / Everus Construction Group, Inc. | 0.55 | 4.53 | 34.75 | 79.05 | 0.3218 | 0.1095 | |||
| TDW / Tidewater Inc. | 0.74 | 14.26 | 34.33 | 24.69 | 0.3178 | 0.0168 | |||
| DFIN / Donnelley Financial Solutions, Inc. | 0.55 | 5.69 | 34.21 | 49.07 | 0.3167 | 0.0658 | |||
| CDW / CDW Corporation | 0.19 | 16.83 | 33.92 | 30.19 | 0.3140 | 0.0291 | |||
| CTAS / Cintas Corporation | 0.15 | 57.93 | 33.77 | 71.25 | 0.3126 | 0.0970 | |||
| ALNY / Alnylam Pharmaceuticals, Inc. | 0.10 | 0.57 | 33.59 | 21.45 | 0.3110 | 0.0086 | |||
| KLAC / KLA Corporation | 0.04 | -21.62 | 33.54 | 3.28 | 0.3105 | -0.0446 | |||
| CMG / Chipotle Mexican Grill, Inc. | 0.60 | 11.23 | 33.49 | 24.39 | 0.3101 | 0.0156 | |||
| MTDR / Matador Resources Company | 0.70 | -1.02 | 33.29 | -7.55 | 0.3082 | -0.0856 | |||
| BILL / BILL Holdings, Inc. | 0.71 | -41.96 | 33.07 | -41.49 | 0.3062 | -0.3119 | |||
| KKR / KKR & Co. Inc. | 0.24 | -35.19 | 32.18 | -25.42 | 0.2980 | -0.1739 | |||
| WAFD / WaFd, Inc | 1.09 | -4.35 | 31.84 | -2.01 | 0.2948 | -0.0605 | |||
| TSCO / Tractor Supply Company | 0.60 | 58.80 | 31.84 | 52.09 | 0.2948 | 0.0658 | |||
| CHD / Church & Dwight Co., Inc. | 0.33 | 31.78 | 0.2943 | 0.2943 | |||||
| ACVA / ACV Auctions Inc. | 1.91 | 15.87 | 30.91 | 33.39 | 0.2862 | 0.0328 | |||
| DPZ / Domino's Pizza, Inc. | 0.07 | 4.78 | 30.89 | 2.76 | 0.2860 | -0.0427 | |||
| HOPE / Hope Bancorp, Inc. | 2.85 | -2.67 | 30.60 | -0.25 | 0.2833 | -0.0522 | |||
| LGIH / LGI Homes, Inc. | 0.57 | -6.08 | 29.21 | -27.20 | 0.2704 | -0.1683 | |||
| ROST / Ross Stores, Inc. | 0.23 | -5.92 | 28.85 | -6.08 | 0.2671 | -0.0688 | |||
| PODD / Insulet Corporation | 0.09 | 3.02 | 28.76 | 23.25 | 0.2663 | 0.0111 | |||
| ONON / On Holding AG | 0.55 | 61.93 | 28.73 | 91.90 | 0.2660 | 0.1023 | |||
| RXO / RXO, Inc. | 1.80 | 39.61 | 28.31 | 14.91 | 0.2621 | -0.0073 | |||
| NDAQ / Nasdaq, Inc. | 0.31 | 30.17 | 28.01 | 53.45 | 0.2594 | 0.0597 | |||
| MSCI / MSCI Inc. | 0.05 | -32.19 | 27.97 | -30.85 | 0.2590 | -0.1833 | |||
| PCOR / Procore Technologies, Inc. | 0.40 | 31.81 | 27.27 | 36.60 | 0.2525 | 0.0342 | |||
| TREX / Trex Company, Inc. | 0.50 | 0.69 | 27.11 | -5.76 | 0.2510 | -0.0636 | |||
| CAKE / The Cheesecake Factory Incorporated | 0.43 | -49.89 | 27.05 | -35.47 | 0.2504 | -0.2079 | |||
| LW / Lamb Weston Holdings, Inc. | 0.52 | -0.75 | 26.72 | -3.45 | 0.2474 | -0.0553 | |||
| DIOD / Diodes Incorporated | 0.50 | -7.87 | 26.67 | 12.87 | 0.2469 | -0.0115 | |||
| GEHC / GE HealthCare Technologies Inc. | 0.36 | 5.19 | 26.44 | -3.47 | 0.2448 | -0.0547 | |||
| CELH / Celsius Holdings, Inc. | 0.57 | 26.40 | 0.2444 | 0.2444 | |||||
| COHU / Cohu, Inc. | 1.36 | 20.05 | 26.09 | 57.01 | 0.2415 | 0.0598 | |||
| TILE / Interface, Inc. | 1.25 | -7.93 | 26.07 | -2.87 | 0.2414 | -0.0521 | |||
| FMC / FMC Corporation | 0.62 | 202.10 | 25.90 | 198.96 | 0.2398 | 0.1451 | |||
| LNTH / Lantheus Holdings, Inc. | 0.32 | 52.09 | 25.83 | 27.56 | 0.2391 | 0.0177 | |||
| KTB / Kontoor Brands, Inc. | 0.39 | -7.88 | 25.65 | -5.24 | 0.2375 | -0.0585 | |||
| CDP / COPT Defense Properties | 0.92 | -7.84 | 25.43 | -6.79 | 0.2354 | -0.0629 | |||
| FLEX / Flex Ltd. | 0.49 | -13.26 | 24.30 | 30.90 | 0.2249 | 0.0220 | |||
| PRCT / PROCEPT BioRobotics Corporation | 0.42 | 94.67 | 24.11 | 92.47 | 0.2233 | 0.0863 | |||
| A / Agilent Technologies, Inc. | 0.20 | -22.34 | 24.09 | -21.66 | 0.2230 | -0.1132 | |||
| NSIT / Insight Enterprises, Inc. | 0.17 | -7.89 | 23.76 | -15.21 | 0.2200 | -0.0864 | |||
| NVST / Envista Holdings Corporation | 1.20 | -2.29 | 23.54 | 10.62 | 0.2179 | -0.0148 | |||
| BBIO / BridgeBio Pharma, Inc. | 0.54 | -30.36 | 23.13 | -13.01 | 0.2142 | -0.0766 | |||
| ERO / Ero Copper Corp. | 1.35 | 21.53 | 22.82 | 68.96 | 0.2113 | 0.0636 | |||
| FIP / FTAI Infrastructure Inc. | 3.64 | 425.72 | 22.46 | 616.14 | 0.2079 | 0.1736 | |||
| ANET / Arista Networks Inc | 0.22 | -28.49 | 22.24 | -5.58 | 0.2059 | -0.0517 | |||
| BKU / BankUnited, Inc. | 0.62 | 57.08 | 22.12 | 62.32 | 0.2048 | 0.0558 | |||
| CTSH / Cognizant Technology Solutions Corporation | 0.28 | -57.38 | 21.56 | -56.53 | 0.1996 | -0.3426 | |||
| SYM / Symbotic Inc. | 0.55 | -19.78 | 21.54 | 54.21 | 0.1995 | 0.0467 | |||
| ODD / Oddity Tech Ltd. | 0.29 | 21.53 | 0.1993 | 0.1993 | |||||
| KYMR / Kymera Therapeutics, Inc. | 0.49 | 272.69 | 21.46 | 494.35 | 0.1987 | 0.1592 | |||
| BJ / BJ's Wholesale Club Holdings, Inc. | 0.20 | -6.80 | 21.37 | -11.92 | 0.1979 | -0.0675 | |||
| QDEL / QuidelOrtho Corporation | 0.74 | 37.56 | 21.29 | 13.37 | 0.1971 | -0.0082 | |||
| ZETA / Zeta Global Holdings Corp. | 1.35 | -38.90 | 20.85 | -30.20 | 0.1931 | -0.1336 | |||
| COO / The Cooper Companies, Inc. | 0.28 | 16.80 | 20.18 | -1.46 | 0.1869 | -0.0371 | |||
| DOCN / DigitalOcean Holdings, Inc. | 0.71 | 75.93 | 20.17 | 50.48 | 0.1867 | 0.0402 | |||
| SIGI / Selective Insurance Group, Inc. | 0.23 | 20.11 | 0.1862 | 0.1862 | |||||
| ALAB / Astera Labs, Inc. | 0.22 | 145.92 | 20.08 | 272.68 | 0.1859 | 0.1270 | |||
| MMSI / Merit Medical Systems, Inc. | 0.21 | -7.94 | 19.71 | -18.59 | 0.1825 | -0.0823 | |||
| KD / Kyndryl Holdings, Inc. | 0.47 | 19.59 | 0.1813 | 0.1813 | |||||
| RARE / Ultragenyx Pharmaceutical Inc. | 0.53 | 19.11 | 0.1769 | 0.1769 | |||||
| SM / SM Energy Company | 0.77 | -7.88 | 18.92 | -24.00 | 0.1752 | -0.0971 | |||
| UTL / Unitil Corporation | 0.36 | 38.92 | 18.82 | 25.58 | 0.1742 | 0.0104 | |||
| QXO / QXO, Inc. | 0.87 | 18.68 | 0.1729 | 0.1729 | |||||
| ENS / EnerSys | 0.22 | -7.94 | 18.49 | -13.78 | 0.1712 | -0.0633 | |||
| KNF / Knife River Corporation | 0.22 | -12.47 | 18.35 | -20.78 | 0.1699 | -0.0834 | |||
| MP / MP Materials Corp. | 0.54 | -6.99 | 17.93 | 26.78 | 0.1660 | 0.0113 | |||
| GPK / Graphic Packaging Holding Company | 0.85 | -7.85 | 17.90 | -25.21 | 0.1657 | -0.0960 | |||
| FARO / FARO Technologies, Inc. | 0.40 | 2.92 | 17.76 | 65.58 | 0.1644 | 0.0471 | |||
| MXL / MaxLinear, Inc. | 1.23 | -11.39 | 17.53 | 15.95 | 0.1623 | -0.0030 | |||
| VCEL / Vericel Corporation | 0.40 | 74.25 | 16.98 | 66.18 | 0.1572 | 0.0455 | |||
| LRN / Stride, Inc. | 0.12 | 26.71 | 16.94 | 45.43 | 0.1568 | 0.0295 | |||
| WEAV / Weave Communications, Inc. | 2.03 | 16.91 | 0.1566 | 0.1566 | |||||
| VKTX / Viking Therapeutics, Inc. | 0.64 | 52.75 | 16.91 | 67.61 | 0.1566 | 0.0462 | |||
| WCC / WESCO International, Inc. | 0.09 | -7.85 | 16.67 | 9.89 | 0.1543 | -0.0115 | |||
| CFG / Citizens Financial Group, Inc. | 0.37 | 3.65 | 16.53 | 13.21 | 0.1530 | -0.0066 | |||
| IRTC / iRhythm Technologies, Inc. | 0.11 | -52.69 | 16.38 | -30.41 | 0.1517 | -0.1058 | |||
| GMS / GMS Inc. | 0.15 | -0.30 | 15.78 | 48.20 | 0.1461 | 0.0297 | |||
| EOLS / Evolus, Inc. | 1.66 | 37.90 | 15.33 | 5.58 | 0.1420 | -0.0169 | |||
| FLR / Fluor Corporation | 0.30 | -26.34 | 15.25 | 5.43 | 0.1412 | -0.0170 | |||
| INSM / Insmed Incorporated | 0.15 | -73.49 | 14.87 | -65.03 | 0.1377 | -0.3274 | |||
| AESI / Atlas Energy Solutions Inc. | 1.09 | 28.61 | 14.61 | -3.61 | 0.1353 | -0.0305 | |||
| KTOS / Kratos Defense & Security Solutions, Inc. | 0.31 | -52.59 | 14.48 | -25.83 | 0.1340 | -0.0794 | |||
| PAYC / Paycom Software, Inc. | 0.06 | -0.30 | 14.46 | 5.60 | 0.1338 | -0.0159 | |||
| MTZ / MasTec, Inc. | 0.08 | -26.34 | 14.26 | 7.57 | 0.1320 | -0.0129 | |||
| MTSI / MACOM Technology Solutions Holdings, Inc. | 0.10 | -0.29 | 14.25 | 42.33 | 0.1319 | 0.0224 | |||
| GENI / Genius Sports Limited | 1.37 | 14.22 | 0.1317 | 0.1317 | |||||
| SAIA / Saia, Inc. | 0.05 | 13.94 | 0.1291 | 0.1291 | |||||
| PJT / PJT Partners Inc. | 0.08 | -7.88 | 13.71 | 10.24 | 0.1269 | -0.0091 | |||
| APGE / Apogee Therapeutics, Inc. | 0.31 | 184.02 | 13.42 | 230.18 | 0.1243 | 0.0798 | |||
| KAR / OPENLANE, Inc. | 0.55 | -7.94 | 13.35 | 16.76 | 0.1236 | -0.0014 | |||
| EG / Everest Group, Ltd. | 0.04 | 3.81 | 13.34 | -2.90 | 0.1235 | -0.0267 | |||
| QRVO / Qorvo, Inc. | 0.16 | -0.29 | 13.31 | 16.92 | 0.1232 | -0.0013 | |||
| GTX / Garrett Motion Inc. | 1.26 | 32.11 | 13.20 | 65.88 | 0.1222 | 0.0352 | |||
| RYI / Ryerson Holding Corporation | 0.61 | 2.56 | 13.20 | -3.64 | 0.1222 | -0.0276 | |||
| SHLS / Shoals Technologies Group, Inc. | 3.08 | 7.09 | 13.07 | 37.09 | 0.1210 | 0.0167 | |||
| AIT / Applied Industrial Technologies, Inc. | 0.06 | -34.82 | 12.80 | -32.77 | 0.1185 | -0.0897 | |||
| KEX / Kirby Corporation | 0.11 | -0.30 | 12.79 | 11.94 | 0.1184 | -0.0065 | |||
| NVCR / NovoCure Limited | 0.71 | 12.72 | 12.56 | 12.60 | 0.1163 | -0.0057 | |||
| ATMU / Atmus Filtration Technologies Inc. | 0.34 | 34.77 | 12.36 | 33.63 | 0.1144 | 0.0133 | |||
| CW / Curtiss-Wright Corporation | 0.03 | -0.30 | 12.22 | 53.54 | 0.1131 | 0.0261 | |||
| HL / Hecla Mining Company | 2.03 | -46.63 | 12.16 | -42.51 | 0.1126 | -0.1187 | |||
| EVR / Evercore Inc. | 0.04 | -7.89 | 11.90 | 24.54 | 0.1101 | 0.0057 | |||
| HQY / HealthEquity, Inc. | 0.11 | 24.89 | 11.80 | 48.05 | 0.1092 | 0.0221 | |||
| EXAS / Exact Sciences Corporation | 0.22 | -0.29 | 11.61 | 22.40 | 0.1075 | 0.0038 | |||
| MKL / Markel Group Inc. | 0.01 | -0.31 | 11.53 | 6.50 | 0.1068 | -0.0116 | |||
| CURB / Curbline Properties Corp. | 0.50 | -66.45 | 11.53 | -68.34 | 0.1067 | -0.2914 | |||
| ESTC / Elastic N.V. | 0.13 | -32.60 | 11.02 | -36.22 | 0.1020 | -0.0869 | |||
| WRB / W. R. Berkley Corporation | 0.15 | -0.30 | 11.00 | 2.94 | 0.1019 | -0.0150 | |||
| VREX / Varex Imaging Corporation | 1.27 | -7.94 | 10.97 | -31.19 | 0.1016 | -0.0728 | |||
| GBX / The Greenbrier Companies, Inc. | 0.23 | -17.41 | 10.44 | -25.74 | 0.0967 | -0.0571 | |||
| ICLR / ICON Public Limited Company | 0.07 | 97.63 | 10.38 | 64.28 | 0.0961 | 0.0270 | |||
| SG / Sweetgreen, Inc. | 0.68 | 121.65 | 10.12 | 31.83 | 0.0937 | 0.0097 | |||
| OLED / Universal Display Corporation | 0.07 | -13.03 | 10.10 | -3.68 | 0.0935 | -0.0212 | |||
| INSW / International Seaways, Inc. | 0.27 | 105.21 | 9.86 | 125.49 | 0.0913 | 0.0435 | |||
| TMDX / TransMedics Group, Inc. | 0.07 | -45.47 | 9.84 | 8.61 | 0.0911 | -0.0080 | |||
| STVN / Stevanato Group S.p.A. | 0.39 | -9.85 | 9.65 | 7.86 | 0.0893 | -0.0085 | |||
| TTI / TETRA Technologies, Inc. | 2.84 | 26.05 | 9.53 | 26.04 | 0.0883 | 0.0056 | |||
| CFLT / Confluent, Inc. | 0.37 | -73.60 | 9.32 | -71.92 | 0.0863 | -0.2768 | |||
| DVN / Devon Energy Corporation | 0.29 | 70.73 | 9.22 | 45.21 | 0.0854 | 0.0159 | |||
| PL / Planet Labs PBC | 1.50 | -0.30 | 9.14 | 79.94 | 0.0846 | 0.0291 | |||
| AVAV / AeroVironment, Inc. | 0.03 | 9.08 | 0.0841 | 0.0841 | |||||
| RSI / Rush Street Interactive, Inc. | 0.61 | 24.82 | 9.06 | 73.50 | 0.0839 | 0.0268 | |||
| AVTR / Avantor, Inc. | 0.65 | -53.40 | 8.79 | -61.30 | 0.0814 | -0.1670 | |||
| GDYN / Grid Dynamics Holdings, Inc. | 0.72 | 16.63 | 8.32 | -13.92 | 0.0771 | -0.0287 | |||
| HUBB / Hubbell Incorporated | 0.02 | 11.16 | 8.23 | 37.20 | 0.0762 | 0.0106 | |||
| GTM / ZoomInfo Technologies Inc. | 0.81 | -0.31 | 8.15 | 0.89 | 0.0754 | -0.0129 | |||
| OKTA / Okta, Inc. | 0.08 | -44.65 | 8.08 | -47.41 | 0.0748 | -0.0932 | |||
| FN / Fabrinet | 0.03 | -0.30 | 8.04 | 48.76 | 0.0745 | 0.0153 | |||
| MTCH / Match Group, Inc. | 0.26 | -26.56 | 8.03 | -27.29 | 0.0744 | -0.0464 | |||
| CCOI / Cogent Communications Holdings, Inc. | 0.16 | -0.31 | 7.94 | -21.61 | 0.0735 | -0.0373 | |||
| CRL / Charles River Laboratories International, Inc. | 0.05 | -27.11 | 7.86 | -26.53 | 0.0728 | -0.0442 | |||
| SITM / SiTime Corporation | 0.04 | -14.78 | 7.72 | 18.78 | 0.0714 | 0.0004 | |||
| ACM / AECOM | 0.07 | -0.28 | 7.69 | 21.36 | 0.0712 | 0.0019 | |||
| NXT / Nextracker Inc. | 0.14 | -0.30 | 7.62 | 28.66 | 0.0706 | 0.0058 | |||
| TYL / Tyler Technologies, Inc. | 0.01 | 11.99 | 7.53 | 14.18 | 0.0697 | -0.0024 | |||
| DYN / Dyne Therapeutics, Inc. | 0.79 | 172.59 | 7.52 | 148.10 | 0.0696 | 0.0365 | |||
| EEFT / Euronet Worldwide, Inc. | 0.07 | -0.30 | 7.08 | -5.40 | 0.0656 | -0.0163 | |||
| IAS / Integral Ad Science Holding Corp. | 0.82 | -14.97 | 6.84 | -12.33 | 0.0633 | -0.0220 | |||
| TNDM / Tandem Diabetes Care, Inc. | 0.36 | -0.30 | 6.79 | -3.00 | 0.0628 | -0.0137 | |||
| RVTY / Revvity, Inc. | 0.06 | 31.83 | 6.22 | 20.53 | 0.0576 | 0.0011 | |||
| ALB / Albemarle Corporation | 0.09 | -0.29 | 5.47 | -13.24 | 0.0506 | -0.0183 | |||
| KLC / KinderCare Learning Companies, Inc. | 0.54 | 5.47 | 0.0506 | 0.0506 | |||||
| TPG / TPG Inc. | 0.10 | -0.30 | 5.29 | 10.25 | 0.0490 | -0.0035 | |||
| ROG / Rogers Corporation | 0.07 | -0.28 | 5.13 | 1.12 | 0.0475 | -0.0080 | |||
| CGNX / Cognex Corporation | 0.15 | -55.94 | 4.88 | -53.15 | 0.0452 | -0.0687 | |||
| RVMD / Revolution Medicines, Inc. | 0.13 | 38.02 | 4.65 | 43.59 | 0.0431 | 0.0076 | |||
| TOST / Toast, Inc. | 0.10 | 4.48 | 0.0415 | 0.0415 | |||||
| APPN / Appian Corporation | 0.14 | 4.32 | 0.0400 | 0.0400 | |||||
| JAZZ / Jazz Pharmaceuticals plc | 0.04 | -0.30 | 4.21 | -14.78 | 0.0390 | -0.0150 | |||
| GTLB / GitLab Inc. | 0.08 | -88.92 | 3.55 | -89.37 | 0.0329 | -0.3321 | |||
| ACHC / Acadia Healthcare Company, Inc. | 0.16 | -0.29 | 3.54 | -25.39 | 0.0328 | -0.0191 | |||
| ASPN / Aspen Aerogels, Inc. | 0.51 | -0.29 | 3.01 | -7.61 | 0.0279 | -0.0078 | |||
| AXSM / Axsome Therapeutics, Inc. | 0.03 | -33.33 | 3.01 | -40.34 | 0.0279 | -0.0273 | |||
| HLIO / Helios Technologies, Inc. | 0.08 | -16.77 | 2.81 | -13.48 | 0.0260 | -0.0095 | |||
| BPMC / Blueprint Medicines Corporation | 0.02 | -49.55 | 2.78 | -26.95 | 0.0257 | -0.0159 | |||
| ENVX / Enovix Corporation | 0.20 | 108.49 | 2.06 | 193.73 | 0.0191 | 0.0114 | |||
| NI / NiSource Inc. | 0.01 | 0.00 | 0.55 | 0.55 | 0.0051 | -0.0009 | |||
| CRBG / Corebridge Financial, Inc. | 0.01 | 0.00 | 0.38 | 12.32 | 0.0036 | -0.0002 | |||
| LH / Labcorp Holdings Inc. | 0.00 | 0.00 | 0.37 | 12.84 | 0.0034 | -0.0002 | |||
| EA / Electronic Arts Inc. | 0.00 | 8.03 | 0.35 | 19.32 | 0.0033 | 0.0000 | |||
| CTRA / Coterra Energy Inc. | 0.01 | 9.40 | 0.32 | -3.90 | 0.0030 | -0.0007 | |||
| EQR / Equity Residential | 0.00 | 8.33 | 0.31 | 2.28 | 0.0029 | -0.0005 | |||
| DOCU / DocuSign, Inc. | 0.00 | -91.47 | 0.29 | -91.85 | 0.0027 | -0.0361 | |||
| LKQ / LKQ Corporation | 0.01 | 8.79 | 0.28 | -5.42 | 0.0026 | -0.0006 | |||
| ULTA / Ulta Beauty, Inc. | 0.00 | 0.23 | 0.0022 | 0.0022 | |||||
| JLL / Jones Lang LaSalle Incorporated | 0.00 | 0.21 | 0.0020 | 0.0020 | |||||
| PATH / UiPath Inc. | 0.00 | -100.00 | 0.00 | 0.0000 | |||||
| POR / Portland General Electric Company | 0.00 | -100.00 | 0.00 | 0.0000 | |||||
| MBLY / Mobileye Global Inc. | 0.00 | -100.00 | 0.00 | 0.0000 | |||||
| BECN / Beacon Roofing Supply, Inc. | 0.00 | -100.00 | 0.00 | 0.0000 | |||||
| HAIN / The Hain Celestial Group, Inc. | 0.00 | -100.00 | 0.00 | 0.0000 | |||||
| SRPT / Sarepta Therapeutics, Inc. | 0.00 | -100.00 | 0.00 | 0.0000 | |||||
| AZEK / The AZEK Company Inc. | 0.00 | -100.00 | 0.00 | 0.0000 | |||||
| SITC / SITE Centers Corp. | 0.00 | -100.00 | 0.00 | 0.0000 | |||||
| IT / Gartner, Inc. | 0.00 | -100.00 | 0.00 | 0.0000 | |||||
| SKX / Skechers U.S.A., Inc. | 0.00 | -100.00 | 0.00 | 0.0000 | |||||
| REXR / Rexford Industrial Realty, Inc. | 0.00 | -100.00 | 0.00 | 0.0000 | |||||
| HOLX / Hologic, Inc. | 0.00 | -100.00 | 0.00 | 0.0000 | |||||
| AMPH / Amphastar Pharmaceuticals, Inc. | 0.00 | -100.00 | 0.00 | 0.0000 | |||||
| ARE / Alexandria Real Estate Equities, Inc. | 0.00 | -100.00 | 0.00 | 0.0000 |