Mga Batayang Estadistika
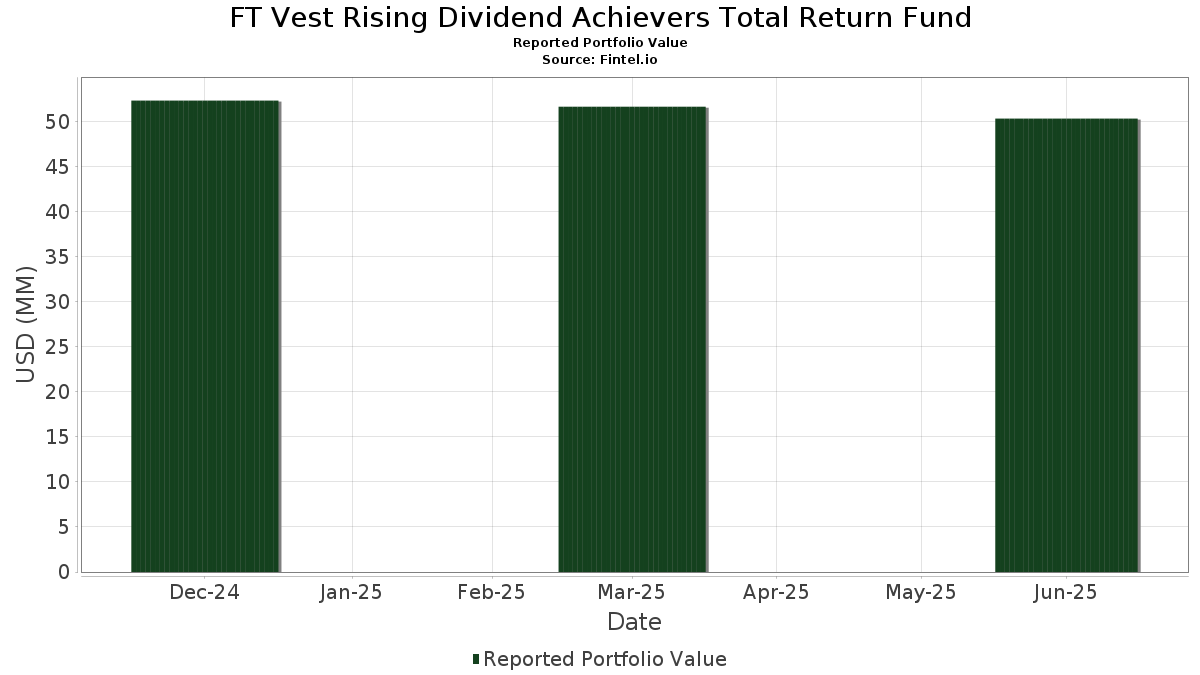
| Nilai Portofolio | $ 50,306,839 |
| Posisi Saat Ini | 83 |
Kepemilikan Terbaru, Kinerja, AUM (dari 13F, 13D)
FT Vest Rising Dividend Achievers Total Return Fund telah mengungkapkan total kepemilikan 83 dalam pengajuan SEC terbaru mereka. Nilai portofolio terbaru dihitung sebesar $ 50,306,839 USD. Aset yang Dikelola (AUM) sebenarnya adalah nilai ini ditambah kas (yang tidak diungkapkan). Aset-aset utama FT Vest Rising Dividend Achievers Total Return Fund adalah Meta Platforms, Inc. (US:META) , Booking Holdings Inc. (US:BKNG) , Microsoft Corporation (US:MSFT) , JPMorgan Chase & Co. (US:JPM) , and eBay Inc. (US:EBAY) . Posisi baru FT Vest Rising Dividend Achievers Total Return Fund meliputi: GE Vernova Inc. (US:GEV) , Dover Corporation (US:DOV) , AECOM (US:ACM) , Johnson & Johnson (US:JNJ) , and The Allstate Corporation (US:ALL) .
Peningkatan Tertinggi Kuartal Ini
Kami menggunakan perubahan dalam alokasi portofolio karena ini adalah metrik yang paling bermakna. Perubahan dapat disebabkan oleh perdagangan atau perubahan harga saham.
| Keamanan | Saham (MM) |
Nilai (Juta Dolar AS) |
Portfolio % | ΔPorsyento ng Portfolio |
|---|---|---|---|---|
| 2.93 | 5.8293 | 5.8293 | ||
| 2.08 | 4.1386 | 4.1386 | ||
| 0.01 | 0.88 | 1.7585 | 0.8993 | |
| 0.00 | 0.95 | 1.8880 | 0.8406 | |
| 0.38 | 0.7551 | 0.7551 | ||
| 0.01 | 0.60 | 1.1948 | 0.7116 | |
| 0.00 | 0.56 | 1.1118 | 0.6274 | |
| 0.01 | 1.02 | 2.0297 | 0.6201 | |
| 0.00 | 0.56 | 1.1071 | 0.6137 | |
| 0.00 | 0.53 | 1.0506 | 0.5904 |
Penurunan Tertinggi Kuartal Ini
Kami menggunakan perubahan dalam alokasi portofolio karena ini adalah metrik yang paling bermakna. Perubahan dapat disebabkan oleh perdagangan atau perubahan harga saham.
| Keamanan | Saham (MM) |
Nilai (Juta Dolar AS) |
Portfolio % | ΔPorsyento ng Portfolio |
|---|---|---|---|---|
| -4.14 | -8.2558 | -8.2558 | ||
| -0.87 | -1.7345 | -1.7345 | ||
| 0.01 | 0.25 | 0.5017 | -1.4986 | |
| 0.01 | 0.70 | 1.3879 | -0.7122 | |
| 0.00 | 0.64 | 1.2728 | -0.7008 | |
| 0.00 | 0.45 | 0.8917 | -0.6049 | |
| 0.00 | 0.45 | 0.8900 | -0.5829 | |
| 0.00 | 0.43 | 0.8504 | -0.5291 | |
| 0.01 | 0.62 | 1.2368 | -0.5262 | |
| -0.25 | -0.5078 | -0.5078 |
Pengajuan 13F dan Dana
Formulir ini diajukan pada 2025-08-26 untuk periode pelaporan 2025-06-30. Klik ikon tautan untuk melihat riwayat transaksi selengkapnya.
Tingkatkan ke versi premium untuk membuka data premium dan ekspor ke Excel. ![]() .
.
| Keamanan | Ketik | Harga Saham Rata-rata | Saham (MM) |
ΔSaham (%) |
ΔSaham (%) |
Nilai ($MM) |
Portpolyo (%) |
ΔPortofolio (%) |
|
|---|---|---|---|---|---|---|---|---|---|
| SPX 11/13/26 P5969 11/26 5969.34 PUT / / DE (999999999) | 2.93 | 5.8293 | 5.8293 | ||||||
| SPX 11/13/26 C6000 11/26 6000.01 CAL / / DE (999999999) | 2.08 | 4.1386 | 4.1386 | ||||||
| META / Meta Platforms, Inc. | 0.00 | -12.78 | 1.20 | 11.70 | 2.3983 | 0.3146 | |||
| BKNG / Booking Holdings Inc. | 0.00 | -13.73 | 1.16 | 8.39 | 2.3182 | 0.2431 | |||
| MSFT / Microsoft Corporation | 0.00 | -7.70 | 1.15 | 22.33 | 2.2822 | 0.4715 | |||
| JPM / JPMorgan Chase & Co. | 0.00 | -11.41 | 1.13 | 4.73 | 2.2519 | 0.1649 | |||
| EBAY / eBay Inc. | 0.02 | -11.92 | 1.12 | -3.20 | 2.2342 | -0.0048 | |||
| BK / The Bank of New York Mellon Corporation | 0.01 | -14.41 | 1.09 | -7.05 | 2.1805 | -0.0952 | |||
| UNM / Unum Group | 0.01 | -14.68 | 1.09 | -15.42 | 2.1645 | -0.3185 | |||
| AXP / American Express Company | 0.00 | -10.08 | 1.08 | 6.54 | 2.1435 | 0.1924 | |||
| EA / Electronic Arts Inc. | 0.01 | -7.18 | 1.07 | 2.60 | 2.1218 | 0.1144 | |||
| V / Visa Inc. | 0.00 | -11.80 | 1.06 | -10.69 | 2.1150 | -0.1819 | |||
| BLK / BlackRock, Inc. | 0.00 | -10.90 | 1.05 | -1.22 | 2.1008 | 0.0368 | |||
| AMAT / Applied Materials, Inc. | 0.01 | 1.70 | 1.05 | 28.27 | 2.0895 | 0.5091 | |||
| EWBC / East West Bancorp, Inc. | 0.01 | -10.32 | 1.04 | 0.87 | 2.0796 | 0.0795 | |||
| RJF / Raymond James Financial, Inc. | 0.01 | 22.99 | 1.02 | 35.81 | 2.0414 | 0.5826 | |||
| GOOGL / Alphabet Inc. | 0.01 | 22.61 | 1.02 | 39.64 | 2.0297 | 0.6201 | |||
| TRV / The Travelers Companies, Inc. | 0.00 | 20.56 | 1.02 | 21.94 | 2.0281 | 0.4145 | |||
| HIG / The Hartford Insurance Group, Inc. | 0.01 | -10.49 | 1.02 | -8.23 | 2.0238 | -0.1159 | |||
| MLI / Mueller Industries, Inc. | 0.01 | -12.01 | 0.99 | -8.22 | 1.9819 | -0.1122 | |||
| ADP / Automatic Data Processing, Inc. | 0.00 | -11.84 | 0.99 | -11.02 | 1.9630 | -0.1776 | |||
| CB / Chubb Limited | 0.00 | -7.49 | 0.98 | -11.26 | 1.9474 | -0.1818 | |||
| KLAC / KLA Corporation | 0.00 | 32.75 | 0.95 | 75.05 | 1.8880 | 0.8406 | |||
| CTSH / Cognizant Technology Solutions Corporation | 0.01 | -10.10 | 0.94 | -8.37 | 1.8787 | -0.1093 | |||
| CRM / Salesforce, Inc. | 0.00 | 26.28 | 0.93 | 28.30 | 1.8612 | 0.4537 | |||
| SNA / Snap-on Incorporated | 0.00 | -9.14 | 0.93 | -16.18 | 1.8487 | -0.2896 | |||
| PCAR / PACCAR Inc | 0.01 | -2.06 | 0.90 | -4.47 | 1.7910 | -0.0267 | |||
| PHM / PulteGroup, Inc. | 0.01 | -0.66 | 0.89 | 1.82 | 1.7829 | 0.0853 | |||
| ELV / Elevance Health, Inc. | 0.00 | 2.32 | 0.89 | -8.53 | 1.7745 | -0.1074 | |||
| NVDA / NVIDIA Corporation | 0.01 | 36.24 | 0.88 | 98.65 | 1.7585 | 0.8993 | |||
| ACN / Accenture plc | 0.00 | -8.09 | 0.85 | -12.00 | 1.6971 | -0.1736 | |||
| ROST / Ross Stores, Inc. | 0.01 | 25.15 | 0.85 | 25.00 | 1.6935 | 0.3782 | |||
| PAYC / Paycom Software, Inc. | 0.00 | -6.94 | 0.85 | -1.40 | 1.6863 | 0.0260 | |||
| SYF / Synchrony Financial | 0.01 | -33.93 | 0.83 | -16.70 | 1.6604 | -0.2740 | |||
| LEN / Lennar Corporation | 0.01 | 5.99 | 0.78 | 2.09 | 1.5555 | 0.0777 | |||
| QCOM / QUALCOMM Incorporated | 0.00 | 5.10 | 0.77 | 8.94 | 1.5306 | 0.1675 | |||
| AFL / Aflac Incorporated | 0.01 | -32.38 | 0.70 | -35.91 | 1.3879 | -0.7122 | |||
| WSM / Williams-Sonoma, Inc. | 0.00 | 43.11 | 0.69 | 47.75 | 1.3764 | 0.4732 | |||
| BKR / Baker Hughes Company | 0.02 | 46.09 | 0.68 | 27.29 | 1.3586 | 0.3241 | |||
| ODFL / Old Dominion Freight Line, Inc. | 0.00 | 46.43 | 0.66 | 43.72 | 1.3247 | 0.4298 | |||
| AAPL / Apple Inc. | 0.00 | -32.25 | 0.64 | -37.45 | 1.2728 | -0.7008 | |||
| CSCO / Cisco Systems, Inc. | 0.01 | -39.45 | 0.62 | -31.94 | 1.2368 | -0.5262 | |||
| DHI / D.R. Horton, Inc. | 0.00 | -29.62 | 0.60 | -28.69 | 1.2048 | -0.4333 | |||
| LRCX / Lam Research Corporation | 0.01 | 79.20 | 0.60 | 140.56 | 1.1948 | 0.7116 | |||
| MPWR / Monolithic Power Systems, Inc. | 0.00 | 76.62 | 0.56 | 123.20 | 1.1118 | 0.6274 | |||
| GE / General Electric Company | 0.00 | 69.33 | 0.56 | 117.65 | 1.1071 | 0.6137 | |||
| STT / State Street Corporation | 0.00 | 86.50 | 0.53 | 121.43 | 1.0506 | 0.5904 | |||
| CF / CF Industries Holdings, Inc. | 0.01 | -37.73 | 0.52 | -26.72 | 1.0389 | -0.3363 | |||
| AMP / Ameriprise Financial, Inc. | 0.00 | -39.17 | 0.52 | -32.94 | 1.0272 | -0.4591 | |||
| MTB / M&T Bank Corporation | 0.00 | -40.28 | 0.51 | -35.23 | 1.0199 | -0.5072 | |||
| PNC / The PNC Financial Services Group, Inc. | 0.00 | 93.09 | 0.49 | 104.98 | 0.9860 | 0.5188 | |||
| COST / Costco Wholesale Corporation | 0.00 | -6.94 | 0.49 | -2.58 | 0.9782 | 0.0037 | |||
| ABT / Abbott Laboratories | 0.00 | 86.77 | 0.49 | 91.70 | 0.9676 | 0.4773 | |||
| XOM / Exxon Mobil Corporation | 0.00 | -36.21 | 0.45 | -42.25 | 0.8917 | -0.6049 | |||
| EOG / EOG Resources, Inc. | 0.00 | -37.13 | 0.45 | -41.39 | 0.8900 | -0.5829 | |||
| EG / Everest Group, Ltd. | 0.00 | -36.05 | 0.43 | -40.25 | 0.8504 | -0.5291 | |||
| CSL / Carlisle Companies Incorporated | 0.00 | -6.86 | 0.42 | 2.22 | 0.8280 | 0.0413 | |||
| SPX 11/13/26 P5000 11/26 5000.01 PUT / / DE (999999999) | 0.38 | 0.7551 | 0.7551 | ||||||
| NTRS / Northern Trust Corporation | 0.00 | -6.95 | 0.29 | 19.26 | 0.5815 | 0.1096 | |||
| US21871X1090 / Corebridge Financial, Inc. | 0.01 | -52.72 | 0.28 | -46.97 | 0.5594 | -0.4617 | |||
| MA / Mastercard Incorporated | 0.00 | -6.98 | 0.27 | -4.61 | 0.5374 | -0.0094 | |||
| GEV / GE Vernova Inc. | 0.00 | 0.27 | 0.5334 | 0.5334 | |||||
| MTG / MGIC Investment Corporation | 0.01 | -79.49 | 0.25 | -75.98 | 0.5017 | -1.4986 | |||
| EQH / Equitable Holdings, Inc. | 0.00 | -6.94 | 0.25 | 0.40 | 0.4988 | 0.0158 | |||
| DOV / Dover Corporation | 0.00 | 0.25 | 0.4913 | 0.4913 | |||||
| ACM / AECOM | 0.00 | 0.25 | 0.4897 | 0.4897 | |||||
| MCK / McKesson Corporation | 0.00 | -21.14 | 0.24 | -14.13 | 0.4847 | -0.0631 | |||
| SLM / SLM Corporation | 0.01 | 0.24 | 0.4828 | 0.4828 | |||||
| CINF / Cincinnati Financial Corporation | 0.00 | -6.97 | 0.24 | -6.30 | 0.4750 | -0.0165 | |||
| JNJ / Johnson & Johnson | 0.00 | 0.24 | 0.4689 | 0.4689 | |||||
| JXN / Jackson Financial Inc. | 0.00 | -6.91 | 0.23 | -1.29 | 0.4597 | 0.0075 | |||
| WTFC / Wintrust Financial Corporation | 0.00 | -6.97 | 0.23 | 2.23 | 0.4579 | 0.0246 | |||
| ALL / The Allstate Corporation | 0.00 | 0.23 | 0.4572 | 0.4572 | |||||
| PGR / The Progressive Corporation | 0.00 | 0.22 | 0.4461 | 0.4461 | |||||
| LNC / Lincoln National Corporation | 0.01 | -6.95 | 0.22 | -10.33 | 0.4339 | -0.0357 | |||
| ADM / Archer-Daniels-Midland Company | 0.00 | -51.86 | 0.20 | -47.12 | 0.4031 | -0.3360 | |||
| NUE / Nucor Corporation | 0.00 | -49.97 | 0.20 | -46.22 | 0.3972 | -0.3185 | |||
| NKE / NIKE, Inc. | 0.00 | -49.36 | 0.20 | -43.30 | 0.3971 | -0.2829 | |||
| FANG / Diamondback Energy, Inc. | 0.00 | -6.91 | 0.16 | -20.00 | 0.3282 | -0.0699 | |||
| XSP 11/13/26 P596.93 11/26 596.93 PUT / / DE (999999999) | 0.05 | 0.1068 | 0.1068 | ||||||
| SPX 07/03/25 C6175 07/25 6175.0 CAL / / DE (999999999) | -0.25 | -0.5078 | -0.5078 | ||||||
| SPX 11/13/26 P6000 11/26 6000.01 PUT / / DE (999999999) | -0.87 | -1.7345 | -1.7345 | ||||||
| SPX 11/13/26 C5000 11/26 5000.01 CAL / / DE (999999999) | -4.14 | -8.2558 | -8.2558 |