Mga Batayang Estadistika
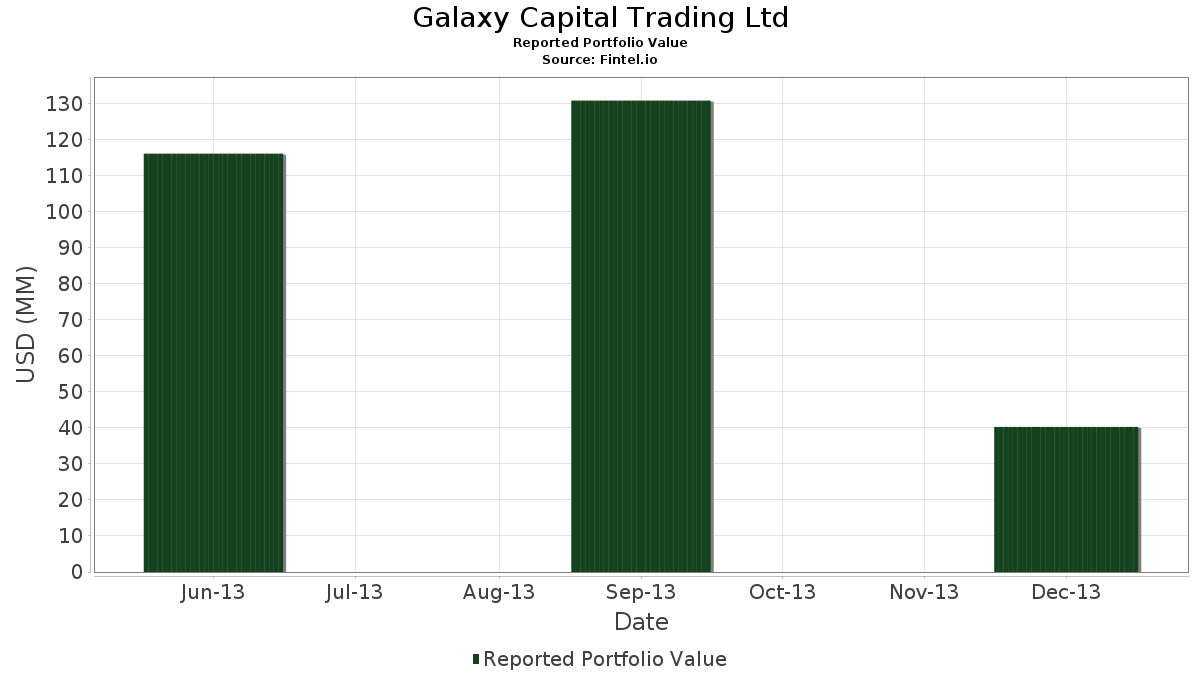
| Nilai Portofolio | $ 40,290,000 |
| Posisi Saat Ini | 152 |
Kepemilikan Terbaru, Kinerja, AUM (dari 13F, 13D)
Galaxy Capital Trading Ltd telah mengungkapkan total kepemilikan 152 dalam pengajuan SEC terbaru mereka. Nilai portofolio terbaru dihitung sebesar $ 40,290,000 USD. Aset yang Dikelola (AUM) sebenarnya adalah nilai ini ditambah kas (yang tidak diungkapkan). Aset-aset utama Galaxy Capital Trading Ltd adalah SPDR Series Trust - SPDR Bloomberg High Yield Bond ETF (US:JNK) , Vanguard Index Funds - Vanguard Total Stock Market ETF (US:VTI) , iShares Trust - iShares MSCI EAFE ETF (US:EFA) , Vanguard International Equity Index Funds - Vanguard FTSE Emerging Markets ETF (US:VWO) , and Vanguard Scottsdale Funds - Vanguard Long-Term Corporate Bond ETF (US:VCLT) . Posisi baru Galaxy Capital Trading Ltd meliputi: SPDR Series Trust - SPDR Bloomberg High Yield Bond ETF (US:JNK) , Vanguard Index Funds - Vanguard Total Stock Market ETF (US:VTI) , iShares Trust - iShares MSCI EAFE ETF (US:EFA) , Vanguard Scottsdale Funds - Vanguard Long-Term Corporate Bond ETF (US:VCLT) , and iShares Trust - iShares MBS ETF (US:MBB) .
Peningkatan Tertinggi Kuartal Ini
Kami menggunakan perubahan dalam alokasi portofolio karena ini adalah metrik yang paling bermakna. Perubahan dapat disebabkan oleh perdagangan atau perubahan harga saham.
| Keamanan | Saham (MM) |
Nilai (Juta Dolar AS) |
Portfolio % | ΔPorsyento ng Portfolio |
|---|---|---|---|---|
| 0.08 | 3.44 | 8.5480 | 8.5480 | |
| 0.03 | 2.75 | 6.8156 | 6.8156 | |
| 0.04 | 2.62 | 6.5053 | 6.5053 | |
| 0.03 | 1.28 | 3.1819 | 3.1819 | |
| 0.01 | 1.04 | 2.5763 | 2.5763 | |
| 0.01 | 1.02 | 2.5416 | 2.5416 | |
| 0.01 | 1.02 | 2.5292 | 2.5292 | |
| 0.01 | 0.74 | 1.8268 | 1.8268 | |
| 0.01 | 0.68 | 1.6927 | 1.6927 | |
| 0.01 | 0.68 | 1.6754 | 1.6754 |
Penurunan Tertinggi Kuartal Ini
Kami menggunakan perubahan dalam alokasi portofolio karena ini adalah metrik yang paling bermakna. Perubahan dapat disebabkan oleh perdagangan atau perubahan harga saham.
| Keamanan | Saham (MM) |
Nilai (Juta Dolar AS) |
Portfolio % | ΔPorsyento ng Portfolio |
|---|---|---|---|---|
| 0.00 | 0.00 | -0.8532 | ||
| 0.00 | 0.00 | -0.7860 | ||
| 0.00 | 0.00 | -0.7310 | ||
| 0.00 | 0.00 | -0.6729 | ||
| 0.00 | 0.00 | -0.6615 | ||
| 0.00 | 0.04 | 0.1042 | -0.6534 | |
| 0.00 | 0.01 | 0.0273 | -0.6487 | |
| 0.00 | 0.00 | -0.5622 | ||
| 0.00 | 0.00 | -0.5568 | ||
| 0.00 | 0.00 | -0.5270 |
Pengajuan 13F dan Dana
Formulir ini diajukan pada 2014-02-26 untuk periode pelaporan 2013-12-31. Klik ikon tautan untuk melihat riwayat transaksi selengkapnya.
Tingkatkan ke versi premium untuk membuka data premium dan ekspor ke Excel. ![]() .
.
| Keamanan | Ketik | Harga Saham Rata-rata | Saham (MM) |
ΔSaham (%) |
ΔSaham (%) |
Nilai ($MM) |
Portpolyo (%) |
ΔPortofolio (%) |
|
|---|---|---|---|---|---|---|---|---|---|
| JNK / SPDR Series Trust - SPDR Bloomberg High Yield Bond ETF | 0.08 | 3.44 | 8.5480 | 8.5480 | |||||
| VTI / Vanguard Index Funds - Vanguard Total Stock Market ETF | 0.03 | 2.75 | 6.8156 | 6.8156 | |||||
| EFA / iShares Trust - iShares MSCI EAFE ETF | 0.04 | 2.62 | 6.5053 | 6.5053 | |||||
| VWO / Vanguard International Equity Index Funds - Vanguard FTSE Emerging Markets ETF | 0.03 | -61.13 | 1.28 | -60.17 | 3.1819 | 3.1819 | |||
| VCLT / Vanguard Scottsdale Funds - Vanguard Long-Term Corporate Bond ETF | 0.01 | 1.04 | 2.5763 | 2.5763 | |||||
| MBB / iShares Trust - iShares MBS ETF | 0.01 | 1.02 | 2.5416 | 2.5416 | |||||
| VICSX / Vanguard Scottsdale Funds - Vanguard IT Corporate Bond Index Fund Admiral | 0.01 | 1.02 | 2.5292 | 2.5292 | |||||
| DIREXION DAILY SP500 BEAR 3X / ETF (25459Y371) | 0.03 | 0.99 | 0.0000 | ||||||
| INP / Barclays iPath MSCI India Index ETN due on 12/18/2036 due 12/18/2036 | 0.01 | -7.63 | 0.74 | -1.74 | 1.8268 | 1.8268 | |||
| ISHARES MSCI MALAYSIA ETF / MALAYSIA WEBS (464286830) | 0.05 | 0.72 | 0.0000 | ||||||
| FM / iShares, Inc. - iShares Frontier and Select EM ETF | 0.02 | -0.36 | 0.72 | 6.71 | 1.7771 | 1.2646 | |||
| VNQ / Vanguard Specialized Funds - Vanguard Real Estate ETF | 0.01 | 0.68 | 1.6927 | 1.6927 | |||||
| IGSB / iShares Trust - iShares 1-5 Year Investment Grade Corporate Bond ETF | 0.01 | 6.55 | 0.68 | 6.64 | 1.6754 | 1.6754 | |||
| TIP / iShares Trust - iShares TIPS Bond ETF | 0.00 | 0.45 | 1.1243 | 1.1243 | |||||
| KBR / KBR, Inc. | 0.01 | 0.43 | 1.0598 | 1.0598 | |||||
| MRVL / Marvell Technology, Inc. | 0.03 | -11.75 | 0.42 | 10.21 | 1.0449 | 1.0449 | |||
| LUV / Southwest Airlines Co. | 0.02 | -39.34 | 0.42 | -11.44 | 1.0375 | 1.0375 | |||
| RIG / Transocean Ltd. | 0.01 | 0.41 | 1.0176 | 1.0176 | |||||
| UAL / United Airlines Holdings, Inc. | 0.01 | 0.41 | 1.0151 | 1.0151 | |||||
| CHRW / C.H. Robinson Worldwide, Inc. | 0.01 | 12.90 | 0.41 | 10.57 | 1.0127 | 1.0127 | |||
| F / Ford Motor Company | 0.03 | -48.84 | 0.41 | -53.22 | 1.0102 | 0.3457 | |||
| ERIC / Telefonaktiebolaget LM Ericsson (publ) - Depositary Receipt (Common Stock) | 0.03 | 0.41 | 1.0077 | 1.0077 | |||||
| ITUB / Itaú Unibanco Holding S.A. - Depositary Receipt (Common Stock) | 0.03 | -34.69 | 0.40 | -31.53 | 1.0027 | 1.0027 | |||
| DAL / Delta Air Lines, Inc. | 0.01 | 0.40 | 1.0027 | 1.0027 | |||||
| MU / Micron Technology, Inc. | 0.02 | 0.40 | 0.9978 | 0.9978 | |||||
| STZ / Constellation Brands, Inc. | 0.01 | 0.40 | 0.9953 | 0.9953 | |||||
| NLSN / Nielsen Holdings plc | 0.01 | 0.40 | 0.9903 | 0.9903 | |||||
| MET / MetLife, Inc. | 0.01 | -42.64 | 0.40 | -34.16 | 0.9903 | 0.9903 | |||
| OAS / Oasis Petroleum Inc. - New | 0.01 | 11.84 | 0.40 | 35.25 | 0.9903 | 0.9903 | |||
| KKR / KKR & Co. Inc. | 0.02 | 0.40 | 0.9854 | 0.9854 | |||||
| INCY / Incyte Corporation | 0.01 | 0.40 | 0.9804 | 0.9804 | |||||
| FSLR / First Solar, Inc. | 0.01 | 0.39 | 0.9754 | 0.9754 | |||||
| GM / General Motors Company | 0.01 | -75.19 | 0.39 | -71.84 | 0.9729 | -0.0903 | |||
| SWKS / Skyworks Solutions, Inc. | 0.01 | 0.39 | 0.9581 | 0.9581 | |||||
| P / Pandora Media, Inc. | 0.01 | 0.38 | 0.9506 | 0.9506 | |||||
| FDO / | 0.01 | 47.50 | 0.38 | 32.99 | 0.9506 | 0.9506 | |||
| BSX / Boston Scientific Corporation | 0.03 | -6.82 | 0.38 | -4.80 | 0.9357 | 0.9357 | |||
| HLF / Herbalife Ltd. | 0.00 | 0.37 | 0.9183 | 0.9183 | |||||
| HCA / HCA Healthcare, Inc. | 0.01 | 0.36 | 0.9010 | 0.9010 | |||||
| US0325111070 / Anadarko Petroleum Corp. | 0.00 | -6.25 | 0.36 | -19.96 | 0.8861 | 0.8861 | |||
| 83416T100 / SolarCity Corp | 0.01 | 0.35 | 0.8737 | 0.8737 | |||||
| BAC / Bank of America Corporation | 0.02 | 2.30 | 0.35 | 15.72 | 0.8588 | 0.8588 | |||
| EIDO / iShares Trust - iShares MSCI Indonesia ETF | 0.02 | -68.54 | 0.35 | -69.49 | 0.8588 | 0.8588 | |||
| MARKET VECTORS VIETNAM ETF / ETF (57060U761) | 0.02 | 0.34 | 0.0000 | ||||||
| MARKET VECTORS INDONESIA ETF / ETF (57060U753) | 0.02 | 0.34 | 0.0000 | ||||||
| US00C4U1L353 / Mylan N.V. | 0.01 | 0.33 | 0.8290 | 0.8290 | |||||
| SDRL / Seadrill Limited | 0.01 | 0.33 | 0.8265 | 0.8265 | |||||
| YNDX / Yandex N.V. | 0.01 | 0.33 | 0.8141 | 0.8141 | |||||
| META / Meta Platforms, Inc. | 0.01 | 0.33 | 0.8141 | 0.8141 | |||||
| SHLD / Global X Funds - Global X Defense Tech ETF | 0.01 | 0.32 | 0.7918 | 0.7918 | |||||
| AES / The AES Corporation | 0.02 | 45.93 | 0.29 | 59.78 | 0.7099 | 0.7099 | |||
| NLOK / NortonLifeLock Inc | 0.01 | -13.57 | 0.28 | -17.87 | 0.7074 | 0.4423 | |||
| WFT / Weatherford International plc | 0.02 | -56.07 | 0.28 | -50.35 | 0.6950 | 0.6950 | |||
| CX / CEMEX, S.A.B. de C.V. - Depositary Receipt (Common Stock) | 0.02 | -50.99 | 0.26 | -48.13 | 0.6552 | 0.6552 | |||
| PCYC / Pharmacyclics | 0.00 | 0.26 | 0.6552 | 0.6552 | |||||
| ULTA / Ulta Beauty, Inc. | 0.00 | 0.26 | 0.6478 | 0.6478 | |||||
| HPQ / HP Inc. | 0.01 | -70.59 | 0.25 | -60.75 | 0.6255 | 0.1351 | |||
| APA / APA Corporation | 0.00 | -38.30 | 0.25 | -37.75 | 0.6180 | 0.6180 | |||
| TCOM / Trip.com Group Limited - Depositary Receipt (Common Stock) | 0.00 | 0.24 | 0.6031 | 0.6031 | |||||
| TLT / iShares Trust - iShares 20+ Year Treasury Bond ETF | 0.00 | 0.23 | 0.5585 | 0.5585 | |||||
| GLD / SPDR Gold Trust | 0.00 | 0.22 | 0.5535 | 0.5535 | |||||
| NFX / Newfield Exploration Company | 0.01 | 0.22 | 0.5510 | 0.5510 | |||||
| / Sina Corp. | 0.00 | 0.21 | 0.5237 | 0.5237 | |||||
| ENDP / Endo International plc | 0.00 | -41.51 | 0.21 | -13.28 | 0.5187 | 0.5187 | |||
| US6550441058 / Noble Energy, Inc. | 0.00 | 0.20 | 0.5063 | 0.5063 | |||||
| ABBV / AbbVie Inc. | 0.00 | -56.82 | 0.20 | -48.98 | 0.4989 | 0.4989 | |||
| TXT / Textron Inc. | 0.01 | -50.46 | 0.20 | -33.89 | 0.4939 | 0.4939 | |||
| DGX / Quest Diagnostics Incorporated | 0.00 | -5.26 | 0.19 | -16.09 | 0.4790 | 0.4790 | |||
| KMX / CarMax, Inc. | 0.00 | -80.10 | 0.18 | -80.67 | 0.4443 | 0.4443 | |||
| CLF / Cleveland-Cliffs Inc. | 0.01 | -69.37 | 0.18 | -60.88 | 0.4418 | 0.4418 | |||
| LULU / lululemon athletica inc. | 0.00 | 0.18 | 0.4393 | 0.4393 | |||||
| IEP / Icahn Enterprises L.P. | 0.00 | 0.17 | 0.4344 | 0.4344 | |||||
| BHP / BHP Group Limited - Depositary Receipt (Common Stock) | 0.00 | 0.17 | 0.4244 | 0.4244 | |||||
| ADSK / Autodesk, Inc. | 0.00 | -72.13 | 0.17 | -58.70 | 0.4244 | 0.4244 | |||
| MRO / Marathon Oil Corporation | 0.00 | -60.98 | 0.17 | -60.61 | 0.4195 | 0.4195 | |||
| MHK / Mohawk Industries, Inc. | 0.00 | 0.16 | 0.4070 | 0.4070 | |||||
| WFM / Whole Foods Market, Inc. | 0.00 | 0.15 | 0.3723 | 0.3723 | |||||
| CME / CME Group Inc. | 0.00 | 0.13 | 0.3127 | 0.3127 | |||||
| ANDV / Andeavor Corp. | 0.00 | -66.67 | 0.12 | -62.73 | 0.3053 | 0.3053 | |||
| SFUN / Fang Holdings Ltd - ADR | 0.00 | 0.12 | 0.2854 | 0.2854 | |||||
| FE / FirstEnergy Corp. | 0.00 | -73.08 | 0.12 | -76.29 | 0.2854 | 0.2854 | |||
| UNH / UnitedHealth Group Incorporated | 0.00 | 0.11 | 0.2805 | 0.2805 | |||||
| TJX / The TJX Companies, Inc. | 0.00 | 0.11 | 0.2681 | 0.2681 | |||||
| TSLA / Tesla, Inc. | 0.00 | 0.10 | 0.2606 | 0.2606 | |||||
| BKE / The Buckle, Inc. | 0.00 | 0.08 | 0.2085 | 0.2085 | |||||
| MA / Mastercard Incorporated | 0.00 | 0.08 | 0.2085 | 0.2085 | |||||
| CB / Chubb Limited | 0.00 | 0.08 | 0.2060 | 0.2060 | |||||
| AMGN / Amgen Inc. | 0.00 | -94.37 | 0.05 | -94.21 | 0.1142 | 0.1142 | |||
| HCC / Warrior Met Coal, Inc. | 0.00 | 0.04 | 0.1067 | 0.1067 | |||||
| ADM / Archer-Daniels-Midland Company | 0.00 | 0.04 | 0.1067 | 0.1067 | |||||
| T / AT&T Inc. | 0.00 | -81.54 | 0.04 | -80.91 | 0.1042 | -0.0638 | |||
| CALM / Cal-Maine Foods, Inc. | 0.00 | 0.04 | 0.1042 | 0.1042 | |||||
| / Sina Corp. | 0.00 | 0.04 | 0.1042 | 0.1042 | |||||
| SIEGY / Siemens Aktiengesellschaft - Depositary Receipt (Common Stock) | 0.00 | 0.04 | 0.1042 | 0.1042 | |||||
| ABT / Abbott Laboratories | 0.00 | -96.32 | 0.04 | -95.77 | 0.1042 | -0.6534 | |||
| ROP / Roper Technologies, Inc. | 0.00 | 0.04 | 0.1042 | 0.1042 | |||||
| HP / Helmerich & Payne, Inc. | 0.00 | 0.04 | 0.1042 | 0.1042 | |||||
| PGR / The Progressive Corporation | 0.00 | 0.04 | 0.1018 | 0.1018 | |||||
| HRL / Hormel Foods Corporation | 0.00 | 0.04 | 0.1018 | 0.1018 | |||||
| PNM / PNM Resources, Inc. | 0.00 | 0.04 | 0.1018 | 0.1018 | |||||
| BA / The Boeing Company | 0.00 | -89.66 | 0.04 | -87.98 | 0.1018 | 0.1018 | |||
| PMT / PennyMac Mortgage Investment Trust | 0.00 | 0.04 | 0.1018 | 0.1018 | |||||
| OGE / OGE Energy Corp. | 0.00 | 0.04 | 0.1018 | 0.1018 | |||||
| MLHR / Herman Miller Inc. | 0.00 | 0.04 | 0.1018 | 0.1018 | |||||
| AET / Aetna, Inc. | 0.00 | -93.26 | 0.04 | -92.81 | 0.1018 | 0.1018 | |||
| LNC / Lincoln National Corporation | 0.00 | 0.04 | 0.1018 | 0.1018 | |||||
| STAG / STAG Industrial, Inc. | 0.00 | 0.04 | 0.1018 | 0.1018 | |||||
| / Cantel Medical Corp. | 0.00 | 0.04 | 0.1018 | 0.1018 | |||||
| PFE / Pfizer Inc. | 0.00 | -92.97 | 0.04 | -92.28 | 0.0993 | 0.0993 | |||
| GGG / Graco Inc. | 0.00 | 0.04 | 0.0968 | 0.0968 | |||||
| US9300591008 / Waddell & Reed Financial, Inc. | 0.00 | 0.04 | 0.0968 | 0.0968 | |||||
| BAMH / Brookfield Finance Inc - 4.625% NT REDEEM 16/10/2080 USD 25 | 0.00 | 0.04 | 0.0968 | 0.0968 | |||||
| ZTS / Zoetis Inc. | 0.00 | 0.04 | 0.0968 | 0.0968 | |||||
| MCO / Moody's Corporation | 0.00 | 0.04 | 0.0968 | 0.0968 | |||||
| MORN / Morningstar, Inc. | 0.00 | 0.04 | 0.0968 | 0.0968 | |||||
| UVV / Universal Corporation | 0.00 | 0.04 | 0.0943 | 0.0943 | |||||
| ALV / Autoliv, Inc. | 0.00 | 0.04 | 0.0918 | 0.0918 | |||||
| CMTL / Comtech Telecommunications Corp. | 0.00 | 0.02 | 0.0546 | 0.0546 | |||||
| OFG / OFG Bancorp | 0.00 | 0.02 | 0.0521 | 0.0521 | |||||
| NP / Neenah Inc | 0.00 | 0.02 | 0.0521 | 0.0521 | |||||
| WY / Weyerhaeuser Company | 0.00 | 0.02 | 0.0472 | 0.0472 | |||||
| CNC / Centene Corporation | 0.00 | 0.01 | 0.0298 | 0.0298 | |||||
| LKFN / Lakeland Financial Corporation | 0.00 | 0.01 | 0.0298 | 0.0298 | |||||
| UGI / UGI Corporation | 0.00 | 0.01 | 0.0298 | 0.0298 | |||||
| MAS / Masco Corporation | 0.00 | -96.93 | 0.01 | -96.83 | 0.0273 | -0.2377 | |||
| IRC / Inland Real Estate Corporation | 0.00 | 0.01 | 0.0273 | 0.0273 | |||||
| / Sina Corp. | 0.00 | -98.59 | 0.01 | -98.76 | 0.0273 | -0.6487 | |||
| CKEC / Carmike Cinemas, Inc. | 0.00 | 0.01 | 0.0273 | 0.0273 | |||||
| CHK / Chesapeake Energy Corporation | 0.00 | -96.55 | 0.01 | -96.33 | 0.0273 | -0.2018 | |||
| ABG / Asbury Automotive Group, Inc. | 0.00 | 0.01 | 0.0273 | 0.0273 | |||||
| ONB / Old National Bancorp | 0.00 | 0.01 | 0.0273 | 0.0273 | |||||
| NMFC / New Mountain Finance Corporation | 0.00 | 0.01 | 0.0273 | 0.0273 | |||||
| NS / NuStar Energy L.P. - Limited Partnership | 0.00 | 0.01 | 0.0248 | 0.0248 | |||||
| RPAI / Retail Properties of America Inc - Class A | 0.00 | 0.01 | 0.0248 | 0.0248 | |||||
| GBDC / Golub Capital BDC, Inc. | 0.00 | 0.01 | 0.0248 | 0.0248 | |||||
| GRC / The Gorman-Rupp Company | 0.00 | 0.01 | 0.0248 | 0.0248 | |||||
| NPBC / National Penn Bancshares, Inc. | 0.00 | 0.01 | 0.0248 | 0.0248 | |||||
| RLJ / RLJ Lodging Trust | 0.00 | 0.01 | 0.0248 | 0.0248 | |||||
| SAIC / Science Applications International Corporation | 0.00 | 0.01 | 0.0248 | 0.0248 | |||||
| LCI / Lannett Co., Inc. | 0.00 | 0.01 | 0.0248 | 0.0248 | |||||
| COR / Cencora, Inc. | 0.00 | 0.01 | 0.0248 | 0.0248 | |||||
| AFSIC / AmTrust Financial Services, Inc. - Preferred Stock | 0.00 | 0.01 | 0.0248 | 0.0248 | |||||
| CMLP / Crestwood Midstream Partners Lp | 0.00 | 0.01 | 0.0248 | 0.0248 | |||||
| OFC / Corporate Office Properties Trust | 0.00 | 0.01 | 0.0223 | 0.0223 | |||||
| ADC / Agree Realty Corporation | 0.00 | 0.01 | 0.0223 | 0.0223 | |||||
| GLF / GulfMark Offshore, Inc. | 0.00 | 0.01 | 0.0223 | 0.0223 | |||||
| PSIX / Power Solutions International, Inc. | 0.00 | 0.01 | 0.0199 | 0.0199 | |||||
| SBSI / Southside Bancshares, Inc. | 0.00 | 0.01 | 0.0199 | 0.0199 | |||||
| CLMS / Calamos Asset Management, Inc. | 0.00 | 0.01 | 0.0174 | 0.0174 | |||||
| ERIE / Erie Indemnity Company | 0.00 | 0.01 | 0.0174 | 0.0174 | |||||
| RH / RH | 0.00 | 0.01 | 0.0174 | 0.0174 | |||||
| DMLP / Dorchester Minerals, L.P. - Limited Partnership | 0.00 | 0.01 | 0.0124 | 0.0124 | |||||
| XOM / Exxon Mobil Corporation | 0.00 | -100.00 | 0.00 | -100.00 | -0.2498 | ||||
| CAT / Caterpillar Inc. | 0.00 | -100.00 | 0.00 | -100.00 | -0.5033 | ||||
| NSC / Norfolk Southern Corporation | 0.00 | -100.00 | 0.00 | -100.00 | -0.2834 | ||||
| MKC / McCormick & Company, Incorporated | 0.00 | -100.00 | 0.00 | -100.00 | -0.7860 | ||||
| MCD / McDonald's Corporation | 0.00 | -100.00 | 0.00 | -100.00 | -0.6615 | ||||
| GLW / Corning Incorporated | 0.00 | -100.00 | 0.00 | -100.00 | -0.2773 | ||||
| BLL / Ball Corp. | 0.00 | -100.00 | 0.00 | -100.00 | -0.2093 | ||||
| CVS / CVS Health Corporation | 0.00 | -100.00 | 0.00 | -100.00 | -0.1558 | ||||
| STT / State Street Corporation | 0.00 | -100.00 | 0.00 | -100.00 | -0.5622 | ||||
| FFIV / F5, Inc. | 0.00 | -100.00 | 0.00 | -100.00 | -0.2750 | ||||
| MS / Morgan Stanley | 0.00 | -100.00 | 0.00 | -100.00 | -0.4018 | ||||
| FCX / Freeport-McMoRan Inc. | 0.00 | -100.00 | 0.00 | -100.00 | -0.2429 | ||||
| ANF / Abercrombie & Fitch Co. | 0.00 | -100.00 | 0.00 | -100.00 | -0.2834 | ||||
| CAIAF / CA Immobilien Anlagen AG | 0.00 | -100.00 | 0.00 | -100.00 | -0.2314 | ||||
| ATVI / Activision Blizzard Inc | 0.00 | -100.00 | 0.00 | -100.00 | -0.3277 | ||||
| LLY / Eli Lilly and Company | 0.00 | -100.00 | 0.00 | -100.00 | -0.4461 | ||||
| 61166W101 / Monsanto Co. | 0.00 | -100.00 | 0.00 | -100.00 | -0.8532 | ||||
| GS / The Goldman Sachs Group, Inc. | 0.00 | -100.00 | 0.00 | -100.00 | -0.4835 | ||||
| US8865471085 / Tiffany & Co. | 0.00 | -100.00 | 0.00 | -100.00 | -0.2513 | ||||
| PCG / PG&E Corporation | 0.00 | -100.00 | 0.00 | -100.00 | -0.3032 | ||||
| TXN / Texas Instruments Incorporated | 0.00 | -100.00 | 0.00 | -100.00 | -0.5568 | ||||
| XEL / Xcel Energy Inc. | 0.00 | -100.00 | 0.00 | -100.00 | -0.2383 | ||||
| BF.B / Brown-Forman Corporation | 0.00 | -100.00 | 0.00 | -100.00 | -0.2650 | ||||
| WDC / Western Digital Corporation | 0.00 | -100.00 | 0.00 | -100.00 | -0.2857 | ||||
| PG / The Procter & Gamble Company | 0.00 | -100.00 | 0.00 | -100.00 | -0.2887 | ||||
| DIS / The Walt Disney Company | 0.00 | -100.00 | 0.00 | -100.00 | -0.5270 | ||||
| CVX / Chevron Corporation | 0.00 | -100.00 | 0.00 | -100.00 | -0.3529 | ||||
| INTC / Intel Corporation | 0.00 | -100.00 | 0.00 | -100.00 | -0.4514 | ||||
| NTRS / Northern Trust Corporation | 0.00 | -100.00 | 0.00 | -100.00 | -0.2330 | ||||
| SPG / Simon Property Group, Inc. | 0.00 | -100.00 | 0.00 | -100.00 | -0.3055 | ||||
| VLO / Valero Energy Corporation | 0.00 | -100.00 | 0.00 | -100.00 | -0.5033 | ||||
| VZ / Verizon Communications Inc. | 0.00 | -100.00 | 0.00 | -100.00 | -0.7310 | ||||
| CSX / CSX Corporation | 0.00 | -100.00 | 0.00 | -100.00 | -0.1871 | ||||
| BXP / Boston Properties, Inc. | 0.00 | -100.00 | 0.00 | -100.00 | -0.3918 | ||||
| EA / Electronic Arts Inc. | 0.00 | -100.00 | 0.00 | -100.00 | -0.6729 | ||||
| FITB / Fifth Third Bancorp | 0.00 | -100.00 | 0.00 | -100.00 | -0.2070 |