Mga Batayang Estadistika
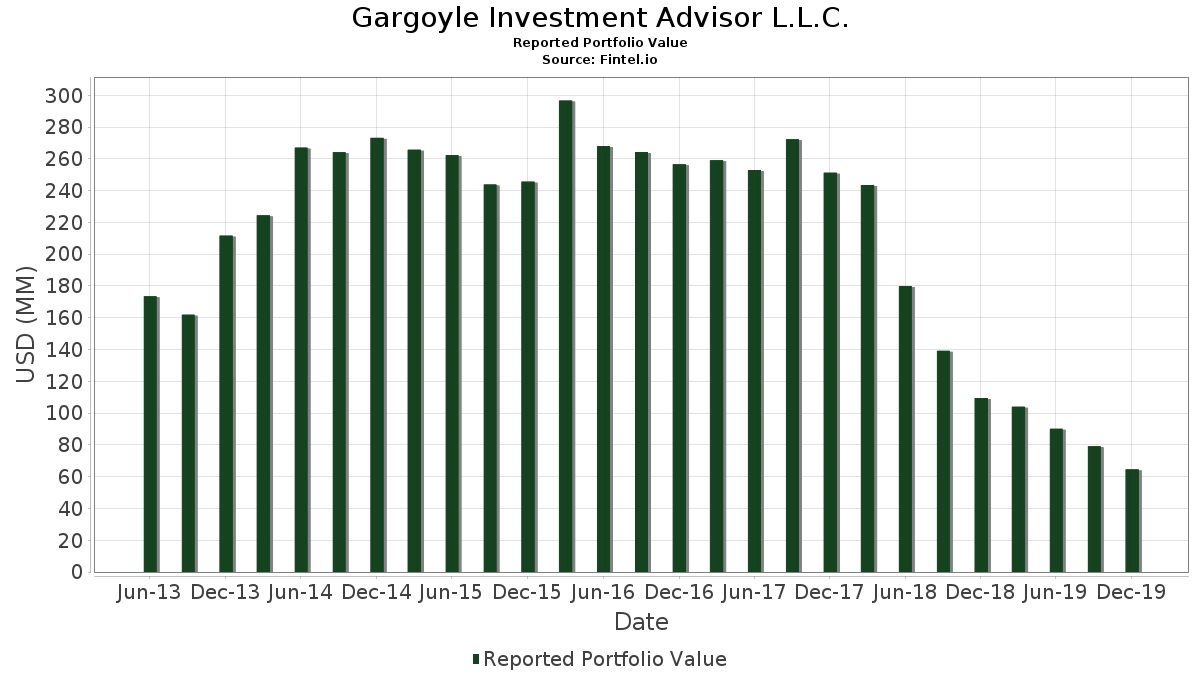
| Nilai Portofolio | $ 64,572,000 |
| Posisi Saat Ini | 85 |
Kepemilikan Terbaru, Kinerja, AUM (dari 13F, 13D)
Gargoyle Investment Advisor L.L.C. telah mengungkapkan total kepemilikan 85 dalam pengajuan SEC terbaru mereka. Nilai portofolio terbaru dihitung sebesar $ 64,572,000 USD. Aset yang Dikelola (AUM) sebenarnya adalah nilai ini ditambah kas (yang tidak diungkapkan). Aset-aset utama Gargoyle Investment Advisor L.L.C. adalah United Rentals, Inc. (US:URI) , Citigroup Inc. (US:C) , Stericycle, Inc. (US:SRCL) , Micron Technology, Inc. (US:MU) , and DISH Network Corporation (US:DISH) . Posisi baru Gargoyle Investment Advisor L.L.C. meliputi: ViacomCBS Inc (US:) , .
Peningkatan Tertinggi Kuartal Ini
Kami menggunakan perubahan dalam alokasi portofolio karena ini adalah metrik yang paling bermakna. Perubahan dapat disebabkan oleh perdagangan atau perubahan harga saham.
| Keamanan | Saham (MM) |
Nilai (Juta Dolar AS) |
Portfolio % | ΔPorsyento ng Portfolio |
|---|---|---|---|---|
| 0.03 | 1.07 | 1.6586 | 1.6586 | |
| 0.01 | 0.64 | 0.9834 | 0.9834 | |
| 0.02 | 0.48 | 0.7496 | 0.7496 | |
| 0.01 | 0.46 | 0.7139 | 0.7139 | |
| 0.01 | 0.46 | 0.7093 | 0.7093 | |
| 0.01 | 0.43 | 0.6628 | 0.6628 | |
| 0.02 | 1.45 | 2.2394 | 0.6600 | |
| 0.01 | 1.48 | 2.2951 | 0.6400 | |
| 0.01 | 0.37 | 0.5684 | 0.5684 | |
| 0.01 | 0.97 | 1.5068 | 0.4632 |
Penurunan Tertinggi Kuartal Ini
Kami menggunakan perubahan dalam alokasi portofolio karena ini adalah metrik yang paling bermakna. Perubahan dapat disebabkan oleh perdagangan atau perubahan harga saham.
| Keamanan | Saham (MM) |
Nilai (Juta Dolar AS) |
Portfolio % | ΔPorsyento ng Portfolio |
|---|---|---|---|---|
| 0.00 | 0.00 | -1.3961 | ||
| 0.00 | 0.00 | -1.2913 | ||
| 0.00 | 0.00 | -0.9463 | ||
| 0.01 | 0.36 | 0.5591 | -0.9407 | |
| 0.00 | 0.00 | -0.8642 | ||
| 0.00 | 0.00 | -0.7783 | ||
| 0.00 | 0.00 | -0.6608 | ||
| 0.00 | 0.00 | -0.5420 | ||
| 0.00 | 0.00 | -0.5218 | ||
| 0.00 | 0.00 | -0.5155 |
Pengajuan 13F dan Dana
Formulir ini diajukan pada 2020-02-18 untuk periode pelaporan 2019-12-31. Klik ikon tautan untuk melihat riwayat transaksi selengkapnya.
Tingkatkan ke versi premium untuk membuka data premium dan ekspor ke Excel. ![]() .
.
| Keamanan | Ketik | Harga Saham Rata-rata | Saham (MM) |
ΔSaham (%) |
ΔSaham (%) |
Nilai ($MM) |
Portpolyo (%) |
ΔPortofolio (%) |
|
|---|---|---|---|---|---|---|---|---|---|
| URI / United Rentals, Inc. | 0.01 | -15.42 | 1.48 | 13.13 | 2.2951 | 0.6400 | |||
| C / Citigroup Inc. | 0.02 | 0.00 | 1.45 | 15.68 | 2.2394 | 0.6600 | |||
| SRCL / Stericycle, Inc. | 0.02 | -23.38 | 1.40 | -4.04 | 2.1697 | 0.3250 | |||
| MU / Micron Technology, Inc. | 0.02 | -16.75 | 1.34 | 4.53 | 2.0706 | 0.4546 | |||
| DISH / DISH Network Corporation | 0.04 | -3.19 | 1.27 | 0.79 | 1.9699 | 0.3754 | |||
| NUAN / Nuance Communications Inc | 0.07 | -20.26 | 1.23 | -12.78 | 1.9018 | 0.1228 | |||
| ESNT / Essent Group Ltd. | 0.02 | -5.98 | 1.23 | 2.59 | 1.8987 | 0.3888 | |||
| CAG / Conagra Brands, Inc. | 0.03 | -21.19 | 1.15 | -12.05 | 1.7748 | 0.1285 | |||
| DKS / DICK'S Sporting Goods, Inc. | 0.02 | -28.19 | 1.12 | -12.94 | 1.7299 | 0.1088 | |||
| SF / Stifel Financial Corp. | 0.02 | 0.00 | 1.08 | 5.65 | 1.6803 | 0.3827 | |||
| / ViacomCBS Inc | 0.03 | 1.07 | 1.6586 | 1.6586 | |||||
| AN / AutoNation, Inc. | 0.02 | -13.23 | 1.06 | -16.78 | 1.6431 | 0.0322 | |||
| ZBH / Zimmer Biomet Holdings, Inc. | 0.01 | -12.37 | 1.06 | -4.50 | 1.6416 | 0.2391 | |||
| BKR / Baker Hughes Company | 0.04 | -19.27 | 1.05 | -10.83 | 1.6199 | 0.1379 | |||
| US7587501039 / Regal-Beloit Corp. | 0.01 | -15.02 | 1.04 | -0.19 | 1.6168 | 0.2952 | |||
| OTEX / Open Text Corporation | 0.02 | -24.20 | 1.02 | -18.11 | 1.5827 | 0.0059 | |||
| PACW / Pacwest Bancorp | 0.03 | 0.00 | 1.00 | 5.35 | 1.5549 | 0.3508 | |||
| T / AT&T Inc. | 0.03 | -14.96 | 0.99 | -12.18 | 1.5409 | 0.1094 | |||
| BIIB / Biogen Inc. | 0.00 | -13.03 | 0.99 | 10.86 | 1.5332 | 0.4049 | |||
| EMN / Eastman Chemical Company | 0.01 | -32.03 | 0.98 | -27.06 | 1.5239 | -0.1805 | |||
| CVS / CVS Health Corporation | 0.01 | 0.00 | 0.97 | 17.80 | 1.5068 | 0.4632 | |||
| ARW / Arrow Electronics, Inc. | 0.01 | 0.00 | 0.97 | 13.57 | 1.5037 | 0.4235 | |||
| CHKP / Check Point Software Technologies Ltd. | 0.01 | 0.00 | 0.95 | 1.28 | 1.4697 | 0.2858 | |||
| DAL / Delta Air Lines, Inc. | 0.02 | 0.00 | 0.94 | 1.51 | 1.4542 | 0.2855 | |||
| ORCL / Oracle Corporation | 0.02 | -7.08 | 0.94 | -10.60 | 1.4495 | 0.1267 | |||
| TOL / Toll Brothers, Inc. | 0.02 | -26.83 | 0.93 | -29.58 | 1.4449 | -0.2292 | |||
| MAN / ManpowerGroup Inc. | 0.01 | 0.00 | 0.93 | 15.32 | 1.4341 | 0.4195 | |||
| MKSI / MKS Inc. | 0.01 | -5.64 | 0.92 | 12.47 | 1.4248 | 0.3913 | |||
| MS / Morgan Stanley | 0.02 | -42.06 | 0.92 | -30.61 | 1.4217 | -0.2499 | |||
| HUN / Huntsman Corporation | 0.04 | -31.43 | 0.90 | -28.80 | 1.3938 | -0.2032 | |||
| STLD / Steel Dynamics, Inc. | 0.03 | -26.02 | 0.89 | -15.52 | 1.3737 | 0.0470 | |||
| AMP / Ameriprise Financial, Inc. | 0.01 | 0.00 | 0.88 | 13.24 | 1.3644 | 0.3814 | |||
| AL / Air Lease Corporation | 0.02 | -22.49 | 0.87 | -11.90 | 1.3411 | 0.0992 | |||
| LRCX / Lam Research Corporation | 0.00 | -39.07 | 0.84 | -22.90 | 1.3086 | -0.0761 | |||
| LEA / Lear Corporation | 0.01 | -22.27 | 0.83 | -9.54 | 1.2916 | 0.1267 | |||
| SYNH / Syneos Health Inc - Class A | 0.01 | 0.00 | 0.83 | 11.83 | 1.2885 | 0.3485 | |||
| ALSN / Allison Transmission Holdings, Inc. | 0.02 | -43.08 | 0.83 | -41.57 | 1.2885 | -0.5107 | |||
| COF / Capital One Financial Corporation | 0.01 | -41.56 | 0.82 | -33.89 | 1.2776 | -0.2991 | |||
| XRAY / DENTSPLY SIRONA Inc. | 0.01 | 0.00 | 0.81 | 6.15 | 1.2560 | 0.2907 | |||
| ACM / AECOM | 0.02 | -5.06 | 0.81 | 9.03 | 1.2529 | 0.3154 | |||
| ASGN / ASGN Incorporated | 0.01 | -23.32 | 0.79 | -13.45 | 1.2157 | 0.0697 | |||
| GHC / Graham Holdings Company | 0.00 | 0.00 | 0.77 | -3.75 | 1.1940 | 0.1820 | |||
| COTY / Coty Inc. | 0.07 | 0.00 | 0.77 | 6.97 | 1.1878 | 0.2819 | |||
| US5249011058 / Legg Mason, Inc. | 0.02 | -34.57 | 0.76 | -38.44 | 1.1832 | -0.3848 | |||
| US54142L1098 / LogMein, Inc. | 0.01 | -31.98 | 0.75 | -17.80 | 1.1584 | 0.0087 | |||
| BKU / BankUnited, Inc. | 0.02 | 0.00 | 0.72 | 8.73 | 1.1181 | 0.2792 | |||
| NCR / NCR Corp. | 0.02 | -37.83 | 0.72 | -30.75 | 1.1088 | -0.1976 | |||
| THO / THOR Industries, Inc. | 0.01 | 0.00 | 0.71 | 31.18 | 1.1011 | 0.4163 | |||
| IVZ / Invesco Ltd. | 0.04 | -41.76 | 0.70 | -38.14 | 1.0825 | -0.3452 | |||
| PAG / Penske Automotive Group, Inc. | 0.01 | -47.45 | 0.70 | -44.19 | 1.0779 | -0.4977 | |||
| WDC / Western Digital Corporation | 0.01 | 0.00 | 0.68 | 6.41 | 1.0546 | 0.2460 | |||
| JAZZ / Jazz Pharmaceuticals plc | 0.00 | 0.00 | 0.66 | 16.43 | 1.0206 | 0.3055 | |||
| PRGO / Perrigo Company plc | 0.01 | 0.00 | 0.66 | -7.57 | 1.0206 | 0.1197 | |||
| FFIV / F5, Inc. | 0.00 | -35.91 | 0.66 | -36.28 | 1.0144 | -0.2845 | |||
| ANAT / American National Group, Inc. | 0.01 | 0.00 | 0.65 | -4.86 | 1.0004 | 0.1425 | |||
| BMY / Bristol-Myers Squibb Company | 0.01 | 0.00 | 0.64 | 26.49 | 0.9834 | 0.9834 | |||
| BHC / Bausch Health Companies Inc. | 0.02 | 0.00 | 0.63 | 36.90 | 0.9710 | 0.3923 | |||
| F / Ford Motor Company | 0.07 | -5.26 | 0.62 | -3.71 | 0.9648 | 0.1474 | |||
| PRU / Prudential Financial, Inc. | 0.01 | 0.00 | 0.60 | 4.33 | 0.9323 | 0.2033 | |||
| CI / The Cigna Group | 0.00 | 0.00 | 0.57 | 34.83 | 0.8812 | 0.3480 | |||
| YELP / Yelp Inc. | 0.02 | 0.00 | 0.56 | 0.18 | 0.8719 | 0.1618 | |||
| PVH / PVH Corp. | 0.01 | 0.00 | 0.53 | 19.33 | 0.8223 | 0.2601 | |||
| GM / General Motors Company | 0.01 | 0.00 | 0.52 | -2.43 | 0.8069 | 0.1322 | |||
| MFC / HEXAOM | 0.02 | 0.00 | 0.48 | 10.50 | 0.7496 | 0.7496 | |||
| TAP / Molson Coors Beverage Company | 0.01 | 0.00 | 0.47 | -6.35 | 0.7310 | 0.0942 | |||
| ST / Sensata Technologies Holding plc | 0.01 | 0.00 | 0.47 | 7.60 | 0.7232 | 0.1749 | |||
| CMA / Comerica Incorporated | 0.01 | 0.00 | 0.46 | 8.73 | 0.7139 | 0.7139 | |||
| NCLH / Norwegian Cruise Line Holdings Ltd. | 0.01 | 0.00 | 0.46 | 12.81 | 0.7093 | 0.7093 | |||
| FLEX / Flex Ltd. | 0.04 | 0.00 | 0.45 | 20.53 | 0.7000 | 0.2262 | |||
| OC / Owens Corning | 0.01 | 0.00 | 0.45 | 2.99 | 0.6938 | 0.1442 | |||
| MOS / The Mosaic Company | 0.02 | 0.00 | 0.44 | 5.56 | 0.6768 | 0.1537 | |||
| HSIC / Henry Schein, Inc. | 0.01 | 0.00 | 0.43 | 4.90 | 0.6628 | 0.6628 | |||
| AIG / American International Group, Inc. | 0.01 | 0.00 | 0.41 | -7.87 | 0.6350 | 0.0727 | |||
| WLK / Westlake Corporation | 0.01 | -29.09 | 0.40 | -24.10 | 0.6195 | -0.0464 | |||
| R / Ryder System, Inc. | 0.01 | -30.00 | 0.40 | -26.53 | 0.6133 | -0.0677 | |||
| SNX / TD SYNNEX Corporation | 0.00 | 0.00 | 0.39 | 13.91 | 0.6086 | 0.1727 | |||
| BWA / BorgWarner Inc. | 0.01 | 0.00 | 0.38 | 18.24 | 0.5823 | 0.1805 | |||
| IMO / Imperial Oil Limited | 0.01 | 0.00 | 0.37 | 1.66 | 0.5684 | 0.5684 | |||
| THS / TreeHouse Foods, Inc. | 0.01 | -65.19 | 0.36 | -69.59 | 0.5591 | -0.9407 | |||
| SNA / Snap-on Incorporated | 0.00 | 0.00 | 0.35 | 8.36 | 0.5420 | 0.1339 | |||
| IBM / International Business Machines Corporation | 0.00 | -52.20 | 0.34 | -55.99 | 0.5234 | -0.4469 | |||
| REGN / Regeneron Pharmaceuticals, Inc. | 0.00 | -50.59 | 0.28 | -33.10 | 0.4383 | -0.0962 | |||
| XEC / Cimarex Energy Co. | 0.00 | -48.19 | 0.23 | -43.22 | 0.3500 | 0.3500 | |||
| SATS / EchoStar Corporation | 0.01 | 0.22 | 0.3361 | 0.3361 | |||||
| DGP / DB Gold Double Long ETN | 0.02 | -59.25 | 0.19 | -57.64 | 0.3004 | -0.2782 | |||
| PCG / PG&E Corporation | 0.00 | -100.00 | 0.00 | -100.00 | -0.3247 | ||||
| APA / APA Corporation | 0.00 | -100.00 | 0.00 | -100.00 | -0.5142 | ||||
| ECA / EnCana Corp. | 0.00 | -100.00 | 0.00 | 0.0000 | |||||
| L / Loews Corporation | 0.00 | -100.00 | 0.00 | -100.00 | -0.4258 | ||||
| KMPR / Kemper Corporation | 0.00 | -100.00 | 0.00 | -100.00 | -0.4397 | ||||
| CDK / CDK Global Inc | 0.00 | -100.00 | 0.00 | -100.00 | -1.3961 | ||||
| ADS / Bread Financial Holdings Inc | 0.00 | -100.00 | 0.00 | -100.00 | -0.5420 | ||||
| ADM / Archer-Daniels-Midland Company | 0.00 | -100.00 | 0.00 | -100.00 | -0.7783 | ||||
| UTHR / United Therapeutics Corporation | 0.00 | -100.00 | 0.00 | -100.00 | -0.5218 | ||||
| 19041P105 / CBS Corp. | 0.00 | -100.00 | 0.00 | -100.00 | -0.6608 | ||||
| SJRWF / Shaw Communications Inc. - Class A | 0.00 | -100.00 | 0.00 | 0.0000 | |||||
| AMCX / AMC Networks Inc. | 0.00 | -100.00 | 0.00 | -100.00 | -0.5155 | ||||
| SABR / Sabre Corporation | 0.00 | -100.00 | 0.00 | -100.00 | -0.9463 | ||||
| GS / The Goldman Sachs Group, Inc. | 0.00 | -100.00 | 0.00 | -100.00 | -0.8642 | ||||
| MD / Pediatrix Medical Group, Inc. | 0.00 | -100.00 | 0.00 | -100.00 | -0.4751 | ||||
| ALL / The Allstate Corporation | 0.00 | -100.00 | 0.00 | -100.00 | -0.2742 | ||||
| VIAB / Viacom, Inc. | 0.00 | -100.00 | 0.00 | -100.00 | -1.2913 | ||||
| OLN / Olin Corporation | 0.00 | -100.00 | 0.00 | -100.00 | -0.2956 | ||||
| EQT / EQT Corporation | 0.00 | -100.00 | 0.00 | -100.00 | -0.5142 | ||||
| M / Macy's, Inc. | 0.00 | -100.00 | 0.00 | -100.00 | -0.4296 |