Mga Batayang Estadistika
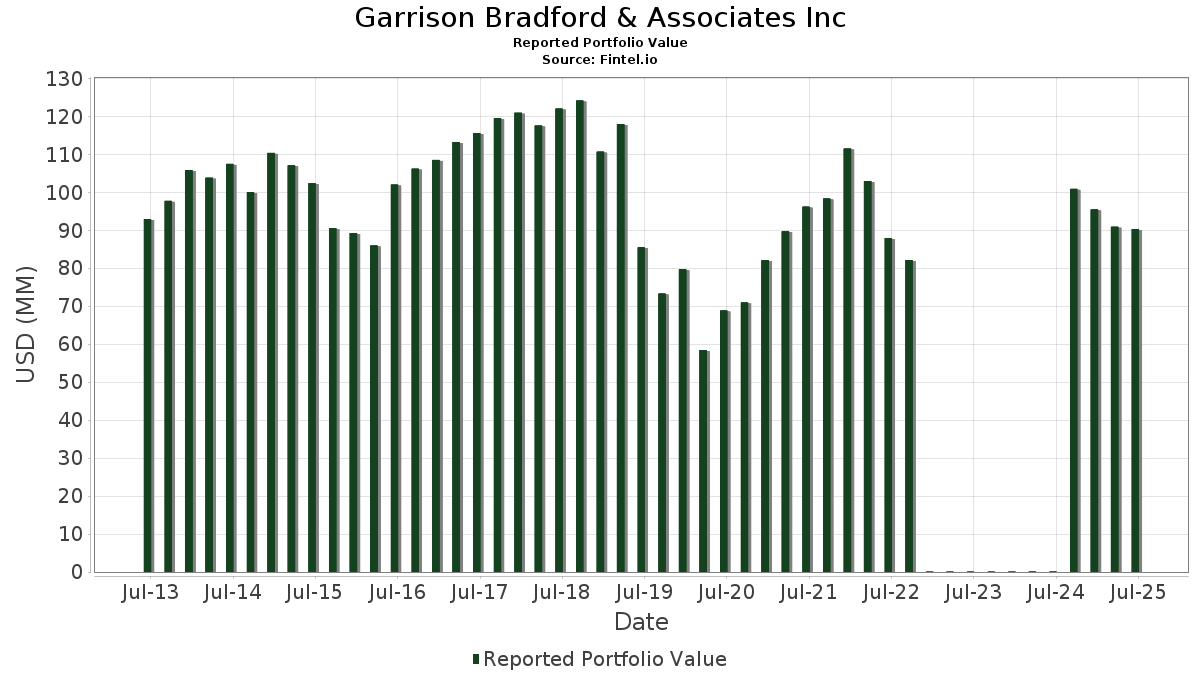
| Nilai Portofolio | $ 90,313,174 |
| Posisi Saat Ini | 58 |
Kepemilikan Terbaru, Kinerja, AUM (dari 13F, 13D)
Garrison Bradford & Associates Inc telah mengungkapkan total kepemilikan 58 dalam pengajuan SEC terbaru mereka. Nilai portofolio terbaru dihitung sebesar $ 90,313,174 USD. Aset yang Dikelola (AUM) sebenarnya adalah nilai ini ditambah kas (yang tidak diungkapkan). Aset-aset utama Garrison Bradford & Associates Inc adalah Costco Wholesale Corporation (US:COST) , Blackstone Inc. (US:BX) , Microsoft Corporation (US:MSFT) , Quanta Services, Inc. (US:PWR) , and UnitedHealth Group Incorporated (US:UNH) . Posisi baru Garrison Bradford & Associates Inc meliputi: Crown Castle Inc. (US:CCI) , .
Peningkatan Tertinggi Kuartal Ini
Kami menggunakan perubahan dalam alokasi portofolio karena ini adalah metrik yang paling bermakna. Perubahan dapat disebabkan oleh perdagangan atau perubahan harga saham.
| Keamanan | Saham (MM) |
Nilai (Juta Dolar AS) |
Portfolio % | ΔPorsyento ng Portfolio |
|---|---|---|---|---|
| 0.02 | 8.48 | 9.3897 | 3.0084 | |
| 0.02 | 9.09 | 10.0685 | 2.3669 | |
| 0.02 | 1.92 | 2.1294 | 2.1294 | |
| 0.01 | 1.53 | 1.6891 | 1.6074 | |
| 0.00 | 2.93 | 3.2434 | 1.2007 | |
| 0.02 | 4.36 | 4.8264 | 1.0797 | |
| 0.06 | 9.70 | 10.7419 | 0.9557 | |
| 0.03 | 2.54 | 2.8136 | 0.7235 | |
| 0.02 | 4.11 | 4.5537 | 0.4847 | |
| 0.02 | 0.97 | 1.0781 | 0.3544 |
Penurunan Tertinggi Kuartal Ini
Kami menggunakan perubahan dalam alokasi portofolio karena ini adalah metrik yang paling bermakna. Perubahan dapat disebabkan oleh perdagangan atau perubahan harga saham.
| Keamanan | Saham (MM) |
Nilai (Juta Dolar AS) |
Portfolio % | ΔPorsyento ng Portfolio |
|---|---|---|---|---|
| 0.03 | 8.13 | 9.0044 | -10.1655 | |
| 0.00 | 0.25 | 0.2773 | -2.2528 | |
| 0.01 | 4.20 | 4.6489 | -1.0191 | |
| 0.03 | 5.27 | 5.8324 | -0.2385 | |
| 0.00 | 1.39 | 1.5406 | -0.2154 | |
| 0.01 | 11.01 | 12.1910 | -0.2023 | |
| 0.02 | 1.19 | 1.3202 | -0.1663 | |
| 0.01 | 0.41 | 0.4547 | -0.1027 | |
| 0.00 | 0.46 | 0.5046 | -0.0807 | |
| 0.01 | 1.77 | 1.9568 | -0.0531 |
Pengajuan 13F dan Dana
Formulir ini diajukan pada 2025-08-05 untuk periode pelaporan 2025-06-30. Klik ikon tautan untuk melihat riwayat transaksi selengkapnya.
Tingkatkan ke versi premium untuk membuka data premium dan ekspor ke Excel. ![]() .
.
| Keamanan | Ketik | Harga Saham Rata-rata | Saham (MM) |
ΔSaham (%) |
ΔSaham (%) |
Nilai ($MM) |
Portpolyo (%) |
ΔPortofolio (%) |
|
|---|---|---|---|---|---|---|---|---|---|
| COST / Costco Wholesale Corporation | 0.01 | -6.63 | 11.01 | -2.27 | 12.1910 | -0.2023 | |||
| BX / Blackstone Inc. | 0.06 | 1.90 | 9.70 | 9.05 | 10.7419 | 0.9557 | |||
| MSFT / Microsoft Corporation | 0.02 | -1.98 | 9.09 | 29.88 | 10.0685 | 2.3669 | |||
| PWR / Quanta Services, Inc. | 0.02 | -1.73 | 8.48 | 46.18 | 9.3897 | 3.0084 | |||
| UNH / UnitedHealth Group Incorporated | 0.03 | -21.66 | 8.13 | -53.33 | 9.0044 | -10.1655 | |||
| ODFL / Old Dominion Freight Line, Inc. | 0.03 | -2.70 | 5.27 | -4.55 | 5.8324 | -0.2385 | |||
| AMZN / Amazon.com, Inc. | 0.02 | 10.98 | 4.36 | 27.95 | 4.8264 | 1.0797 | |||
| TMO / Thermo Fisher Scientific Inc. | 0.01 | 0.00 | 4.20 | -18.52 | 4.6489 | -1.0191 | |||
| LNG / Cheniere Energy, Inc. | 0.02 | 5.65 | 4.11 | 11.17 | 4.5537 | 0.4847 | |||
| TYL / Tyler Technologies, Inc. | 0.00 | 54.70 | 2.93 | 57.81 | 3.2434 | 1.2007 | |||
| TJX / The TJX Companies, Inc. | 0.02 | 0.00 | 2.81 | 1.41 | 3.1128 | 0.0627 | |||
| SCHW / The Charles Schwab Corporation | 0.03 | 14.74 | 2.54 | 33.74 | 2.8136 | 0.7235 | |||
| LOW / Lowe's Companies, Inc. | 0.01 | 7.13 | 2.45 | 1.96 | 2.7117 | 0.0684 | |||
| CCI / Crown Castle Inc. | 0.02 | 1.92 | 2.1294 | 2.1294 | |||||
| WELL / Welltower Inc. | 0.01 | -3.61 | 1.77 | -3.28 | 1.9568 | -0.0531 | |||
| GOOGL / Alphabet Inc. | 0.01 | 1,703.33 | 1.53 | 1,960.81 | 1.6891 | 1.6074 | |||
| AON / Aon plc | 0.00 | -2.50 | 1.39 | -12.84 | 1.5406 | -0.2154 | |||
| USFR / WisdomTree Trust - WisdomTree Floating Rate Treasury Fund | 0.02 | -11.73 | 1.19 | -11.77 | 1.3202 | -0.1663 | |||
| WWD / Woodward, Inc. | 0.00 | 0.00 | 1.10 | 34.23 | 1.2212 | 0.3179 | |||
| CG / The Carlyle Group Inc. | 0.02 | 25.51 | 0.97 | 48.10 | 1.0781 | 0.3544 | |||
| NSC / Norfolk Southern Corporation | 0.00 | 0.00 | 0.64 | 7.94 | 0.7086 | 0.0572 | |||
| HEIA / Heico Corp. - Class A | 0.00 | 0.00 | 0.58 | 22.78 | 0.6446 | 0.1225 | |||
| TFX / Teleflex Incorporated | 0.00 | 0.00 | 0.46 | -14.47 | 0.5046 | -0.0807 | |||
| EPD / Enterprise Products Partners L.P. - Limited Partnership | 0.01 | -10.78 | 0.41 | -18.97 | 0.4547 | -0.1027 | |||
| JPM / JPMorgan Chase & Co. | 0.00 | 0.00 | 0.26 | 18.18 | 0.2889 | 0.0461 | |||
| WMT / Walmart Inc. | 0.00 | 0.00 | 0.26 | 11.59 | 0.2884 | 0.0312 | |||
| XOM / Exxon Mobil Corporation | 0.00 | -87.99 | 0.25 | -89.13 | 0.2773 | -2.2528 | |||
| EBGEF / Enbridge Inc. - Preferred Stock | 0.00 | 0.00 | 0.22 | 1.83 | 0.2469 | 0.0071 | |||
| ROP / Roper Technologies, Inc. | 0.00 | 0.00 | 0.22 | -3.93 | 0.2442 | -0.0081 | |||
| KKR / KKR & Co. Inc. | 0.00 | -6.02 | 0.21 | 7.81 | 0.2299 | 0.0187 | |||
| JNJ / Johnson & Johnson | 0.00 | 0.00 | 0.19 | -7.88 | 0.2079 | -0.0163 | |||
| VO / Vanguard Index Funds - Vanguard Mid-Cap ETF | 0.00 | 0.00 | 0.17 | 7.74 | 0.1859 | 0.0152 | |||
| LDP / Cohen & Steers Limited Duration Preferred and Income Fund, Inc. | 0.01 | 0.00 | 0.15 | 2.82 | 0.1626 | 0.0058 | |||
| CVX / Chevron Corporation | 0.00 | 0.00 | 0.14 | -14.37 | 0.1585 | -0.0255 | |||
| RSG / Republic Services, Inc. | 0.00 | 0.00 | 0.12 | 1.65 | 0.1365 | 0.0033 | |||
| CQP / Cheniere Energy Partners, L.P. - Limited Partnership | 0.00 | 0.00 | 0.09 | -15.24 | 0.0993 | -0.0169 | |||
| HD / The Home Depot, Inc. | 0.00 | 50.00 | 0.08 | 51.85 | 0.0913 | 0.0309 | |||
| DFE / WisdomTree Trust - WisdomTree Europe SmallCap Dividend Fund | 0.00 | 0.00 | 0.08 | 14.93 | 0.0854 | 0.0116 | |||
| IVW / iShares Trust - iShares S&P 500 Growth ETF | 0.00 | 0.00 | 0.07 | 19.35 | 0.0825 | 0.0134 | |||
| PLTR / Palantir Technologies Inc. | 0.00 | 0.00 | 0.07 | 60.00 | 0.0808 | 0.0311 | |||
| BRK.B / Berkshire Hathaway Inc. | 0.00 | 0.00 | 0.07 | -8.86 | 0.0807 | -0.0072 | |||
| OMC / Omnicom Group Inc. | 0.00 | 0.00 | 0.07 | -13.41 | 0.0790 | -0.0115 | |||
| PGF / Invesco Exchange-Traded Fund Trust - Invesco Financial Preferred ETF | 0.01 | 0.00 | 0.07 | -1.41 | 0.0781 | -0.0004 | |||
| SRTS / Sensus Healthcare, Inc. | 0.01 | 0.00 | 0.06 | 0.00 | 0.0656 | 0.0006 | |||
| SHV / iShares Trust - iShares Short Treasury Bond ETF | 0.00 | 0.00 | 0.06 | 0.00 | 0.0611 | 0.0004 | |||
| CRM / Salesforce, Inc. | 0.00 | 0.00 | 0.05 | 1.89 | 0.0604 | 0.0013 | |||
| IVE / iShares Trust - iShares S&P 500 Value ETF | 0.00 | 0.00 | 0.05 | 2.13 | 0.0541 | 0.0017 | |||
| IGIB / iShares Trust - iShares 5-10 Year Investment Grade Corporate Bond ETF | 0.00 | 0.00 | 0.04 | 0.00 | 0.0472 | 0.0010 | |||
| SHY / iShares Trust - iShares 1-3 Year Treasury Bond ETF | 0.00 | 0.00 | 0.04 | 0.00 | 0.0459 | 0.0004 | |||
| XBI / SPDR Series Trust - SPDR S&P Biotech ETF | 0.00 | 0.00 | 0.04 | 2.56 | 0.0447 | 0.0013 | |||
| IAU / iShares Gold Trust | 0.00 | 0.00 | 0.03 | 6.90 | 0.0345 | 0.0021 | |||
| MOAT / VanEck ETF Trust - VanEck Morningstar Wide Moat ETF | 0.00 | 0.00 | 0.03 | 7.69 | 0.0312 | 0.0021 | |||
| VTIP / Vanguard Malvern Funds - Vanguard Short-Term Inflation-Protected Securities ETF | 0.00 | 0.00 | 0.03 | 4.17 | 0.0278 | 0.0004 | |||
| BND / Vanguard Bond Index Funds - Vanguard Total Bond Market ETF | 0.00 | 1.41 | 0.01 | 0.00 | 0.0117 | 0.0002 | |||
| PDI / PIMCO Dynamic Income Fund | 0.00 | -44.43 | 0.01 | -50.00 | 0.0086 | -0.0074 | |||
| HYG / iShares Trust - iShares iBoxx $ High Yield Corporate Bond ETF | 0.00 | 1.09 | 0.01 | 0.00 | 0.0083 | 0.0004 | |||
| STPZ / PIMCO ETF Trust - PIMCO 1-5 Year U.S. TIPS Index Exchange-Traded Fund | 0.00 | 0.00 | 0.00 | 0.00 | 0.0043 | 0.0000 | |||
| IBB / iShares Trust - iShares Biotechnology ETF | 0.00 | 0.00 | 0.00 | 0.00 | 0.0042 | -0.0000 | |||
| XLV / The Select Sector SPDR Trust - The Health Care Select Sector SPDR Fund | 0.00 | -100.00 | 0.00 | 0.0000 | |||||
| BROOKFIELD ASSET / (112585104) | 0.00 | -100.00 | 0.00 | 0.0000 | |||||
| AAPL / Apple Inc. | 0.00 | -100.00 | 0.00 | 0.0000 | |||||
| BN / Brookfield Corporation | 0.00 | -100.00 | 0.00 | 0.0000 |