Mga Batayang Estadistika
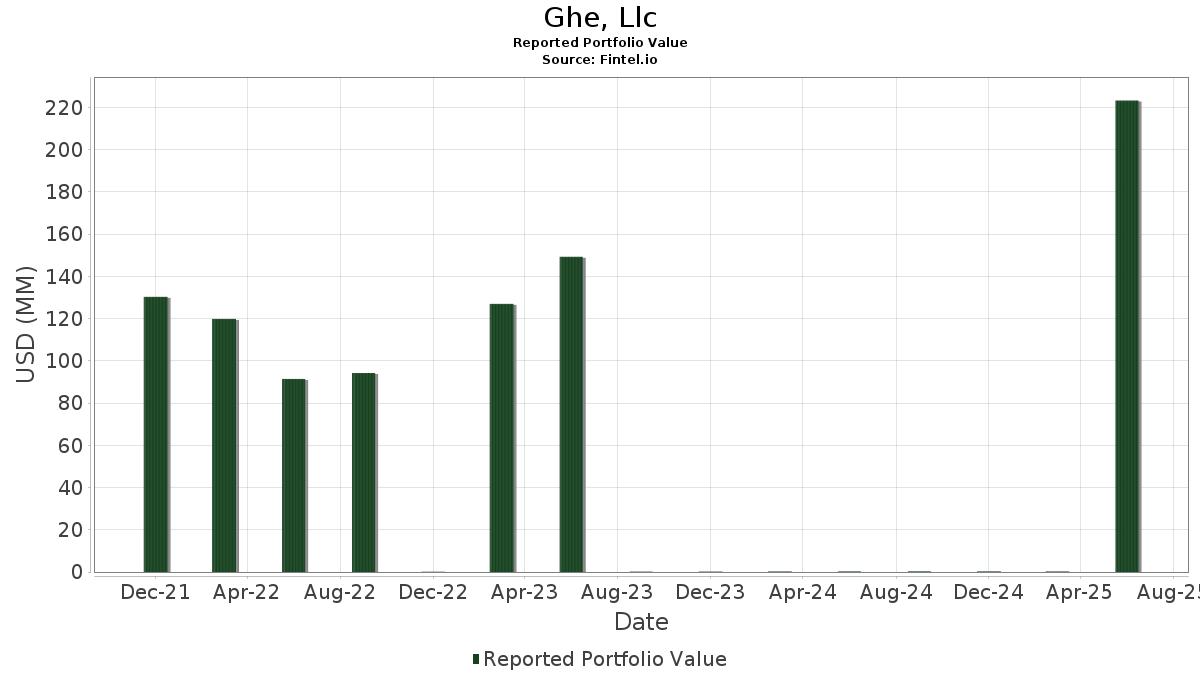
| Nilai Portofolio | $ 221,051 |
| Posisi Saat Ini | 56 |
Kepemilikan Terbaru, Kinerja, AUM (dari 13F, 13D)
Ghe, Llc telah mengungkapkan total kepemilikan 56 dalam pengajuan SEC terbaru mereka. Nilai portofolio terbaru dihitung sebesar $ 221,051 USD. Aset yang Dikelola (AUM) sebenarnya adalah nilai ini ditambah kas (yang tidak diungkapkan). Aset-aset utama Ghe, Llc adalah NVIDIA Corporation (US:NVDA) , Adobe Inc. (US:ADBE) , PIMCO Corporate & Income Strategy Fund (US:PCN) , Moody's Corporation (US:MCO) , and The Progressive Corporation (US:PGR) .
Peningkatan Tertinggi Kuartal Ini
Kami menggunakan perubahan dalam alokasi portofolio karena ini adalah metrik yang paling bermakna. Perubahan dapat disebabkan oleh perdagangan atau perubahan harga saham.
| Keamanan | Saham (MM) |
Nilai (Juta Dolar AS) |
Portfolio % | ΔPorsyento ng Portfolio |
|---|---|---|---|---|
| 0.03 | 0.01 | 3.4010 | 0.7976 | |
| 0.56 | 0.01 | 3.4802 | 0.5014 | |
| 0.04 | 0.01 | 2.5370 | 0.4043 | |
| 0.01 | 0.01 | 3.0590 | 0.3937 | |
| 0.01 | 0.01 | 2.7772 | 0.3659 | |
| 0.01 | 0.00 | 2.0262 | 0.3399 | |
| 0.02 | 0.01 | 2.3841 | 0.3390 | |
| 0.02 | 0.01 | 3.4435 | 0.3363 | |
| 0.04 | 0.00 | 1.8833 | 0.3166 | |
| 0.02 | 0.00 | 1.4766 | 0.2892 |
Penurunan Tertinggi Kuartal Ini
Kami menggunakan perubahan dalam alokasi portofolio karena ini adalah metrik yang paling bermakna. Perubahan dapat disebabkan oleh perdagangan atau perubahan harga saham.
| Keamanan | Saham (MM) |
Nilai (Juta Dolar AS) |
Portfolio % | ΔPorsyento ng Portfolio |
|---|---|---|---|---|
| 0.81 | 0.09 | 39.9568 | -5.4103 | |
| 0.03 | 0.00 | 1.0495 | -0.1933 | |
| 0.07 | 0.00 | 0.6514 | -0.1079 | |
| 0.03 | 0.00 | 0.8586 | -0.0957 | |
| 0.02 | 0.01 | 4.0719 | -0.0832 | |
| 0.02 | 0.00 | 0.8048 | -0.0719 | |
| 0.00 | 0.00 | 0.1059 | -0.0388 | |
| 0.02 | 0.00 | 0.3483 | -0.0294 | |
| 0.00 | 0.00 | 0.6831 | -0.0196 | |
| 0.01 | 0.00 | 0.7446 | -0.0195 |
Pengajuan 13F dan Dana
Formulir ini diajukan pada 2025-05-06 untuk periode pelaporan 2025-03-31. Klik ikon tautan untuk melihat riwayat transaksi selengkapnya.
Tingkatkan ke versi premium untuk membuka data premium dan ekspor ke Excel. ![]() .
.
| Keamanan | Ketik | Harga Saham Rata-rata | Saham (MM) |
ΔSaham (%) |
ΔSaham (%) |
Nilai ($MM) |
Portpolyo (%) |
ΔPortofolio (%) |
|
|---|---|---|---|---|---|---|---|---|---|
| NVDA / NVIDIA Corporation | 0.81 | -4.39 | 0.09 | -22.81 | 39.9568 | -5.4103 | |||
| ADBE / Adobe Inc. | 0.02 | -0.46 | 0.01 | -10.00 | 4.0719 | -0.0832 | |||
| PCN / PIMCO Corporate & Income Strategy Fund | 0.56 | 0.62 | 0.01 | 0.00 | 3.4802 | 0.5014 | |||
| MCO / Moody's Corporation | 0.02 | -1.31 | 0.01 | 0.00 | 3.4435 | 0.3363 | |||
| PGR / The Progressive Corporation | 0.03 | -3.10 | 0.01 | 16.67 | 3.4010 | 0.7976 | |||
| SPGI / S&P Global Inc. | 0.01 | -1.45 | 0.01 | 0.00 | 3.0590 | 0.3937 | |||
| COST / Costco Wholesale Corporation | 0.01 | -2.24 | 0.01 | 0.00 | 2.7772 | 0.3659 | |||
| MPC / Marathon Petroleum Corporation | 0.04 | -0.20 | 0.01 | 0.00 | 2.5370 | 0.4043 | |||
| LOW / Lowe's Companies, Inc. | 0.02 | -1.51 | 0.01 | 0.00 | 2.4777 | 0.1453 | |||
| ADP / Automatic Data Processing, Inc. | 0.02 | -2.16 | 0.01 | 0.00 | 2.3841 | 0.3390 | |||
| AXP / American Express Company | 0.02 | 0.82 | 0.00 | -20.00 | 2.0887 | 0.0864 | |||
| MCD / McDonald's Corporation | 0.01 | -2.30 | 0.00 | 0.00 | 2.0262 | 0.3399 | |||
| SBUX / Starbucks Corporation | 0.04 | -2.04 | 0.00 | 33.33 | 1.8833 | 0.3166 | |||
| BOOKING HOLDINGS INC COM / COMM (098571108) | 0.00 | 0.00 | 0.0000 | ||||||
| QCOM / QUALCOMM Incorporated | 0.02 | -1.86 | 0.00 | 0.00 | 1.5272 | 0.1639 | |||
| PAYX / Paychex, Inc. | 0.02 | -0.97 | 0.00 | 50.00 | 1.4766 | 0.2892 | |||
| MSCI / MSCI Inc. | 0.01 | -2.96 | 0.00 | 0.00 | 1.4074 | 0.0591 | |||
| DHI / D.R. Horton, Inc. | 0.02 | 2.32 | 0.00 | 0.00 | 1.2572 | 0.0733 | |||
| TNET / TriNet Group, Inc. | 0.03 | 2.41 | 0.00 | 0.00 | 1.1586 | 0.0231 | |||
| CB / Chubb Limited | 0.01 | -1.73 | 0.00 | 0.00 | 1.1242 | 0.2071 | |||
| ANET / Arista Networks Inc | 0.03 | 5.54 | 0.00 | -33.33 | 1.0495 | -0.1933 | |||
| CSCO / Cisco Systems, Inc. | 0.03 | -3.17 | 0.00 | 0.00 | 0.9238 | 0.1220 | |||
| ABT / Abbott Laboratories | 0.02 | -1.08 | 0.00 | 0.00 | 0.9016 | 0.2207 | |||
| CL / Colgate-Palmolive Company | 0.02 | -1.65 | 0.00 | 0.00 | 0.8876 | 0.1207 | |||
| KBH / KB Home | 0.03 | 2.05 | 0.00 | -50.00 | 0.8650 | 0.0251 | |||
| PEP / PepsiCo, Inc. | 0.01 | -0.48 | 0.00 | 0.00 | 0.8641 | 0.0928 | |||
| PYPL / PayPal Holdings, Inc. | 0.03 | 3.12 | 0.00 | -50.00 | 0.8586 | -0.0957 | |||
| JNJ / Johnson & Johnson | 0.01 | -2.40 | 0.00 | 0.00 | 0.8582 | 0.1864 | |||
| TROW / T. Rowe Price Group, Inc. | 0.02 | -0.99 | 0.00 | -50.00 | 0.8048 | -0.0719 | |||
| MAR / Marriott International, Inc. | 0.01 | -0.03 | 0.00 | 0.00 | 0.7446 | -0.0195 | |||
| BBY / Best Buy Co., Inc. | 0.02 | 7.23 | 0.00 | 0.00 | 0.6845 | 0.0329 | |||
| ULTA / Ulta Beauty, Inc. | 0.00 | 1.05 | 0.00 | 0.00 | 0.6831 | -0.0196 | |||
| GJR / Strats Trust For Procter & Gambel Security - Preferred Security | 0.01 | -1.92 | 0.00 | 0.00 | 0.6718 | 0.0813 | |||
| BZH / Beazer Homes USA, Inc. | 0.07 | 1.23 | 0.00 | 0.00 | 0.6514 | -0.1079 | |||
| SYY / Sysco Corporation | 0.02 | -0.72 | 0.00 | 0.00 | 0.5533 | 0.0555 | |||
| EBAY / eBay Inc. | 0.02 | -2.26 | 0.00 | 0.00 | 0.5098 | 0.0917 | |||
| EXPE / Expedia Group, Inc. | 0.01 | -4.11 | 0.00 | 0.00 | 0.4886 | -0.0060 | |||
| E L F BEAUTY / COMM (268561103) | 0.01 | 0.00 | 0.0000 | ||||||
| GSCE / GS Connect S&P GSCI Enhanced Commodity Total Return ETN | 0.00 | -2.51 | 0.00 | 0.4126 | 0.0238 | ||||
| DVYA / iShares, Inc. - iShares Asia/Pacific Dividend ETF | 0.02 | -1.10 | 0.00 | 0.3483 | -0.0294 | ||||
| PTY / PIMCO Corporate & Income Opportunity Fund | 0.05 | 0.00 | 0.00 | 0.3334 | 0.0433 | ||||
| SEIC / SEI Investments Company | 0.01 | -6.51 | 0.00 | 0.2995 | 0.0010 | ||||
| SPG / Simon Property Group, Inc. | 0.00 | 0.00 | 0.00 | 0.2728 | 0.0247 | ||||
| MDY / SPDR S&P MidCap 400 ETF Trust | 0.00 | 0.00 | 0.00 | 0.2411 | 0.0152 | ||||
| DSL / DoubleLine Income Solutions Fund | 0.04 | 0.00 | 0.00 | 0.2180 | 0.0278 | ||||
| HD / The Home Depot, Inc. | 0.00 | 0.00 | 0.00 | 0.2140 | 0.0150 | ||||
| AAPL / Apple Inc. | 0.00 | 124.00 | 0.00 | 0.1800 | 0.1008 | ||||
| ATGE / Adtalem Global Education Inc. | 0.00 | -1.95 | 0.00 | 0.1606 | 0.0310 | ||||
| TIP / iShares Trust - iShares TIPS Bond ETF | 0.00 | -7.53 | 0.00 | 0.1583 | 0.0141 | ||||
| PDI / PIMCO Dynamic Income Fund | 0.02 | 59.52 | 0.00 | 0.1502 | 0.0737 | ||||
| VYM / Vanguard Whitehall Funds - Vanguard High Dividend Yield ETF | 0.00 | 0.00 | 0.00 | 0.1335 | 0.0177 | ||||
| BSCQ / Invesco Exchange-Traded Self-Indexed Fund Trust - Invesco BulletShares 2026 Corporate Bond ETF | 0.01 | 0.00 | 0.00 | 0.1059 | 0.0135 | ||||
| XYZ / Block, Inc. | 0.00 | 0.00 | 0.00 | 0.1059 | -0.0388 | ||||
| WFC / Wells Fargo & Company | 0.00 | 20.25 | 0.00 | 0.0982 | 0.0280 | ||||
| STRA / Strategic Education, Inc. | 0.00 | -17.01 | 0.00 | 0.0742 | -0.0130 | ||||
| CHGG / Chegg, Inc. | 0.02 | -3.17 | 0.00 | 0.0045 | -0.0054 |