Mga Batayang Estadistika
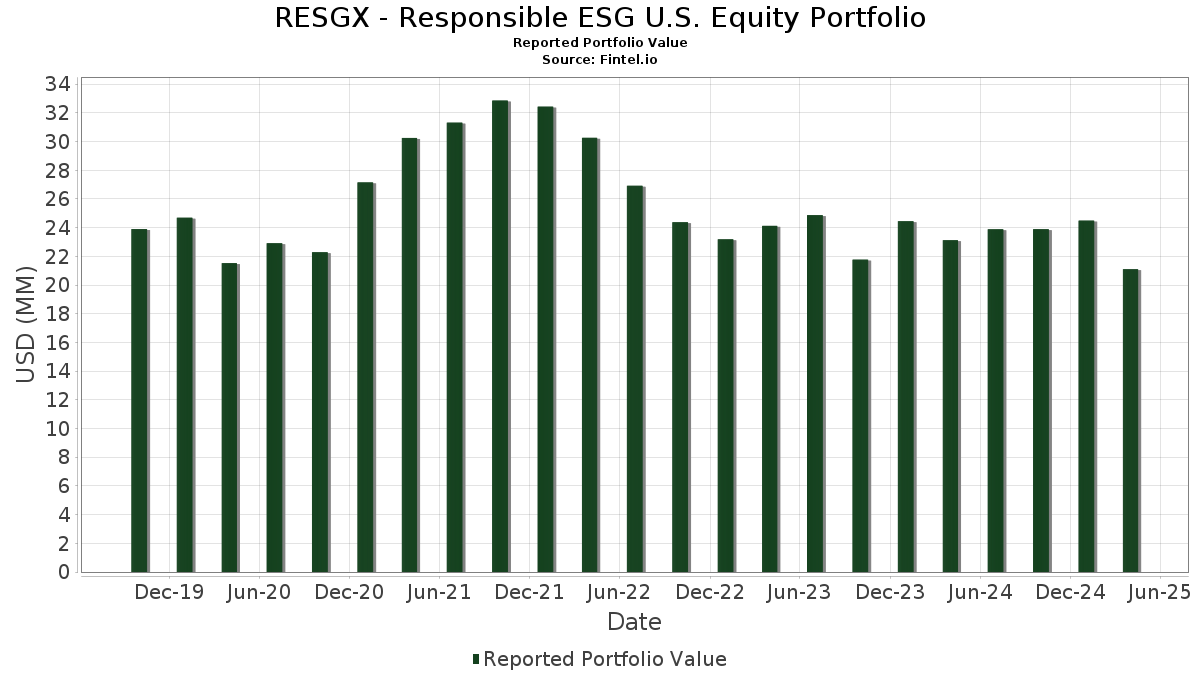
| Nilai Portofolio | $ 21,102,707 |
| Posisi Saat Ini | 85 |
Kepemilikan Terbaru, Kinerja, AUM (dari 13F, 13D)
RESGX - Responsible ESG U.S. Equity Portfolio telah mengungkapkan total kepemilikan 85 dalam pengajuan SEC terbaru mereka. Nilai portofolio terbaru dihitung sebesar $ 21,102,707 USD. Aset yang Dikelola (AUM) sebenarnya adalah nilai ini ditambah kas (yang tidak diungkapkan). Aset-aset utama RESGX - Responsible ESG U.S. Equity Portfolio adalah The TJX Companies, Inc. (US:TJX) , CME Group Inc. (US:CME) , CBRE Group, Inc. (US:CBRE) , Citigroup Inc. (US:C) , and Zoom Communications Inc. (US:ZM) . Posisi baru RESGX - Responsible ESG U.S. Equity Portfolio meliputi: Genpact Limited (US:G) , Airbnb, Inc. (US:ABNB) , Fortive Corporation (US:FTV) , Mastercard Incorporated (US:MA) , and SS&C Technologies Holdings, Inc. (US:SSNC) .
Peningkatan Tertinggi Kuartal Ini
Kami menggunakan perubahan dalam alokasi portofolio karena ini adalah metrik yang paling bermakna. Perubahan dapat disebabkan oleh perdagangan atau perubahan harga saham.
| Keamanan | Saham (MM) |
Nilai (Juta Dolar AS) |
Portfolio % | ΔPorsyento ng Portfolio |
|---|---|---|---|---|
| 0.01 | 0.34 | 1.6004 | 1.6004 | |
| 0.00 | 0.28 | 1.3213 | 1.3213 | |
| 0.00 | 0.25 | 1.1835 | 1.1835 | |
| 0.00 | 0.36 | 1.6923 | 1.0963 | |
| 0.00 | 0.23 | 1.0889 | 1.0889 | |
| 0.00 | 0.23 | 1.0842 | 1.0842 | |
| 0.00 | 0.20 | 0.9707 | 0.9707 | |
| 0.00 | 0.31 | 1.4529 | 0.7779 | |
| 0.00 | 0.50 | 2.3573 | 0.6293 | |
| 0.00 | 0.12 | 0.5562 | 0.5562 |
Penurunan Tertinggi Kuartal Ini
Kami menggunakan perubahan dalam alokasi portofolio karena ini adalah metrik yang paling bermakna. Perubahan dapat disebabkan oleh perdagangan atau perubahan harga saham.
| Keamanan | Saham (MM) |
Nilai (Juta Dolar AS) |
Portfolio % | ΔPorsyento ng Portfolio |
|---|---|---|---|---|
| 0.00 | 0.10 | 0.4767 | -1.2080 | |
| 0.00 | 0.21 | 0.9925 | -1.0857 | |
| 0.00 | 0.31 | 1.4579 | -1.0507 | |
| 0.00 | 0.16 | 0.7684 | -1.0483 | |
| 0.00 | 0.11 | 0.5181 | -1.0090 | |
| 0.00 | 0.00 | -0.9768 | ||
| 0.00 | 0.11 | 0.5144 | -0.9576 | |
| 0.00 | 0.00 | -0.9016 | ||
| 0.00 | 0.00 | -0.8673 | ||
| 0.00 | 0.00 | -0.8247 |
Pengajuan 13F dan Dana
Formulir ini diajukan pada 2025-06-05 untuk periode pelaporan 2025-04-30. Klik ikon tautan untuk melihat riwayat transaksi selengkapnya.
Tingkatkan ke versi premium untuk membuka data premium dan ekspor ke Excel. ![]() .
.
| Keamanan | Ketik | Harga Saham Rata-rata | Saham (MM) |
ΔSaham (%) |
ΔSaham (%) |
Nilai ($MM) |
Portpolyo (%) |
ΔPortofolio (%) |
|
|---|---|---|---|---|---|---|---|---|---|
| TJX / The TJX Companies, Inc. | 0.00 | -1.69 | 0.50 | 1.42 | 2.3841 | 0.3645 | |||
| CME / CME Group Inc. | 0.00 | 0.00 | 0.50 | 17.02 | 2.3573 | 0.6293 | |||
| CBRE / CBRE Group, Inc. | 0.00 | 0.00 | 0.49 | -15.54 | 2.3259 | -0.0403 | |||
| C / Citigroup Inc. | 0.01 | 0.00 | 0.49 | -16.06 | 2.3133 | -0.0524 | |||
| ZM / Zoom Communications Inc. | 0.01 | 0.00 | 0.46 | -10.76 | 2.1689 | 0.0805 | |||
| DBX / Dropbox, Inc. | 0.02 | 0.00 | 0.44 | -11.38 | 2.1160 | 0.0697 | |||
| GOOGL / Alphabet Inc. | 0.00 | 0.00 | 0.42 | -22.24 | 2.0156 | -0.2082 | |||
| CRH / CRH plc | 0.00 | 0.00 | 0.42 | -3.68 | 1.9966 | 0.2171 | |||
| TWLO / Twilio Inc. | 0.00 | 0.00 | 0.41 | -33.98 | 1.9514 | -0.5885 | |||
| BKR / Baker Hughes Company | 0.01 | 0.00 | 0.40 | -23.33 | 1.9074 | -0.2294 | |||
| COR / Cencora, Inc. | 0.00 | 0.00 | 0.40 | 15.16 | 1.8817 | 0.4781 | |||
| EBAY / eBay Inc. | 0.01 | 0.00 | 0.38 | 1.07 | 1.8041 | 0.2703 | |||
| MDT / Medtronic plc | 0.00 | 0.00 | 0.38 | -6.48 | 1.7840 | 0.1424 | |||
| V / Visa Inc. | 0.00 | 141.22 | 0.36 | 144.83 | 1.6923 | 1.0963 | |||
| OMC / Omnicom Group Inc. | 0.00 | 0.00 | 0.35 | -12.28 | 1.6689 | 0.0357 | |||
| HPE / Hewlett Packard Enterprise Company | 0.02 | 0.00 | 0.35 | -23.62 | 1.6495 | -0.2011 | |||
| CTSH / Cognizant Technology Solutions Corporation | 0.00 | 0.00 | 0.35 | -11.08 | 1.6440 | 0.0587 | |||
| PYPL / PayPal Holdings, Inc. | 0.01 | 0.00 | 0.35 | -25.65 | 1.6422 | -0.2551 | |||
| DT / Dynatrace, Inc. | 0.01 | 0.00 | 0.34 | -18.80 | 1.6058 | -0.0897 | |||
| G / Genpact Limited | 0.01 | 0.34 | 1.6004 | 1.6004 | |||||
| AMAT / Applied Materials, Inc. | 0.00 | 0.00 | 0.33 | -16.50 | 1.5925 | -0.0440 | |||
| LRCX / Lam Research Corporation | 0.00 | 0.00 | 0.33 | -11.73 | 1.5770 | 0.0455 | |||
| GM / General Motors Company | 0.01 | 0.00 | 0.33 | -8.56 | 1.5759 | 0.0963 | |||
| GIS / General Mills, Inc. | 0.01 | -22.28 | 0.33 | -26.83 | 1.5731 | -0.2692 | |||
| CMCSA / Comcast Corporation | 0.01 | 0.00 | 0.33 | 1.55 | 1.5597 | 0.2414 | |||
| MRK / Merck & Co., Inc. | 0.00 | 12.38 | 0.33 | -6.34 | 1.5486 | 0.0941 | |||
| OC / Owens Corning | 0.00 | 0.00 | 0.32 | -21.36 | 1.5448 | -0.1389 | |||
| CRUS / Cirrus Logic, Inc. | 0.00 | 17.84 | 0.32 | 12.89 | 1.5419 | 0.3667 | |||
| CRM / Salesforce, Inc. | 0.00 | 28.00 | 0.32 | 0.63 | 1.5130 | 0.2222 | |||
| QCOM / QUALCOMM Incorporated | 0.00 | -14.53 | 0.31 | -26.76 | 1.4868 | -0.2533 | |||
| DKS / DICK'S Sporting Goods, Inc. | 0.00 | -36.19 | 0.31 | -50.16 | 1.4579 | -1.0507 | |||
| FFIV / F5, Inc. | 0.00 | 107.55 | 0.31 | 84.85 | 1.4529 | 0.7779 | |||
| SYY / Sysco Corporation | 0.00 | 27.54 | 0.29 | 24.58 | 1.4027 | 0.4381 | |||
| ABNB / Airbnb, Inc. | 0.00 | 0.28 | 1.3213 | 1.3213 | |||||
| EQIX / Equinix, Inc. | 0.00 | 0.00 | 0.28 | -5.82 | 1.3099 | 0.1159 | |||
| NDAQ / Nasdaq, Inc. | 0.00 | -18.30 | 0.28 | -15.64 | 1.3091 | -0.0568 | |||
| BAC / Bank of America Corporation | 0.01 | 0.00 | 0.27 | -13.84 | 1.3054 | 0.0039 | |||
| GILD / Gilead Sciences, Inc. | 0.00 | 0.00 | 0.27 | 9.64 | 1.3011 | 0.2817 | |||
| META / Meta Platforms, Inc. | 0.00 | 0.00 | 0.27 | -20.35 | 1.2845 | -0.1002 | |||
| DOCU / DocuSign, Inc. | 0.00 | 0.00 | 0.27 | -15.67 | 1.2829 | -0.0207 | |||
| CI / The Cigna Group | 0.00 | -18.37 | 0.27 | -5.69 | 1.2645 | 0.1135 | |||
| FTV / Fortive Corporation | 0.00 | 0.25 | 1.1835 | 1.1835 | |||||
| EXC / Exelon Corporation | 0.01 | 0.00 | 0.25 | 17.54 | 1.1814 | 0.3161 | |||
| A / Agilent Technologies, Inc. | 0.00 | 0.00 | 0.23 | -29.18 | 1.1119 | -0.2327 | |||
| ACM / AECOM | 0.00 | 0.23 | 1.0889 | 1.0889 | |||||
| MA / Mastercard Incorporated | 0.00 | 0.23 | 1.0842 | 1.0842 | |||||
| AFL / Aflac Incorporated | 0.00 | -52.37 | 0.22 | -51.86 | 1.0492 | -0.8198 | |||
| KEX / Kirby Corporation | 0.00 | 0.00 | 0.22 | -11.79 | 1.0366 | 0.0284 | |||
| TT / Trane Technologies plc | 0.00 | 0.00 | 0.21 | 5.42 | 1.0208 | 0.1912 | |||
| BIIB / Biogen Inc. | 0.00 | 0.00 | 0.21 | -16.14 | 1.0163 | -0.0212 | |||
| TOL / Toll Brothers, Inc. | 0.00 | -44.78 | 0.21 | -59.06 | 0.9925 | -1.0857 | |||
| SSNC / SS&C Technologies Holdings, Inc. | 0.00 | 0.20 | 0.9707 | 0.9707 | |||||
| PINS / Pinterest, Inc. | 0.01 | 0.00 | 0.20 | -23.19 | 0.9624 | -0.1135 | |||
| OLED / Universal Display Corporation | 0.00 | 0.00 | 0.20 | -16.24 | 0.9362 | -0.0232 | |||
| ANET / Arista Networks Inc | 0.00 | 0.00 | 0.19 | -28.46 | 0.8854 | -0.1796 | |||
| AXTA / Axalta Coating Systems Ltd. | 0.01 | 0.00 | 0.18 | -9.64 | 0.8508 | 0.0428 | |||
| GEN / Gen Digital Inc. | 0.01 | -17.33 | 0.17 | 6.21 | 0.8142 | 0.1183 | |||
| SWKS / Skyworks Solutions, Inc. | 0.00 | -27.31 | 0.17 | -46.62 | 0.7902 | -0.5114 | |||
| CSCO / Cisco Systems, Inc. | 0.00 | -61.87 | 0.16 | -63.74 | 0.7684 | -1.0483 | |||
| PNR / Pentair plc | 0.00 | 0.00 | 0.15 | -12.72 | 0.7214 | 0.0135 | |||
| AVTR / Avantor, Inc. | 0.01 | 0.00 | 0.14 | -41.70 | 0.6852 | -0.3240 | |||
| MMC / Marsh & McLennan Companies, Inc. | 0.00 | 0.00 | 0.14 | 3.76 | 0.6583 | 0.1145 | |||
| CL / Colgate-Palmolive Company | 0.00 | -33.06 | 0.14 | -29.02 | 0.6541 | -0.1351 | |||
| DTE / DTE Energy Company | 0.00 | 0.00 | 0.13 | 14.53 | 0.6398 | 0.1590 | |||
| EXPE / Expedia Group, Inc. | 0.00 | 0.00 | 0.13 | -7.91 | 0.6105 | 0.0394 | |||
| BK / The Bank of New York Mellon Corporation | 0.00 | 0.00 | 0.12 | -6.11 | 0.5874 | 0.0483 | |||
| CNC / Centene Corporation | 0.00 | 0.00 | 0.12 | -6.15 | 0.5818 | 0.0473 | |||
| AMT / American Tower Corporation | 0.00 | -1.29 | 0.12 | 4.35 | 0.5735 | 0.0898 | |||
| TAP / Molson Coors Beverage Company | 0.00 | 0.00 | 0.12 | 5.36 | 0.5625 | 0.1028 | |||
| EOG / EOG Resources, Inc. | 0.00 | 0.12 | 0.5562 | 0.5562 | |||||
| NTAP / NetApp, Inc. | 0.00 | -53.27 | 0.11 | -65.62 | 0.5186 | -0.7779 | |||
| JNJ / Johnson & Johnson | 0.00 | -69.83 | 0.11 | -70.33 | 0.5181 | -1.0090 | |||
| SPG / Simon Property Group, Inc. | 0.00 | 0.00 | 0.11 | -9.24 | 0.5157 | 0.0265 | |||
| ICE / Intercontinental Exchange, Inc. | 0.00 | -82.58 | 0.11 | -69.41 | 0.5144 | -0.9576 | |||
| Aptiv PLC / EC (JE00BTDN8H13) | 0.00 | 0.10 | 0.4977 | 0.4977 | |||||
| DAL / Delta Air Lines, Inc. | 0.00 | 0.10 | 0.4971 | 0.4971 | |||||
| LULU / lululemon athletica inc. | 0.00 | 0.10 | 0.4945 | 0.4945 | |||||
| WSM / Williams-Sonoma, Inc. | 0.00 | 0.10 | 0.4929 | 0.4929 | |||||
| ONTO / Onto Innovation Inc. | 0.00 | 0.00 | 0.10 | -40.94 | 0.4849 | -0.2142 | |||
| DIS / The Walt Disney Company | 0.00 | 0.10 | 0.4771 | 0.4771 | |||||
| HPQ / HP Inc. | 0.00 | -73.22 | 0.10 | -75.25 | 0.4767 | -1.2080 | |||
| IQV / IQVIA Holdings Inc. | 0.00 | 0.00 | 0.09 | -23.14 | 0.4439 | -0.0511 | |||
| REGN / Regeneron Pharmaceuticals, Inc. | 0.00 | 0.00 | 0.09 | -10.89 | 0.4300 | 0.0150 | |||
| FIXED INC CLEARING CORP.REPO / RA (000000000) | 0.07 | 0.3520 | 0.3520 | ||||||
| FIXED INC CLEARING CORP.REPO / RA (000000000) | 0.07 | 0.3520 | 0.3520 | ||||||
| WFC / Wells Fargo & Company | 0.00 | -100.00 | 0.00 | -100.00 | -0.5532 | ||||
| PFE / Pfizer Inc. | 0.00 | -100.00 | 0.00 | -100.00 | -0.8247 | ||||
| PCAR / PACCAR Inc | 0.00 | -100.00 | 0.00 | -100.00 | -0.9016 | ||||
| OXY / Occidental Petroleum Corporation | 0.00 | -100.00 | 0.00 | -100.00 | -0.9768 | ||||
| ANF / Abercrombie & Fitch Co. | 0.00 | -100.00 | 0.00 | -100.00 | -0.8673 |