Mga Batayang Estadistika
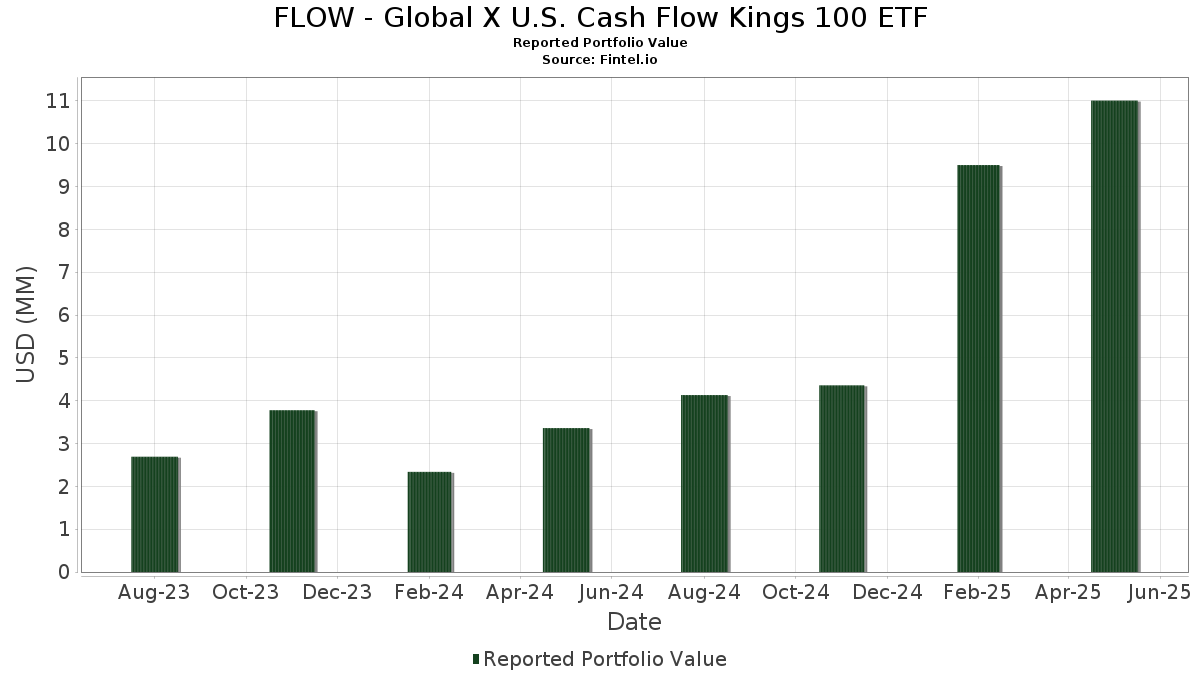
| Nilai Portofolio | $ 11,007,072 |
| Posisi Saat Ini | 99 |
Kepemilikan Terbaru, Kinerja, AUM (dari 13F, 13D)
FLOW - Global X U.S. Cash Flow Kings 100 ETF telah mengungkapkan total kepemilikan 99 dalam pengajuan SEC terbaru mereka. Nilai portofolio terbaru dihitung sebesar $ 11,007,072 USD. Aset yang Dikelola (AUM) sebenarnya adalah nilai ini ditambah kas (yang tidak diungkapkan). Aset-aset utama FLOW - Global X U.S. Cash Flow Kings 100 ETF adalah NRG Energy, Inc. (US:NRG) , Marathon Petroleum Corporation (US:MPC) , United Airlines Holdings, Inc. (US:UAL) , Altria Group, Inc. (US:MO) , and Gen Digital Inc. (US:GEN) . Posisi baru FLOW - Global X U.S. Cash Flow Kings 100 ETF meliputi: NRG Energy, Inc. (US:NRG) , United Airlines Holdings, Inc. (US:UAL) , Target Corporation (US:TGT) , Merck & Co., Inc. (US:MRK) , and Aptiv PLC (US:APTV) .
Peningkatan Tertinggi Kuartal Ini
Kami menggunakan perubahan dalam alokasi portofolio karena ini adalah metrik yang paling bermakna. Perubahan dapat disebabkan oleh perdagangan atau perubahan harga saham.
| Keamanan | Saham (MM) |
Nilai (Juta Dolar AS) |
Portfolio % | ΔPorsyento ng Portfolio |
|---|---|---|---|---|
| 0.00 | 0.29 | 2.6272 | 2.6272 | |
| 0.00 | 0.24 | 2.1735 | 2.1735 | |
| 0.00 | 0.20 | 1.8502 | 1.8502 | |
| 0.00 | 0.19 | 1.6899 | 1.6899 | |
| 0.00 | 0.18 | 1.6146 | 1.6146 | |
| 0.00 | 0.16 | 1.4886 | 1.4886 | |
| 0.00 | 0.13 | 1.1458 | 1.1458 | |
| 0.00 | 0.10 | 0.9364 | 0.9364 | |
| 0.00 | 0.07 | 0.6565 | 0.6565 | |
| 0.00 | 0.07 | 0.6180 | 0.6180 |
Penurunan Tertinggi Kuartal Ini
Kami menggunakan perubahan dalam alokasi portofolio karena ini adalah metrik yang paling bermakna. Perubahan dapat disebabkan oleh perdagangan atau perubahan harga saham.
| Keamanan | Saham (MM) |
Nilai (Juta Dolar AS) |
Portfolio % | ΔPorsyento ng Portfolio |
|---|---|---|---|---|
| 0.00 | 0.00 | -0.8006 | ||
| 0.00 | 0.00 | -0.6671 | ||
| 0.01 | 0.18 | 1.6514 | -0.5861 | |
| 0.00 | 0.00 | -0.5822 | ||
| 0.00 | 0.18 | 1.6194 | -0.4365 | |
| 0.00 | 0.20 | 1.7765 | -0.3388 | |
| 0.00 | 0.00 | -0.3217 | ||
| 0.00 | 0.00 | -0.2918 | ||
| 0.00 | 0.13 | 1.1870 | -0.2593 | |
| 0.00 | 0.00 | -0.2484 |
Pengajuan 13F dan Dana
Formulir ini diajukan pada 2025-07-30 untuk periode pelaporan 2025-05-31. Klik ikon tautan untuk melihat riwayat transaksi selengkapnya.
Tingkatkan ke versi premium untuk membuka data premium dan ekspor ke Excel. ![]() .
.
| Keamanan | Ketik | Harga Saham Rata-rata | Saham (MM) |
ΔSaham (%) |
ΔSaham (%) |
Nilai ($MM) |
Portpolyo (%) |
ΔPortofolio (%) |
|
|---|---|---|---|---|---|---|---|---|---|
| NRG / NRG Energy, Inc. | 0.00 | 0.29 | 2.6272 | 2.6272 | |||||
| MPC / Marathon Petroleum Corporation | 0.00 | 6.65 | 0.24 | 14.15 | 2.1959 | -0.0323 | |||
| UAL / United Airlines Holdings, Inc. | 0.00 | 0.24 | 2.1735 | 2.1735 | |||||
| MO / Altria Group, Inc. | 0.00 | 12.25 | 0.24 | 21.54 | 2.1549 | 0.1059 | |||
| GEN / Gen Digital Inc. | 0.01 | 23.05 | 0.23 | 28.49 | 2.0850 | 0.2017 | |||
| VLO / Valero Energy Corporation | 0.00 | 8.12 | 0.22 | 6.76 | 2.0086 | -0.1726 | |||
| EXPE / Expedia Group, Inc. | 0.00 | 45.09 | 0.22 | 22.03 | 1.9651 | 0.1027 | |||
| CF / CF Industries Holdings, Inc. | 0.00 | 455.56 | 0.21 | 526.47 | 1.9324 | 0.4752 | |||
| WBD / Warner Bros. Discovery, Inc. | 0.02 | 19.42 | 0.21 | 3.98 | 1.9012 | -0.2184 | |||
| QCOM / QUALCOMM Incorporated | 0.00 | 17.06 | 0.21 | 8.29 | 1.8967 | -0.1348 | |||
| BIIB / Biogen Inc. | 0.00 | 53.35 | 0.21 | 42.47 | 1.8872 | 0.3441 | |||
| LEN / Lennar Corporation | 0.00 | 44.01 | 0.21 | 27.78 | 1.8848 | 0.1752 | |||
| TGT / Target Corporation | 0.00 | 0.20 | 1.8502 | 1.8502 | |||||
| ZM / Zoom Communications Inc. | 0.00 | 41.06 | 0.20 | 55.47 | 1.8067 | 0.4610 | |||
| HPQ / HP Inc. | 0.01 | 37.64 | 0.20 | 11.36 | 1.7780 | -0.0770 | |||
| EOG / EOG Resources, Inc. | 0.00 | 13.74 | 0.20 | -2.99 | 1.7765 | -0.3388 | |||
| VTRS / Viatris Inc. | 0.02 | 67.81 | 0.19 | 60.00 | 1.7438 | 0.4799 | |||
| FANG / Diamondback Energy, Inc. | 0.00 | 59.15 | 0.19 | 34.51 | 1.7393 | 0.2438 | |||
| MRK / Merck & Co., Inc. | 0.00 | 0.19 | 1.6899 | 1.6899 | |||||
| SLB / Schlumberger Limited | 0.01 | 7.76 | 0.18 | -14.55 | 1.6514 | -0.5861 | |||
| HAL / Halliburton Company | 0.01 | 122.30 | 0.18 | 64.81 | 1.6217 | 0.4843 | |||
| BMY / Bristol-Myers Squibb Company | 0.00 | 12.67 | 0.18 | -8.72 | 1.6194 | -0.4365 | |||
| WPC / W. P. Carey Inc. | 0.00 | 5.41 | 0.18 | 2.89 | 1.6180 | -0.2010 | |||
| APTV / Aptiv PLC | 0.00 | 0.18 | 1.6146 | 1.6146 | |||||
| EME / EMCOR Group, Inc. | 0.00 | 0.16 | 1.4886 | 1.4886 | |||||
| PPC / Pilgrim's Pride Corporation | 0.00 | 13.63 | 0.16 | 2.65 | 1.4118 | -0.1804 | |||
| PHM / PulteGroup, Inc. | 0.00 | 228.33 | 0.15 | 144.44 | 1.4005 | -0.1260 | |||
| OMC / Omnicom Group Inc. | 0.00 | 38.02 | 0.15 | 22.31 | 1.3461 | 0.0731 | |||
| CAG / Conagra Brands, Inc. | 0.01 | 31.55 | 0.14 | 18.64 | 1.2701 | 0.0223 | |||
| RL / Ralph Lauren Corporation | 0.00 | 35.47 | 0.13 | 38.14 | 1.2170 | 0.1978 | |||
| ADT / ADT Inc. | 0.02 | 13.62 | 0.13 | 14.91 | 1.1965 | -0.0042 | |||
| BLDR / Builders FirstSource, Inc. | 0.00 | 22.70 | 0.13 | -5.11 | 1.1870 | -0.2593 | |||
| CCK / Crown Holdings, Inc. | 0.00 | 10.43 | 0.13 | 21.50 | 1.1822 | 0.0538 | |||
| SWKS / Skyworks Solutions, Inc. | 0.00 | 17.77 | 0.13 | 21.70 | 1.1739 | 0.0589 | |||
| BBY / Best Buy Co., Inc. | 0.00 | 722.78 | 0.13 | 578.95 | 1.1716 | 0.3536 | |||
| UHS / Universal Health Services, Inc. | 0.00 | 0.13 | 1.1458 | 1.1458 | |||||
| MTZ / MasTec, Inc. | 0.00 | 27.85 | 0.13 | 52.44 | 1.1421 | 0.2755 | |||
| INGR / Ingredion Incorporated | 0.00 | 24.41 | 0.12 | 31.91 | 1.1312 | 0.1425 | |||
| OVV / Ovintiv Inc. | 0.00 | 78.52 | 0.12 | 46.99 | 1.1118 | 0.2366 | |||
| ARW / Arrow Electronics, Inc. | 0.00 | 36.72 | 0.12 | 51.25 | 1.0989 | 0.2490 | |||
| AVT / Avnet, Inc. | 0.00 | 124.04 | 0.12 | 124.53 | 1.0817 | 0.5165 | |||
| GAP / The Gap, Inc. | 0.01 | 35.14 | 0.12 | 33.71 | 1.0812 | 0.1420 | |||
| OC / Owens Corning | 0.00 | 225.00 | 0.12 | 114.55 | 1.0734 | -0.2073 | |||
| TAP / Molson Coors Beverage Company | 0.00 | 28.98 | 0.12 | 12.75 | 1.0508 | -0.0284 | |||
| HOLX / Hologic, Inc. | 0.00 | 34.30 | 0.12 | 32.18 | 1.0437 | 0.1259 | |||
| UTHR / United Therapeutics Corporation | 0.00 | 67.45 | 0.11 | 68.66 | 1.0261 | 0.3137 | |||
| NXST / Nexstar Media Group, Inc. | 0.00 | 34.52 | 0.11 | 36.25 | 0.9934 | 0.1444 | |||
| WCC / WESCO International, Inc. | 0.00 | 254.44 | 0.11 | 181.58 | 0.9710 | 0.0990 | |||
| FIX / Comfort Systems USA, Inc. | 0.00 | 0.10 | 0.9364 | 0.9364 | |||||
| SNX / TD SYNNEX Corporation | 0.00 | 207.75 | 0.10 | 215.63 | 0.9174 | 0.1790 | |||
| LYFT / Lyft, Inc. | 0.01 | 60.50 | 0.10 | 83.33 | 0.9038 | 0.3329 | |||
| DBX / Dropbox, Inc. | 0.00 | 38.70 | 0.10 | 56.45 | 0.8796 | 0.2183 | |||
| PVH / PVH Corp. | 0.00 | 78.67 | 0.09 | 100.00 | 0.8589 | 0.3614 | |||
| CROX / Crocs, Inc. | 0.00 | 25.90 | 0.09 | 29.58 | 0.8405 | 0.0857 | |||
| ETSY / Etsy, Inc. | 0.00 | 54.73 | 0.09 | 67.92 | 0.8128 | 0.2501 | |||
| MTCH / Match Group, Inc. | 0.00 | 29.72 | 0.09 | 22.22 | 0.8031 | 0.0436 | |||
| HOG / Harley-Davidson, Inc. | 0.00 | 66.14 | 0.09 | 56.36 | 0.7872 | 0.2033 | |||
| IPG / The Interpublic Group of Companies, Inc. | 0.00 | 28.83 | 0.08 | 13.51 | 0.7648 | -0.0215 | |||
| BWA / BorgWarner Inc. | 0.00 | 19.91 | 0.08 | 33.33 | 0.7334 | 0.0961 | |||
| NOV / NOV Inc. | 0.01 | 170.71 | 0.08 | 119.44 | 0.7238 | 0.3388 | |||
| CHRD / Chord Energy Corporation | 0.00 | 135.79 | 0.08 | 87.80 | 0.7041 | 0.2648 | |||
| HRB / H&R Block, Inc. | 0.00 | 29.21 | 0.08 | 35.71 | 0.6964 | 0.0989 | |||
| IGT / International Game Technology PLC | 0.01 | 12.82 | 0.08 | -6.17 | 0.6947 | -0.1650 | |||
| CIVI / Civitas Resources, Inc. | 0.00 | 0.07 | 0.6565 | 0.6565 | |||||
| US4039491000 / HF Sinclair Corp. | 0.00 | 41.25 | 0.07 | 44.90 | 0.6505 | 0.1298 | |||
| DDS / Dillard's, Inc. | 0.00 | 36.92 | 0.07 | 40.00 | 0.6390 | 0.1079 | |||
| DXC / DXC Technology Company | 0.00 | 8.96 | 0.07 | -10.39 | 0.6318 | -0.1799 | |||
| LEVI / Levi Strauss & Co. | 0.00 | 23.81 | 0.07 | 19.30 | 0.6192 | 0.0192 | |||
| BLD / TopBuild Corp. | 0.00 | 0.07 | 0.6180 | 0.6180 | |||||
| MUR / Murphy Oil Corporation | 0.00 | 114.75 | 0.07 | 71.05 | 0.5965 | 0.1893 | |||
| MHK / Mohawk Industries, Inc. | 0.00 | 219.39 | 0.06 | 106.67 | 0.5709 | -0.1636 | |||
| FMC / FMC Corporation | 0.00 | 0.06 | 0.5416 | 0.5416 | |||||
| MAT / Mattel, Inc. | 0.00 | -6.40 | 0.06 | -17.14 | 0.5345 | -0.2094 | |||
| MLI / Mueller Industries, Inc. | 0.00 | 12.58 | 0.06 | 9.62 | 0.5245 | -0.0312 | |||
| GNRC / Generac Holdings Inc. | 0.00 | 0.06 | 0.5159 | 0.5159 | |||||
| NEU / NewMarket Corporation | 0.00 | 25.71 | 0.06 | 43.59 | 0.5138 | 0.0948 | |||
| THO / THOR Industries, Inc. | 0.00 | 97.17 | 0.06 | 60.00 | 0.5123 | 0.1439 | |||
| VMI / Valmont Industries, Inc. | 0.00 | 0.06 | 0.5045 | 0.5045 | |||||
| LEA / Lear Corporation | 0.00 | 185.78 | 0.05 | 170.00 | 0.4943 | 0.0215 | |||
| SMG / The Scotts Miracle-Gro Company | 0.00 | 19.73 | 0.05 | 20.93 | 0.4751 | 0.0231 | |||
| CRUS / Cirrus Logic, Inc. | 0.00 | -2.52 | 0.05 | -8.16 | 0.4137 | -0.1071 | |||
| CBT / Cabot Corporation | 0.00 | 24.29 | 0.04 | 5.56 | 0.3534 | -0.0258 | |||
| RNG / RingCentral, Inc. | 0.00 | 71.12 | 0.04 | 58.33 | 0.3495 | 0.0899 | |||
| UFPI / UFP Industries, Inc. | 0.00 | -3.25 | 0.04 | -11.90 | 0.3423 | -0.1071 | |||
| LNTH / Lantheus Holdings, Inc. | 0.00 | 19.28 | 0.04 | -2.63 | 0.3391 | -0.0698 | |||
| COLM / Columbia Sportswear Company | 0.00 | 20.17 | 0.04 | -12.20 | 0.3307 | -0.1033 | |||
| NVST / Envista Holdings Corporation | 0.00 | 45.74 | 0.03 | 32.00 | 0.3034 | 0.0397 | |||
| AMKR / Amkor Technology, Inc. | 0.00 | 24.35 | 0.03 | 6.67 | 0.2978 | -0.0270 | |||
| RHI / Robert Half Inc. | 0.00 | 0.03 | 0.2798 | 0.2798 | |||||
| TDC / Teradata Corporation | 0.00 | 53.53 | 0.03 | 44.44 | 0.2427 | 0.0439 | |||
| BILL / BILL Holdings, Inc. | 0.00 | 0.03 | 0.2388 | 0.2388 | |||||
| AMED / Amedisys, Inc. | 0.00 | 20.10 | 0.02 | 21.05 | 0.2140 | 0.0121 | |||
| TNET / TriNet Group, Inc. | 0.00 | 101.50 | 0.02 | 69.23 | 0.2022 | -0.1282 | |||
| IAC / IAC Inc. | 0.00 | 0.02 | 0.1962 | 0.1962 | |||||
| MAN / ManpowerGroup Inc. | 0.00 | 227.54 | 0.02 | 125.00 | 0.1719 | -0.0315 | |||
| CRI / Carter's, Inc. | 0.00 | 41.04 | 0.02 | 5.88 | 0.1701 | -0.0137 | |||
| SAM / The Boston Beer Company, Inc. | 0.00 | 212.50 | 0.02 | 183.33 | 0.1563 | -0.0013 | |||
| SHOO / Steven Madden, Ltd. | 0.00 | 53.45 | 0.02 | 14.29 | 0.1540 | -0.0006 | |||
| IPGP / IPG Photonics Corporation | 0.00 | 20.10 | 0.02 | 33.33 | 0.1508 | 0.0231 | |||
| XRAY / DENTSPLY SIRONA Inc. | 0.00 | -100.00 | 0.00 | -100.00 | -0.2918 | ||||
| ASH / Ashland Inc. | 0.00 | -100.00 | 0.00 | -100.00 | -0.2484 | ||||
| FCN / FTI Consulting, Inc. | 0.00 | -100.00 | 0.00 | -100.00 | -0.3217 | ||||
| SLGN / Silgan Holdings Inc. | 0.00 | -100.00 | 0.00 | -100.00 | -0.5822 | ||||
| HAS / Hasbro, Inc. | 0.00 | -100.00 | 0.00 | -100.00 | -0.8006 | ||||
| OGN / Organon & Co. | 0.00 | -100.00 | 0.00 | -100.00 | -0.6671 |