Mga Batayang Estadistika
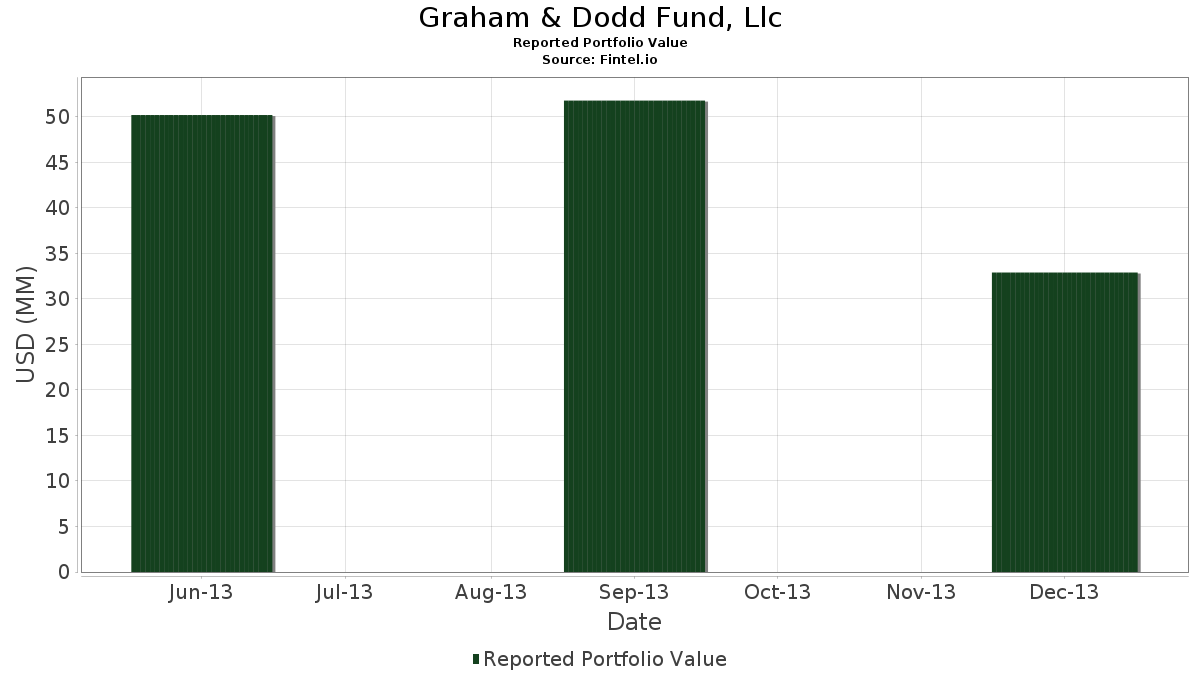
| Nilai Portofolio | $ 32,900,000 |
| Posisi Saat Ini | 48 |
Kepemilikan Terbaru, Kinerja, AUM (dari 13F, 13D)
Graham & Dodd Fund, Llc telah mengungkapkan total kepemilikan 48 dalam pengajuan SEC terbaru mereka. Nilai portofolio terbaru dihitung sebesar $ 32,900,000 USD. Aset yang Dikelola (AUM) sebenarnya adalah nilai ini ditambah kas (yang tidak diungkapkan). Aset-aset utama Graham & Dodd Fund, Llc adalah JPMorgan Chase & Co. (US:JPM) , Prudential Financial, Inc. (US:PRU) , Blackstone Inc. (US:BX) , Bank of America Corporation (US:BAC) , and Berkshire Hathaway Inc. (US:BRK.B) . Posisi baru Graham & Dodd Fund, Llc meliputi: Apple Inc. (US:AAPL) , .
Peningkatan Tertinggi Kuartal Ini
Kami menggunakan perubahan dalam alokasi portofolio karena ini adalah metrik yang paling bermakna. Perubahan dapat disebabkan oleh perdagangan atau perubahan harga saham.
| Keamanan | Saham (MM) |
Nilai (Juta Dolar AS) |
Portfolio % | ΔPorsyento ng Portfolio |
|---|---|---|---|---|
| 0.02 | 0.81 | 2.4529 | 2.4529 | |
| 0.02 | 0.72 | 2.1763 | 2.1763 | |
| 0.01 | 0.69 | 2.0973 | 2.0973 | |
| 0.00 | 0.59 | 1.7903 | 1.7903 | |
| 0.02 | 0.71 | 2.1672 | 1.5705 | |
| 0.01 | 0.81 | 2.4711 | 1.4671 | |
| 0.01 | 0.48 | 1.4590 | 1.4590 | |
| 0.01 | 0.37 | 1.1125 | 1.1125 | |
| 0.01 | 0.37 | 1.1125 | 1.1125 | |
| 0.00 | 0.68 | 2.0790 | 1.0923 |
Penurunan Tertinggi Kuartal Ini
Kami menggunakan perubahan dalam alokasi portofolio karena ini adalah metrik yang paling bermakna. Perubahan dapat disebabkan oleh perdagangan atau perubahan harga saham.
| Keamanan | Saham (MM) |
Nilai (Juta Dolar AS) |
Portfolio % | ΔPorsyento ng Portfolio |
|---|---|---|---|---|
| 0.00 | 0.00 | -2.5160 | ||
| 0.00 | 0.00 | -2.0468 | ||
| 0.00 | 0.00 | -1.9097 | ||
| 0.00 | 0.00 | -1.2358 | ||
| 0.00 | 0.00 | -0.9674 | ||
| 0.01 | 0.67 | 2.0213 | -0.5604 | |
| 0.00 | 0.89 | 2.6960 | -0.4108 | |
| 0.01 | 0.96 | 2.9149 | -0.2209 | |
| 0.00 | 0.60 | 1.8207 | -0.1740 | |
| 0.02 | 0.83 | 2.5319 | -0.1714 |
Pengajuan 13F dan Dana
Formulir ini diajukan pada 2014-02-11 untuk periode pelaporan 2013-12-31. Klik ikon tautan untuk melihat riwayat transaksi selengkapnya.
Tingkatkan ke versi premium untuk membuka data premium dan ekspor ke Excel. ![]() .
.
| Keamanan | Ketik | Harga Saham Rata-rata | Saham (MM) |
ΔSaham (%) |
ΔSaham (%) |
Nilai ($MM) |
Portpolyo (%) |
ΔPortofolio (%) |
|
|---|---|---|---|---|---|---|---|---|---|
| JPM / JPMorgan Chase & Co. | 0.02 | -39.13 | 1.11 | -31.13 | 3.3617 | 0.2607 | |||
| PRU / Prudential Financial, Inc. | 0.01 | -43.15 | 1.10 | -32.76 | 3.3495 | 0.1848 | |||
| BX / Blackstone Inc. | 0.03 | -43.42 | 1.07 | -28.42 | 3.2614 | 0.3670 | |||
| BAC / Bank of America Corporation | 0.06 | -27.02 | 1.00 | -17.67 | 3.0304 | 0.6921 | |||
| BRK.B / Berkshire Hathaway Inc. | 0.01 | -43.48 | 0.96 | -40.95 | 2.9149 | -0.2209 | |||
| GE / General Electric Company | 0.03 | -43.24 | 0.94 | -33.36 | 2.8663 | 0.1340 | |||
| MCK / McKesson Corporation | 0.01 | -43.47 | 0.94 | -28.94 | 2.8511 | 0.3023 | |||
| C / Citigroup Inc. | 0.02 | -13.21 | 0.93 | -6.82 | 2.8237 | 0.8986 | |||
| PFE / Pfizer Inc. | 0.03 | -43.30 | 0.92 | -39.51 | 2.7872 | -0.1400 | |||
| CVS / CVS Health Corporation | 0.01 | -43.39 | 0.91 | -28.66 | 2.7538 | 0.3015 | |||
| 19041P105 / CBS Corp. | 0.01 | -43.40 | 0.90 | -34.59 | 2.7477 | 0.0792 | |||
| PXD / Pioneer Natural Resources Company | 0.00 | -43.45 | 0.89 | -44.87 | 2.6960 | -0.4108 | |||
| JNJ / Johnson & Johnson | 0.01 | -43.41 | 0.87 | -40.19 | 2.6505 | -0.1648 | |||
| CI / The Cigna Group | 0.01 | -43.14 | 0.85 | -35.27 | 2.5775 | 0.0480 | |||
| MET / MetLife, Inc. | 0.02 | -43.16 | 0.83 | -34.69 | 2.5350 | 0.0692 | |||
| AIG / American International Group, Inc. | 0.02 | -43.32 | 0.83 | -40.50 | 2.5319 | -0.1714 | |||
| XOM / Exxon Mobil Corporation | 0.01 | 32.85 | 0.81 | 56.35 | 2.4711 | 1.4671 | |||
| TMUS / T-Mobile US, Inc. | 0.02 | -43.42 | 0.81 | -26.70 | 2.4529 | 2.4529 | |||
| WFC / Wells Fargo & Company | 0.02 | -43.18 | 0.79 | -37.59 | 2.3921 | -0.0428 | |||
| DIS / The Walt Disney Company | 0.01 | -43.43 | 0.78 | -32.99 | 2.3708 | 0.1232 | |||
| MHK / Mohawk Industries, Inc. | 0.01 | -43.40 | 0.78 | -35.33 | 2.3647 | 0.0419 | |||
| MPC / Marathon Petroleum Corporation | 0.01 | -52.93 | 0.76 | -32.92 | 2.3161 | 0.1226 | |||
| FOX / Fox Corporation | 0.02 | -43.32 | 0.72 | -40.53 | 2.1763 | 2.1763 | |||
| WNR / Western Refining, Inc. | 0.02 | 63.18 | 0.71 | 130.74 | 2.1672 | 1.5705 | |||
| AXP / American Express Company | 0.01 | -43.40 | 0.69 | -31.93 | 2.1064 | 0.1407 | |||
| GILD / Gilead Sciences, Inc. | 0.01 | -32.51 | 0.69 | -19.30 | 2.0973 | 2.0973 | |||
| C.WSA / Citigroup, Inc. | 0.00 | 14.47 | 0.68 | 33.86 | 2.0790 | 1.0923 | |||
| CSX / CSX Corporation | 0.02 | -43.24 | 0.67 | -36.54 | 2.0274 | -0.0020 | |||
| HES / Hess Corporation | 0.01 | -53.67 | 0.67 | -50.26 | 2.0213 | -0.5604 | |||
| PG / The Procter & Gamble Company | 0.01 | -43.05 | 0.62 | -38.68 | 1.8936 | -0.0682 | |||
| CVX / Chevron Corporation | 0.00 | -43.60 | 0.60 | -42.01 | 1.8207 | -0.1740 | |||
| AAPL / Apple Inc. | 0.00 | 0.59 | 1.7903 | 1.7903 | |||||
| ADM / Archer-Daniels-Midland Company | 0.01 | -43.56 | 0.53 | -33.58 | 1.6231 | 0.0706 | |||
| M / Macy's, Inc. | 0.01 | -43.21 | 0.53 | -30.00 | 1.5957 | 0.1476 | |||
| HIG / The Hartford Insurance Group, Inc. | 0.01 | -32.34 | 0.50 | -21.32 | 1.5258 | 0.2939 | |||
| AET / Aetna, Inc. | 0.01 | -43.45 | 0.48 | -39.47 | 1.4681 | -0.0728 | |||
| MSFT / Microsoft Corporation | 0.01 | -41.78 | 0.48 | -36.93 | 1.4590 | 1.4590 | |||
| GS / The Goldman Sachs Group, Inc. | 0.00 | -43.36 | 0.47 | -36.57 | 1.4286 | -0.0022 | |||
| LYB / LyondellBasell Industries N.V. | 0.01 | -43.21 | 0.42 | -37.68 | 1.2918 | -0.0251 | |||
| US00C4U1L353 / Mylan N.V. | 0.01 | -43.50 | 0.37 | -35.79 | 1.1125 | 1.1125 | |||
| MS / Morgan Stanley | 0.01 | -43.37 | 0.37 | -34.05 | 1.1125 | 1.1125 | |||
| CP / Canadian Pacific Kansas City Limited | 0.00 | -43.35 | 0.35 | -30.42 | 1.0638 | 0.0926 | |||
| MRK / Merck & Co., Inc. | 0.01 | -43.66 | 0.35 | -40.72 | 1.0578 | -0.0757 | |||
| SNDK / Sandisk Corporation | 0.00 | -43.37 | 0.35 | -32.82 | 1.0517 | 1.0517 | |||
| CPA / Copa Holdings, S.A. | 0.00 | -43.45 | 0.34 | -34.81 | 1.0304 | 0.0263 | |||
| ROC / ROC Energy Acquisition Corp | 0.00 | 14.20 | 0.32 | 22.73 | 0.9848 | 0.4750 | |||
| OXY / Occidental Petroleum Corporation | 0.00 | -43.42 | 0.32 | -42.57 | 0.9635 | -0.1023 | |||
| HAL / Halliburton Company | 0.01 | -43.39 | 0.31 | -40.31 | 0.9453 | 0.9453 | |||
| 772739207 / Rock-Tenn | 0.00 | -100.00 | 0.00 | -100.00 | -2.5160 | ||||
| KRFT / | 0.00 | -100.00 | 0.00 | -100.00 | -1.2358 | ||||
| MRO / Marathon Oil Corporation | 0.00 | -100.00 | 0.00 | -100.00 | 0.0000 | 0.0000 | |||
| CSCO / Cisco Systems, Inc. | 0.00 | -100.00 | 0.00 | -100.00 | -1.9097 | ||||
| TRV / The Travelers Companies, Inc. | 0.00 | -100.00 | 0.00 | -100.00 | -0.9674 | ||||
| DTV / DTE Energy Company | 0.00 | -100.00 | 0.00 | -100.00 | -2.0468 |