Mga Batayang Estadistika
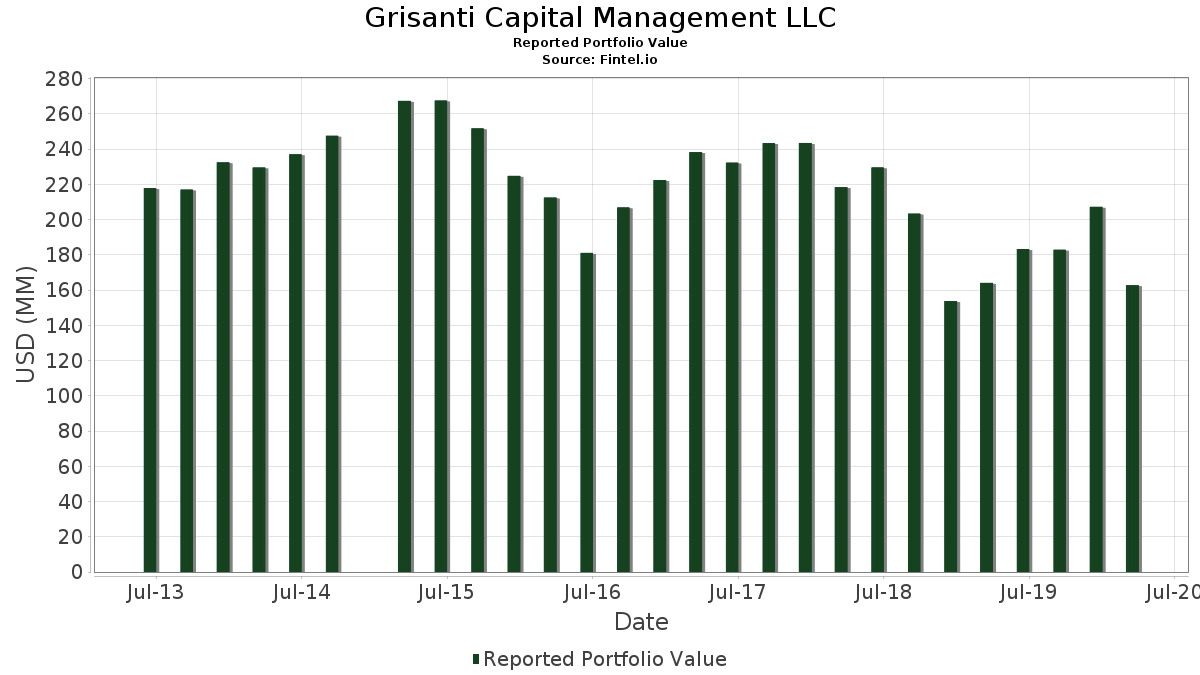
| Nilai Portofolio | $ 162,756,000 |
| Posisi Saat Ini | 46 |
Kepemilikan Terbaru, Kinerja, AUM (dari 13F, 13D)
Grisanti Capital Management LLC telah mengungkapkan total kepemilikan 46 dalam pengajuan SEC terbaru mereka. Nilai portofolio terbaru dihitung sebesar $ 162,756,000 USD. Aset yang Dikelola (AUM) sebenarnya adalah nilai ini ditambah kas (yang tidak diungkapkan). Aset-aset utama Grisanti Capital Management LLC adalah Meta Platforms, Inc. (US:META) , AbbVie Inc. (US:ABBV) , Alphabet Inc. (US:GOOGL) , Amazon.com, Inc. (US:AMZN) , and Berkshire Hathaway Inc. (US:BRK.B) . Posisi baru Grisanti Capital Management LLC meliputi: Domino's Pizza, Inc. (US:DPZ) , Stryker Corporation (US:SYK) , .
Peningkatan Tertinggi Kuartal Ini
Kami menggunakan perubahan dalam alokasi portofolio karena ini adalah metrik yang paling bermakna. Perubahan dapat disebabkan oleh perdagangan atau perubahan harga saham.
| Keamanan | Saham (MM) |
Nilai (Juta Dolar AS) |
Portfolio % | ΔPorsyento ng Portfolio |
|---|---|---|---|---|
| 0.23 | 8.00 | 4.9135 | 2.9138 | |
| 0.05 | 7.97 | 4.8957 | 2.6026 | |
| 0.01 | 10.07 | 6.1884 | 2.5673 | |
| 0.02 | 3.65 | 2.2402 | 2.2402 | |
| 0.01 | 3.32 | 2.0374 | 2.0374 | |
| 0.02 | 7.21 | 4.4306 | 2.0327 | |
| 0.01 | 6.05 | 3.7178 | 1.7842 | |
| 0.03 | 2.82 | 1.7314 | 1.7314 | |
| 0.15 | 11.66 | 7.1672 | 1.7278 | |
| 0.02 | 2.67 | 1.6405 | 1.6405 |
Penurunan Tertinggi Kuartal Ini
Kami menggunakan perubahan dalam alokasi portofolio karena ini adalah metrik yang paling bermakna. Perubahan dapat disebabkan oleh perdagangan atau perubahan harga saham.
| Keamanan | Saham (MM) |
Nilai (Juta Dolar AS) |
Portfolio % | ΔPorsyento ng Portfolio |
|---|---|---|---|---|
| 0.00 | 0.00 | -5.4114 | ||
| 0.00 | 0.00 | -4.2808 | ||
| 0.00 | 0.00 | -3.6809 | ||
| 0.00 | 0.00 | -3.5468 | ||
| 0.00 | 0.00 | -2.9209 | ||
| 0.00 | 0.00 | -2.6251 | ||
| 0.00 | 0.00 | -1.6614 | ||
| 0.00 | 0.00 | -1.6363 | ||
| 0.00 | 0.00 | -1.5152 | ||
| 0.00 | 0.00 | -1.0698 |
Pengajuan 13F dan Dana
Formulir ini diajukan pada 2020-05-06 untuk periode pelaporan 2020-03-31. Klik ikon tautan untuk melihat riwayat transaksi selengkapnya.
Tingkatkan ke versi premium untuk membuka data premium dan ekspor ke Excel. ![]() .
.
| Keamanan | Ketik | Harga Saham Rata-rata | Saham (MM) |
ΔSaham (%) |
ΔSaham (%) |
Nilai ($MM) |
Portpolyo (%) |
ΔPortofolio (%) |
|
|---|---|---|---|---|---|---|---|---|---|
| META / Meta Platforms, Inc. | 0.08 | 19.47 | 12.76 | -2.91 | 7.8424 | 1.4983 | |||
| ABBV / AbbVie Inc. | 0.15 | 20.26 | 11.66 | 3.49 | 7.1672 | 1.7278 | |||
| GOOGL / Alphabet Inc. | 0.01 | -1.49 | 11.31 | -14.54 | 6.9466 | 0.5629 | |||
| AMZN / Amazon.com, Inc. | 0.01 | 27.21 | 10.07 | 34.22 | 6.1884 | 2.5673 | |||
| BRK.B / Berkshire Hathaway Inc. | 0.04 | 19.39 | 8.02 | -3.63 | 4.9264 | 0.9115 | |||
| CMCSA / Comcast Corporation | 0.23 | 152.43 | 8.00 | 92.98 | 4.9135 | 2.9138 | |||
| V / Visa Inc. | 0.05 | 95.52 | 7.97 | 67.68 | 4.8957 | 2.6026 | |||
| BDX / Becton, Dickinson and Company | 0.03 | 8.68 | 7.78 | -8.18 | 4.7789 | 0.6912 | |||
| BSX / Boston Scientific Corporation | 0.22 | 13.86 | 7.33 | -17.85 | 4.5055 | 0.1982 | |||
| CME / CME Group Inc. | 0.04 | 21.15 | 7.29 | 4.35 | 4.4766 | 1.1074 | |||
| LMT / Lockheed Martin Corporation | 0.02 | 66.72 | 7.21 | 45.12 | 4.4306 | 2.0327 | |||
| PYPL / PayPal Holdings, Inc. | 0.07 | 24.48 | 6.84 | 10.17 | 4.2051 | 1.2074 | |||
| ROKU / Roku, Inc. | 0.07 | 38.94 | 6.28 | -9.23 | 3.8567 | 0.5198 | |||
| SHW / The Sherwin-Williams Company | 0.01 | 91.77 | 6.05 | 51.01 | 3.7178 | 1.7842 | |||
| ATVI / Activision Blizzard Inc | 0.10 | 14.77 | 5.75 | 14.88 | 3.5341 | 1.1180 | |||
| ADBE / Adobe Inc. | 0.02 | -16.87 | 5.42 | -19.79 | 3.3320 | 0.0694 | |||
| ADSK / Autodesk, Inc. | 0.03 | 19.69 | 4.68 | 1.83 | 2.8749 | 0.6575 | |||
| HD / The Home Depot, Inc. | 0.02 | 3.65 | 2.2402 | 2.2402 | |||||
| DPZ / Domino's Pizza, Inc. | 0.01 | 3.32 | 2.0374 | 2.0374 | |||||
| JNJ / Johnson & Johnson | 0.02 | 18.68 | 3.00 | 6.69 | 1.8420 | 0.4860 | |||
| NKE / NIKE, Inc. | 0.03 | 2.82 | 1.7314 | 1.7314 | |||||
| SYK / Stryker Corporation | 0.02 | 2.67 | 1.6405 | 1.6405 | |||||
| CCI / Crown Castle Inc. | 0.02 | -1.16 | 2.51 | 0.40 | 1.5440 | 0.3362 | |||
| JPM / JPMorgan Chase & Co. | 0.02 | 2,518.57 | 2.02 | 1,595.80 | 1.2399 | 1.1825 | |||
| VZ / Verizon Communications Inc. | 0.03 | 181.93 | 1.46 | 146.62 | 0.8970 | 0.6114 | |||
| WMT / Walmart Inc. | 0.01 | -1.54 | 1.29 | -5.90 | 0.7932 | 0.1311 | |||
| PPL / PPL Corporation | 0.04 | 22.27 | 1.09 | -15.91 | 0.6691 | 0.0442 | |||
| MRK / Merck & Co., Inc. | 0.01 | -1.85 | 0.86 | -17.05 | 0.5259 | 0.0279 | |||
| ATRI / Atrion Corporation | 0.00 | 0.00 | 0.70 | -13.55 | 0.4313 | 0.0395 | |||
| KO / The Coca-Cola Company | 0.01 | 0.00 | 0.58 | -19.94 | 0.3576 | 0.0068 | |||
| UNP / Union Pacific Corporation | 0.00 | -11.66 | 0.40 | -31.09 | 0.2452 | -0.0342 | |||
| PM / Philip Morris International Inc. | 0.00 | 0.00 | 0.33 | -14.14 | 0.2052 | 0.0175 | |||
| CI / The Cigna Group | 0.00 | -23.58 | 0.31 | -33.83 | 0.1899 | -0.0355 | |||
| PEP / PepsiCo, Inc. | 0.00 | -22.80 | 0.18 | -32.23 | 0.1137 | -0.0181 | |||
| XOM / Exxon Mobil Corporation | 0.00 | -11.14 | 0.17 | -51.59 | 0.1026 | -0.0639 | |||
| EMR / Emerson Electric Co. | 0.00 | 0.00 | 0.16 | -37.70 | 0.0965 | -0.0251 | |||
| AGNC / AGNC Investment Corp. | 0.01 | 0.00 | 0.15 | -40.31 | 0.0946 | -0.0299 | |||
| MSFT / Microsoft Corporation | 0.00 | 0.00 | 0.15 | 0.00 | 0.0922 | 0.0198 | |||
| WFC / Wells Fargo & Company | 0.00 | 0.10 | 0.0614 | 0.0614 | |||||
| ABT / Abbott Laboratories | 0.00 | 0.00 | 0.08 | -8.24 | 0.0479 | 0.0069 | |||
| ADP / Automatic Data Processing, Inc. | 0.00 | 0.00 | 0.07 | -20.43 | 0.0455 | 0.0006 | |||
| IBM / International Business Machines Corporation | 0.00 | 0.00 | 0.07 | -17.28 | 0.0412 | 0.0021 | |||
| BIP / Brookfield Infrastructure Partners L.P. - Limited Partnership | 0.00 | 0.00 | 0.05 | -28.38 | 0.0326 | -0.0031 | |||
| PFE / Pfizer Inc. | 0.00 | 0.00 | 0.05 | -16.67 | 0.0307 | 0.0018 | |||
| PJT / PJT Partners Inc. | 0.00 | -18.78 | 0.05 | -22.22 | 0.0301 | -0.0003 | |||
| RTN / Raytheon Co. | 0.00 | 0.00 | 0.05 | -39.74 | 0.0289 | -0.0088 | |||
| AAPL / Apple Inc. | 0.00 | -100.00 | 0.00 | -100.00 | -2.9209 | ||||
| TMO / Thermo Fisher Scientific Inc. | 0.00 | -100.00 | 0.00 | -100.00 | -1.6614 | ||||
| DIS / The Walt Disney Company | 0.00 | -100.00 | 0.00 | -100.00 | -5.4114 | ||||
| LAMR / Lamar Advertising Company | 0.00 | -100.00 | 0.00 | -100.00 | -4.2808 | ||||
| AVLR / Avalara Inc | 0.00 | -100.00 | 0.00 | -100.00 | -0.7586 | ||||
| SCHW / The Charles Schwab Corporation | 0.00 | -100.00 | 0.00 | -100.00 | -1.6363 | ||||
| DAL / Delta Air Lines, Inc. | 0.00 | -100.00 | 0.00 | -100.00 | -3.5468 | ||||
| LW / Lamb Weston Holdings, Inc. | 0.00 | -100.00 | 0.00 | -100.00 | -3.6809 | ||||
| BA / The Boeing Company | 0.00 | -100.00 | 0.00 | 0.0000 | |||||
| CVX / Chevron Corporation | 0.00 | -100.00 | 0.00 | -100.00 | -0.4744 | ||||
| ENB / Enbridge Inc. | 0.00 | -100.00 | 0.00 | -100.00 | -1.5152 | ||||
| BKNG / Booking Holdings Inc. | 0.00 | -100.00 | 0.00 | -100.00 | -2.6251 | ||||
| NRZ / New Residential Investment Corp | 0.00 | -100.00 | 0.00 | -100.00 | -1.0698 |