Mga Batayang Estadistika
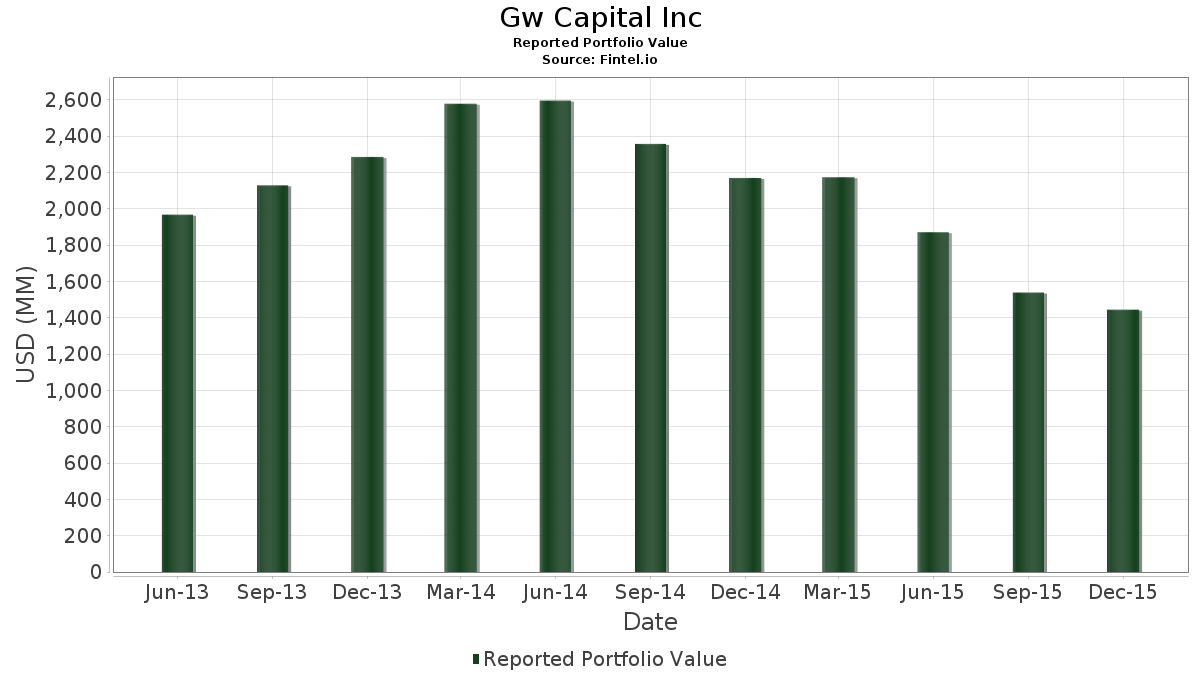
| Nilai Portofolio | $ 1,444,075,000 |
| Posisi Saat Ini | 93 |
Kepemilikan Terbaru, Kinerja, AUM (dari 13F, 13D)
Gw Capital Inc telah mengungkapkan total kepemilikan 93 dalam pengajuan SEC terbaru mereka. Nilai portofolio terbaru dihitung sebesar $ 1,444,075,000 USD. Aset yang Dikelola (AUM) sebenarnya adalah nilai ini ditambah kas (yang tidak diungkapkan). Aset-aset utama Gw Capital Inc adalah Casey's General Stores, Inc. (US:CASY) , Darling Ingredients Inc. (US:DAR) , Crown Holdings, Inc. (US:CCK) , Omega Healthcare Investors, Inc. (US:OHI) , and Verisk Analytics, Inc. (US:VRSK) . Posisi baru Gw Capital Inc meliputi: Old National Bancorp (US:ONB) , Fifth Third Bancorp (US:FITB) , ITC Holdings Corp. (US:465685105) , Premier, Inc. (US:PINC) , and Jefferies Group Inc Bond (US:472319AG7) .
Peningkatan Tertinggi Kuartal Ini
Kami menggunakan perubahan dalam alokasi portofolio karena ini adalah metrik yang paling bermakna. Perubahan dapat disebabkan oleh perdagangan atau perubahan harga saham.
| Keamanan | Saham (MM) |
Nilai (Juta Dolar AS) |
Portfolio % | ΔPorsyento ng Portfolio |
|---|---|---|---|---|
| 1.22 | 16.52 | 1.1440 | 1.1440 | |
| 0.07 | 29.44 | 2.0390 | 0.9871 | |
| 0.58 | 11.63 | 0.8057 | 0.8057 | |
| 0.24 | 9.47 | 0.6561 | 0.6561 | |
| 0.23 | 7.95 | 0.5508 | 0.5508 | |
| 0.45 | 13.04 | 0.9031 | 0.5083 | |
| 0.77 | 39.29 | 2.7206 | 0.3953 | |
| 0.60 | 18.80 | 1.3017 | 0.3775 | |
| 0.37 | 44.74 | 3.0980 | 0.3688 | |
| 0.16 | 5.18 | 0.3591 | 0.3591 |
Penurunan Tertinggi Kuartal Ini
Kami menggunakan perubahan dalam alokasi portofolio karena ini adalah metrik yang paling bermakna. Perubahan dapat disebabkan oleh perdagangan atau perubahan harga saham.
| Keamanan | Saham (MM) |
Nilai (Juta Dolar AS) |
Portfolio % | ΔPorsyento ng Portfolio |
|---|---|---|---|---|
| 0.00 | 0.00 | -2.7492 | ||
| 0.00 | 0.00 | -1.1373 | ||
| 0.00 | 0.00 | -0.8129 | ||
| 0.69 | 18.90 | 1.3088 | -0.7424 | |
| 0.00 | 0.00 | -0.6830 | ||
| 0.00 | 0.00 | -0.6630 | ||
| 0.33 | 11.55 | 0.8000 | -0.5707 | |
| 1.23 | 8.58 | 0.5941 | -0.5327 | |
| 0.16 | 5.72 | 0.3960 | -0.4745 | |
| 1.57 | 28.93 | 2.0030 | -0.4470 |
Pengajuan 13F dan Dana
Formulir ini diajukan pada 2016-02-19 untuk periode pelaporan 2015-12-31. Klik ikon tautan untuk melihat riwayat transaksi selengkapnya.
Tingkatkan ke versi premium untuk membuka data premium dan ekspor ke Excel. ![]() .
.
| Keamanan | Ketik | Harga Saham Rata-rata | Saham (MM) |
ΔSaham (%) |
ΔSaham (%) |
Nilai ($MM) |
Portpolyo (%) |
ΔPortofolio (%) |
|
|---|---|---|---|---|---|---|---|---|---|
| CASY / Casey's General Stores, Inc. | 0.37 | -8.95 | 44.74 | 6.55 | 3.0980 | 0.3688 | |||
| DAR / Darling Ingredients Inc. | 3.94 | -6.31 | 41.47 | -12.31 | 2.8717 | -0.2024 | |||
| CCK / Crown Holdings, Inc. | 0.77 | -0.90 | 39.29 | 9.82 | 2.7206 | 0.3953 | |||
| OHI / Omega Healthcare Investors, Inc. | 1.10 | -2.45 | 38.33 | -2.92 | 2.6543 | 0.0878 | |||
| VRSK / Verisk Analytics, Inc. | 0.47 | -23.14 | 36.02 | -20.05 | 2.4943 | -0.4342 | |||
| OI / O-I Glass, Inc. | 2.02 | -2.86 | 35.13 | -18.33 | 2.4329 | -0.3634 | |||
| KEY / KeyCorp | 2.38 | -0.52 | 31.35 | 0.86 | 2.1711 | 0.1504 | |||
| XYL / Xylem Inc. | 0.86 | -0.65 | 31.31 | 10.39 | 2.1684 | 0.3245 | |||
| CABO / Cable One, Inc. | 0.07 | 75.97 | 29.44 | 81.96 | 2.0390 | 0.9871 | |||
| UNF / UniFirst Corporation | 0.28 | -10.02 | 29.23 | -12.22 | 2.0243 | -0.1404 | |||
| BKD / Brookdale Senior Living Inc. | 1.57 | -4.55 | 28.93 | -23.26 | 2.0030 | -0.4470 | |||
| PBH / Prestige Consumer Healthcare Inc. | 0.54 | -13.04 | 27.92 | -0.87 | 1.9334 | 0.1026 | |||
| AGO / Assured Guaranty Ltd. | 1.01 | -19.83 | 26.76 | -15.24 | 1.8530 | -0.1992 | |||
| SXT / Sensient Technologies Corporation | 0.41 | -12.56 | 25.44 | -10.40 | 1.7619 | -0.0838 | |||
| CORE / Core-Mark Hldg Co Inc | 0.31 | -10.65 | 25.30 | 11.87 | 1.7520 | 0.2819 | |||
| RWT / Redwood Trust, Inc. | 1.83 | -9.29 | 24.18 | -13.48 | 1.6743 | -0.1422 | |||
| ASH / Ashland Inc. | 0.22 | 4.73 | 23.11 | 6.90 | 1.6001 | 0.1951 | |||
| NWBI / Northwest Bancshares, Inc. | 1.67 | -12.63 | 22.41 | -10.01 | 1.5520 | -0.0668 | |||
| LBRDA / Liberty Broadband Corporation | 0.12 | 0.00 | 22.28 | 4.12 | 1.5431 | 0.1520 | |||
| AIN / Albany International Corp. | 0.59 | -13.55 | 21.59 | 10.44 | 1.4948 | 0.2243 | |||
| DLTR / Dollar Tree, Inc. | 0.28 | 0.00 | 21.41 | 15.84 | 1.4827 | 0.2813 | |||
| IRM / Iron Mountain Incorporated | 0.78 | 2.66 | 21.13 | -10.61 | 1.4635 | -0.0733 | |||
| TSN / Tyson Foods, Inc. | 0.39 | 0.00 | 20.95 | 23.74 | 1.4508 | 0.3502 | |||
| FLR / Fluor Corporation | 0.44 | -0.85 | 20.83 | 10.56 | 1.4425 | 0.2178 | |||
| IBKC / IBERIABANK Corp. | 0.36 | -13.09 | 19.90 | -17.78 | 1.3779 | -0.1951 | |||
| KLIC / Kulicke and Soffa Industries, Inc. | 1.70 | -13.78 | 19.88 | 9.61 | 1.3764 | 0.1977 | |||
| TGNA / TEGNA Inc. | 0.77 | 0.00 | 19.59 | 13.98 | 1.3564 | 0.2393 | |||
| ATNI / ATN International, Inc. | 0.25 | -12.69 | 19.48 | -7.62 | 1.3490 | -0.0217 | |||
| JNPR / Juniper Networks, Inc. | 0.69 | 0.00 | 19.02 | 7.35 | 1.3175 | 0.1655 | |||
| 163893209 / Chemtura Corp. | 0.69 | -37.14 | 18.90 | -40.11 | 1.3088 | -0.7424 | |||
| OMCL / Omnicell, Inc. | 0.60 | 32.29 | 18.80 | 32.21 | 1.3017 | 0.3775 | |||
| ALEX / Alexander & Baldwin, Inc. | 0.51 | -12.96 | 18.11 | -10.47 | 1.2543 | -0.0608 | |||
| MLI / Mueller Industries, Inc. | 0.66 | -12.83 | 17.76 | -20.14 | 1.2296 | -0.2157 | |||
| ESL / Esterline Technologies Corp. | 0.22 | -26.24 | 17.53 | -16.90 | 1.2140 | -0.1573 | |||
| HRI / Herc Holdings Inc. | 1.22 | -0.85 | 17.41 | -15.66 | 1.2057 | -0.1363 | |||
| BKU / BankUnited, Inc. | 0.48 | -0.80 | 17.23 | 0.07 | 1.1934 | 0.0740 | |||
| MTB / M&T Bank Corporation | 0.14 | 7.95 | 17.21 | 7.27 | 1.1918 | 0.1489 | |||
| ONB / Old National Bancorp | 1.22 | 16.52 | 1.1440 | 1.1440 | |||||
| CTAS / Cintas Corporation | 0.18 | 0.00 | 16.23 | 6.18 | 1.1237 | 0.1303 | |||
| WY / Weyerhaeuser Company | 0.53 | 0.00 | 15.80 | 9.65 | 1.0944 | 0.1575 | |||
| ATVI / Activision Blizzard Inc | 0.40 | -28.19 | 15.54 | -10.02 | 1.0763 | -0.0464 | |||
| BOBE / Bob Evans Farms, Inc. | 0.39 | -13.32 | 15.33 | -22.32 | 1.0613 | -0.2211 | |||
| CLW / Clearwater Paper Corporation | 0.33 | -13.28 | 15.17 | -16.42 | 1.0506 | -0.1293 | |||
| URI / United Rentals, Inc. | 0.21 | 0.00 | 15.04 | 20.80 | 1.0416 | 0.2322 | |||
| AIR / AAR Corp. | 0.57 | -13.64 | 14.98 | 19.69 | 1.0372 | 0.2238 | |||
| DOOR / Masonite International Corporation | 0.24 | 12.88 | 14.63 | 14.09 | 1.0130 | 0.1796 | |||
| JCI / Johnson Controls International plc | 0.45 | 0.00 | 14.27 | -4.69 | 0.9880 | 0.0150 | |||
| EMN / Eastman Chemical Company | 0.20 | 0.00 | 13.58 | 4.31 | 0.9407 | 0.0942 | |||
| OKE / ONEOK, Inc. | 0.55 | -0.09 | 13.49 | -23.49 | 0.9344 | -0.2119 | |||
| IPHS / Innophos Holdings, Inc. | 0.45 | 193.72 | 13.04 | 114.72 | 0.9031 | 0.5083 | |||
| SNDK / Sandisk Corporation | 0.17 | -41.88 | 12.94 | -18.71 | 0.8961 | -0.1386 | |||
| TARO / Taro Pharmaceutical Industries Ltd. | 0.08 | -0.92 | 12.28 | 7.15 | 0.8506 | 0.1055 | |||
| STMP / Stamps.com Inc. | 0.11 | -11.82 | 12.19 | 30.60 | 0.8440 | 0.2374 | |||
| UFS / Domtar Corporation | 0.32 | -1.43 | 11.83 | 1.89 | 0.8191 | 0.0645 | |||
| FITB / Fifth Third Bancorp | 0.58 | 11.63 | 0.8057 | 0.8057 | |||||
| BGS / B&G Foods, Inc. | 0.33 | -42.97 | 11.55 | -45.21 | 0.8000 | -0.5707 | |||
| HEES / H&E Equipment Services, Inc. | 0.65 | -13.95 | 11.31 | -10.04 | 0.7835 | -0.0340 | |||
| TPC / Tutor Perini Corporation | 0.66 | -13.55 | 11.12 | -12.08 | 0.7697 | -0.0521 | |||
| 748356102 / Questar Corp. | 0.57 | -2.39 | 11.02 | -2.04 | 0.7631 | 0.0319 | |||
| RSG / Republic Services, Inc. | 0.25 | 0.00 | 10.99 | 6.77 | 0.7614 | 0.0920 | |||
| IM / Ingram Micro Inc. | 0.36 | -0.51 | 10.92 | 10.96 | 0.7564 | 0.1165 | |||
| POLY / Plantronics, Inc. | 0.22 | 50.50 | 10.60 | 40.36 | 0.7343 | 0.2432 | |||
| LFUS / Littelfuse, Inc. | 0.10 | -1.63 | 10.40 | 15.49 | 0.7204 | 0.1349 | |||
| US35904G1076 / Altisource Residential Corp | 0.84 | -13.35 | 10.38 | -22.75 | 0.7190 | -0.1546 | |||
| CCEP / Coca-Cola Europacific Partners PLC | 0.21 | 0.00 | 10.35 | 1.84 | 0.7164 | 0.0561 | |||
| EHC / Encompass Health Corporation | 0.29 | -1.76 | 10.23 | -10.88 | 0.7081 | -0.0377 | |||
| NLSN / Nielsen Holdings plc | 0.22 | 0.00 | 10.16 | 4.79 | 0.7034 | 0.0733 | |||
| US2296691064 / Cubic Corporation | 0.21 | -12.51 | 9.87 | -1.43 | 0.6836 | 0.0326 | |||
| NVR / NVR, Inc. | 0.01 | -1.28 | 9.78 | 6.34 | 0.6772 | 0.0794 | |||
| 465685105 / ITC Holdings Corp. | 0.24 | 9.47 | 0.6561 | 0.6561 | |||||
| LYV / Live Nation Entertainment, Inc. | 0.38 | -0.70 | 9.34 | 1.49 | 0.6467 | 0.0486 | |||
| ARRS / ARRIS International plc | 0.30 | 0.70 | 9.21 | 18.54 | 0.6376 | 0.1327 | |||
| TDW / Tidewater Inc. | 1.23 | -6.56 | 8.58 | -50.51 | 0.5941 | -0.5327 | |||
| PINC / Premier, Inc. | 0.23 | 7.95 | 0.5508 | 0.5508 | |||||
| TRCO / Tribune Media Company | 0.23 | -2.31 | 7.90 | -7.23 | 0.5473 | -0.0065 | |||
| MAN / ManpowerGroup Inc. | 0.09 | 0.37 | 7.40 | 3.32 | 0.5125 | 0.0469 | |||
| WMB / The Williams Companies, Inc. | 0.25 | 0.00 | 6.34 | -30.26 | 0.4388 | -0.1518 | |||
| POR / Portland General Electric Company | 0.16 | -56.59 | 5.72 | -57.30 | 0.3960 | -0.4745 | |||
| 472319AG7 / Jefferies Group Inc Bond | 5.67 | -1.96 | 0.3924 | 0.0167 | |||||
| AGX / Argan, Inc. | 0.16 | 5.18 | 0.3591 | 0.3591 | |||||
| PCL / PGIM ETF Trust - PGIM Corporate Bond 10+ Year ETF | 0.10 | -2.01 | 4.88 | 18.34 | 0.3378 | 0.0699 | |||
| NWE / NorthWestern Energy Group, Inc. | 0.08 | -1.31 | 4.59 | -0.54 | 0.3182 | 0.0179 | |||
| IWN / iShares Trust - iShares Russell 2000 Value ETF | 0.04 | 357.34 | 3.41 | 366.62 | 0.2362 | 0.1887 | |||
| SHEN / Shenandoah Telecommunications Company | 0.13 | 2.70 | 0.1870 | 0.1870 | |||||
| UNH / UnitedHealth Group Incorporated | 0.02 | 0.00 | 2.60 | 1.41 | 0.1798 | 0.0134 | |||
| AMAT / Applied Materials, Inc. | 0.11 | 0.00 | 2.00 | 27.08 | 0.1388 | 0.0363 | |||
| ECL / Ecolab Inc. | 0.02 | 0.00 | 1.84 | 4.25 | 0.1273 | 0.0127 | |||
| ESRX / Express Scripts Holding Co. | 0.02 | 0.00 | 1.67 | 8.01 | 0.1158 | 0.0152 | |||
| DFS / Discover Financial Services | 0.03 | 0.00 | 1.46 | 3.17 | 0.1014 | 0.0091 | |||
| PXD / Pioneer Natural Resources Company | 0.01 | 0.00 | 1.15 | 3.04 | 0.0798 | 0.0071 | |||
| VIEIX / Vanguard Index Funds - Vanguard Index Trust Extended Market Index Fund Institutional | 0.01 | 40.64 | 1.09 | 44.46 | 0.0758 | 0.0758 | |||
| MOS / The Mosaic Company | 0.04 | 0.00 | 0.98 | -11.32 | 0.0678 | -0.0040 | |||
| IWS / iShares Trust - iShares Russell Mid-Cap Value ETF | 0.01 | 303.46 | 0.35 | 314.12 | 0.0244 | 0.0189 | |||
| CNO / CNO Financial Group, Inc. | 0.00 | -100.00 | 0.00 | -100.00 | -2.7492 | ||||
| SBRA / Sabra Health Care REIT, Inc. | 0.00 | -100.00 | 0.00 | -100.00 | -0.8129 | ||||
| GNRC / Generac Holdings Inc. | 0.00 | 0.00 | 0.0000 | 0.0000 | |||||
| AMBC / Ambac Financial Group, Inc. | 0.00 | 0.00 | 0.0000 | 0.0000 | |||||
| MBI / MBIA Inc. | 0.00 | 0.00 | 0.0000 | 0.0000 | |||||
| B / Barrick Mining Corporation | 0.00 | -100.00 | 0.00 | -100.00 | -0.6630 | ||||
| GHC / Graham Holdings Company | 0.00 | -100.00 | 0.00 | -100.00 | -0.6830 | ||||
| BAX / Baxter International Inc. | 0.00 | 0.00 | 0.0000 | 0.0000 | |||||
| 58441K100 / Media General, Inc. | 0.00 | 0.00 | 0.0000 | 0.0000 | |||||
| GCI / Gannett Co., Inc. | 0.00 | 0.00 | 0.0000 | 0.0000 | |||||
| GNW / Genworth Financial, Inc. | 0.00 | -100.00 | 0.00 | -100.00 | -1.1373 |