Mga Batayang Estadistika
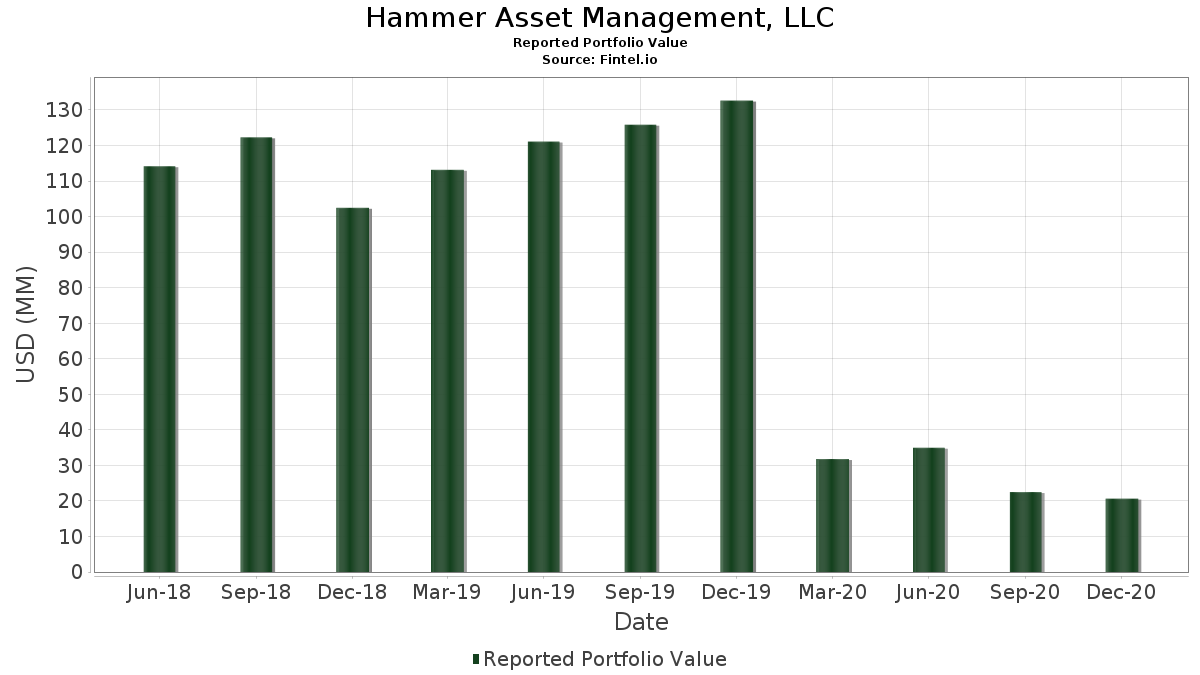
| Nilai Portofolio | $ 20,639,000 |
| Posisi Saat Ini | 41 |
Kepemilikan Terbaru, Kinerja, AUM (dari 13F, 13D)
Hammer Asset Management, LLC telah mengungkapkan total kepemilikan 41 dalam pengajuan SEC terbaru mereka. Nilai portofolio terbaru dihitung sebesar $ 20,639,000 USD. Aset yang Dikelola (AUM) sebenarnya adalah nilai ini ditambah kas (yang tidak diungkapkan). Aset-aset utama Hammer Asset Management, LLC adalah Barings Corporate Investors (US:MCI) , AbbVie Inc. (US:ABBV) , Verizon Communications Inc. (US:VZ) , Cummins Inc. (US:CMI) , and Apple Inc. (US:AAPL) . Posisi baru Hammer Asset Management, LLC meliputi: THOR Industries, Inc. (US:THO) , .
Peningkatan Tertinggi Kuartal Ini
Kami menggunakan perubahan dalam alokasi portofolio karena ini adalah metrik yang paling bermakna. Perubahan dapat disebabkan oleh perdagangan atau perubahan harga saham.
| Keamanan | Saham (MM) |
Nilai (Juta Dolar AS) |
Portfolio % | ΔPorsyento ng Portfolio |
|---|---|---|---|---|
| 0.00 | 0.46 | 2.2191 | 2.2191 | |
| 0.01 | 0.57 | 2.7666 | 0.6678 | |
| 0.01 | 0.42 | 2.0398 | 0.5680 | |
| 0.01 | 0.56 | 2.6939 | 0.5284 | |
| 0.01 | 0.39 | 1.8799 | 0.5237 | |
| 0.01 | 0.58 | 2.8296 | 0.5085 | |
| 0.01 | 0.71 | 3.4546 | 0.4665 | |
| 0.02 | 0.54 | 2.6116 | 0.4638 | |
| 0.00 | 0.61 | 2.9604 | 0.4614 | |
| 0.04 | 0.61 | 2.9604 | 0.4347 |
Penurunan Tertinggi Kuartal Ini
Kami menggunakan perubahan dalam alokasi portofolio karena ini adalah metrik yang paling bermakna. Perubahan dapat disebabkan oleh perdagangan atau perubahan harga saham.
| Keamanan | Saham (MM) |
Nilai (Juta Dolar AS) |
Portfolio % | ΔPorsyento ng Portfolio |
|---|---|---|---|---|
| 0.01 | 0.67 | 3.2366 | -2.8597 | |
| 0.00 | 0.00 | -1.1383 | ||
| 0.00 | 0.40 | 1.9187 | -0.9805 | |
| 0.01 | 0.59 | 2.8829 | -0.8789 | |
| 0.01 | 0.48 | 2.3499 | -0.8205 | |
| 0.00 | 0.37 | 1.7830 | -0.4981 | |
| 0.07 | 0.89 | 4.3122 | -0.3300 | |
| 0.00 | 0.43 | 2.1077 | -0.3157 | |
| 0.00 | 0.42 | 2.0447 | -0.3031 | |
| 0.01 | 0.48 | 2.3499 | -0.2825 |
Pengajuan 13F dan Dana
Formulir ini diajukan pada 2021-01-19 untuk periode pelaporan 2020-12-31. Klik ikon tautan untuk melihat riwayat transaksi selengkapnya.
Tingkatkan ke versi premium untuk membuka data premium dan ekspor ke Excel. ![]() .
.
| Keamanan | Ketik | Harga Saham Rata-rata | Saham (MM) |
ΔSaham (%) |
ΔSaham (%) |
Nilai ($MM) |
Portpolyo (%) |
ΔPortofolio (%) |
|
|---|---|---|---|---|---|---|---|---|---|
| MCI / Barings Corporate Investors | 0.07 | -19.16 | 0.89 | -14.75 | 4.3122 | -0.3300 | |||
| ABBV / AbbVie Inc. | 0.01 | -13.23 | 0.71 | 6.10 | 3.4546 | 0.4665 | |||
| VZ / Verizon Communications Inc. | 0.01 | -6.72 | 0.69 | -7.81 | 3.3190 | 0.0151 | |||
| CMI / Cummins Inc. | 0.00 | -16.96 | 0.68 | -10.70 | 3.3141 | -0.0920 | |||
| AAPL / Apple Inc. | 0.01 | -57.47 | 0.67 | -51.28 | 3.2366 | -2.8597 | |||
| TJX / The TJX Companies, Inc. | 0.01 | -30.68 | 0.67 | -14.96 | 3.2221 | -0.2552 | |||
| GPK / Graphic Packaging Holding Company | 0.04 | -16.28 | 0.65 | 0.77 | 3.1639 | 0.2825 | |||
| CAT / Caterpillar Inc. | 0.00 | -10.88 | 0.61 | 8.72 | 2.9604 | 0.4614 | |||
| AFT / Apollo Senior Floating Rate Fund Inc. | 0.04 | -4.22 | 0.61 | 7.57 | 2.9604 | 0.4347 | |||
| MPV / Barings Participation Investors | 0.05 | -2.42 | 0.60 | 6.76 | 2.9071 | 0.4081 | |||
| VICSX / Vanguard Scottsdale Funds - Vanguard IT Corporate Bond Index Fund Admiral | 0.01 | -30.66 | 0.59 | -29.67 | 2.8829 | -0.8789 | |||
| TSM / Taiwan Semiconductor Manufacturing Company Limited - Depositary Receipt (Common Stock) | 0.01 | -21.76 | 0.59 | 5.20 | 2.8441 | 0.3629 | |||
| GM / General Motors Company | 0.01 | -20.53 | 0.58 | 11.88 | 2.8296 | 0.5085 | |||
| AMAT / Applied Materials, Inc. | 0.01 | -16.62 | 0.57 | 20.97 | 2.7666 | 0.6678 | |||
| AMGN / Amgen Inc. | 0.00 | -5.36 | 0.56 | -14.42 | 2.7327 | -0.1976 | |||
| SWKS / Skyworks Solutions, Inc. | 0.00 | -18.16 | 0.56 | -13.98 | 2.7133 | -0.1814 | |||
| IP / International Paper Company | 0.01 | -6.85 | 0.56 | 14.17 | 2.6939 | 0.5284 | |||
| GNTX / Gentex Corporation | 0.02 | -15.40 | 0.54 | 11.59 | 2.6116 | 0.4638 | |||
| UNP / Union Pacific Corporation | 0.00 | -15.70 | 0.53 | -10.79 | 2.5631 | -0.0737 | |||
| EMN / Eastman Chemical Company | 0.01 | -23.78 | 0.51 | -2.11 | 2.4759 | 0.1548 | |||
| PFE / Pfizer Inc. | 0.01 | -16.52 | 0.49 | -16.24 | 2.3984 | -0.2296 | |||
| INTC / Intel Corporation | 0.01 | -14.85 | 0.48 | -18.07 | 2.3499 | -0.2825 | |||
| VCSH / Vanguard Scottsdale Funds - Vanguard Short-Term Corporate Bond ETF | 0.01 | -32.34 | 0.48 | -31.98 | 2.3499 | -0.8205 | |||
| MMM / 3M Company | 0.00 | -15.37 | 0.47 | -7.54 | 2.2579 | 0.0168 | |||
| THO / THOR Industries, Inc. | 0.00 | 0.46 | 2.2191 | 2.2191 | |||||
| ORCL / Oracle Corporation | 0.01 | 4.61 | 0.45 | 13.25 | 2.1949 | 0.4162 | |||
| BMY / Bristol-Myers Squibb Company | 0.01 | -3.05 | 0.44 | -0.46 | 2.1125 | 0.1649 | |||
| HD / The Home Depot, Inc. | 0.00 | -16.56 | 0.43 | -20.18 | 2.1077 | -0.3157 | |||
| LOW / Lowe's Companies, Inc. | 0.00 | -17.46 | 0.42 | -20.08 | 2.0447 | -0.3031 | |||
| C / Citigroup Inc. | 0.01 | -10.98 | 0.42 | 27.19 | 2.0398 | 0.5680 | |||
| WHR / Whirlpool Corporation | 0.00 | -8.63 | 0.41 | -10.35 | 1.9720 | -0.0468 | |||
| TSCO / Tractor Supply Company | 0.00 | -38.06 | 0.40 | -39.26 | 1.9187 | -0.9805 | |||
| MGA / Magna International Inc. | 0.01 | -17.73 | 0.39 | 27.21 | 1.8799 | 0.5237 | |||
| BBY / Best Buy Co., Inc. | 0.00 | -20.06 | 0.37 | -28.27 | 1.7830 | -0.4981 | |||
| RIO / Rio Tinto Group - Depositary Receipt (Common Stock) | 0.00 | -17.37 | 0.37 | 2.81 | 1.7733 | 0.1903 | |||
| CVX / Chevron Corporation | 0.00 | -17.68 | 0.35 | -3.55 | 1.7104 | 0.0829 | |||
| T / AT&T Inc. | 0.01 | -9.66 | 0.33 | -8.86 | 1.5941 | -0.0112 | |||
| GT / The Goodyear Tire & Rubber Company | 0.03 | -17.57 | 0.29 | 17.21 | 1.3857 | 0.3008 | |||
| NUE / Nucor Corporation | 0.01 | -5.30 | 0.28 | 12.20 | 1.3373 | 0.2434 | |||
| LUV / Southwest Airlines Co. | 0.01 | -17.56 | 0.27 | 2.24 | 1.3276 | 0.1359 | |||
| BHP / BHP Group Limited - Depositary Receipt (Common Stock) | 0.00 | -33.67 | 0.26 | -16.19 | 1.2791 | -0.1216 | |||
| UPS / United Parcel Service, Inc. | 0.00 | -100.00 | 0.00 | -100.00 | -1.1383 |