Mga Batayang Estadistika
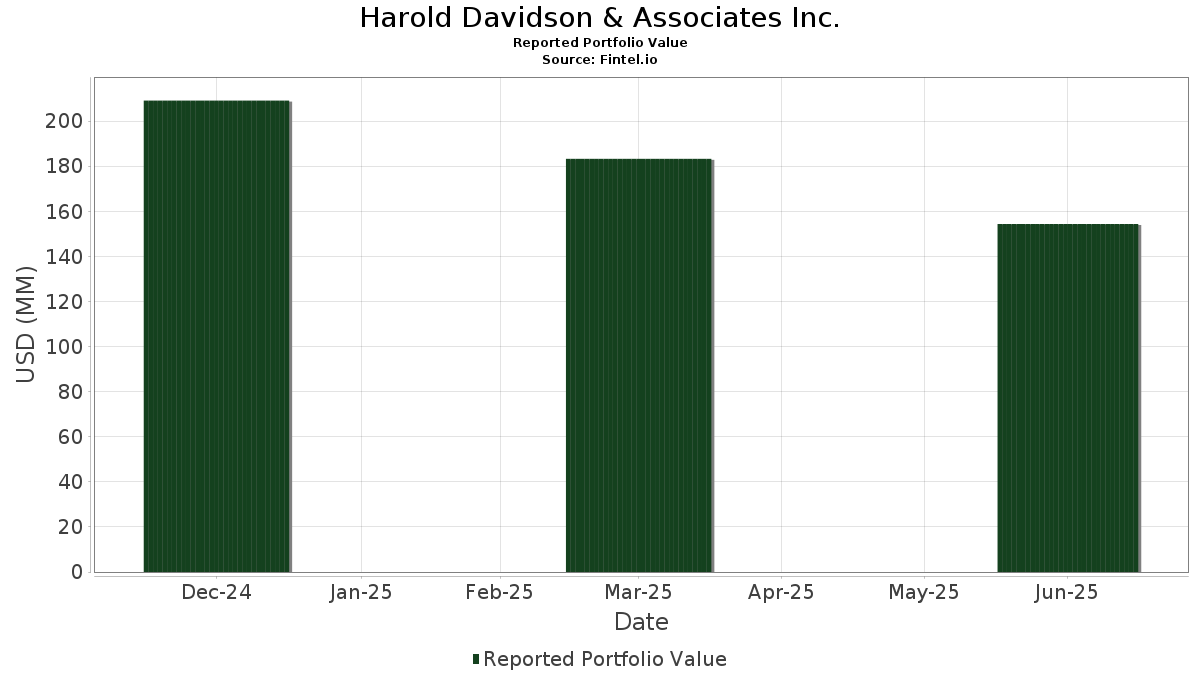
| Nilai Portofolio | $ 154,336,392 |
| Posisi Saat Ini | 62 |
Kepemilikan Terbaru, Kinerja, AUM (dari 13F, 13D)
Harold Davidson & Associates Inc. telah mengungkapkan total kepemilikan 62 dalam pengajuan SEC terbaru mereka. Nilai portofolio terbaru dihitung sebesar $ 154,336,392 USD. Aset yang Dikelola (AUM) sebenarnya adalah nilai ini ditambah kas (yang tidak diungkapkan). Aset-aset utama Harold Davidson & Associates Inc. adalah Apple Inc. (US:AAPL) , Cisco Systems, Inc. (US:CSCO) , Microsoft Corporation (US:MSFT) , Visa Inc. (US:V) , and CrowdStrike Holdings, Inc. (US:CRWD) . Posisi baru Harold Davidson & Associates Inc. meliputi: Quanta Services, Inc. (US:PWR) , Wells Fargo & Company (US:WFC) , Morgan Stanley (US:MS) , iShares Trust - iShares Russell 1000 Growth ETF (US:IWF) , and GE Vernova Inc. (US:GEV) .
Peningkatan Tertinggi Kuartal Ini
Kami menggunakan perubahan dalam alokasi portofolio karena ini adalah metrik yang paling bermakna. Perubahan dapat disebabkan oleh perdagangan atau perubahan harga saham.
| Keamanan | Saham (MM) |
Nilai (Juta Dolar AS) |
Portfolio % | ΔPorsyento ng Portfolio |
|---|---|---|---|---|
| 0.03 | 17.25 | 11.1754 | 2.7373 | |
| 0.26 | 18.36 | 11.8949 | 2.2908 | |
| 0.00 | 1.43 | 0.9275 | 0.9275 | |
| 0.02 | 1.40 | 0.9044 | 0.9044 | |
| 0.03 | 4.16 | 2.6928 | 0.5226 | |
| 0.01 | 4.16 | 2.6984 | 0.2560 | |
| 0.01 | 4.25 | 2.7538 | 0.2356 | |
| 0.00 | 1.28 | 0.8272 | 0.2352 | |
| 0.00 | 0.32 | 0.2090 | 0.2090 | |
| 0.00 | 0.27 | 0.1780 | 0.1780 |
Penurunan Tertinggi Kuartal Ini
Kami menggunakan perubahan dalam alokasi portofolio karena ini adalah metrik yang paling bermakna. Perubahan dapat disebabkan oleh perdagangan atau perubahan harga saham.
| Keamanan | Saham (MM) |
Nilai (Juta Dolar AS) |
Portfolio % | ΔPorsyento ng Portfolio |
|---|---|---|---|---|
| 0.16 | 32.81 | 21.2615 | -3.6579 | |
| 0.00 | 1.44 | 0.9361 | -0.5244 | |
| 0.00 | 2.52 | 1.6355 | -0.4825 | |
| 0.02 | 5.66 | 3.6700 | -0.4500 | |
| 0.01 | 1.29 | 0.8382 | -0.4285 | |
| 0.00 | 1.91 | 1.2376 | -0.3050 | |
| 0.01 | 0.95 | 0.6134 | -0.2572 | |
| 0.00 | 4.05 | 2.6240 | -0.2565 | |
| 0.01 | 2.83 | 1.8368 | -0.2354 | |
| 0.01 | 1.88 | 1.2202 | -0.2339 |
Pengajuan 13F dan Dana
Formulir ini diajukan pada 2025-08-11 untuk periode pelaporan 2025-06-30. Klik ikon tautan untuk melihat riwayat transaksi selengkapnya.
Tingkatkan ke versi premium untuk membuka data premium dan ekspor ke Excel. ![]() .
.
| Keamanan | Ketik | Harga Saham Rata-rata | Saham (MM) |
ΔSaham (%) |
ΔSaham (%) |
Nilai ($MM) |
Portpolyo (%) |
ΔPortofolio (%) |
|
|---|---|---|---|---|---|---|---|---|---|
| AAPL / Apple Inc. | 0.16 | -22.20 | 32.81 | -28.14 | 21.2615 | -3.6579 | |||
| CSCO / Cisco Systems, Inc. | 0.26 | -7.22 | 18.36 | 4.32 | 11.8949 | 2.2908 | |||
| MSFT / Microsoft Corporation | 0.03 | -15.82 | 17.25 | 11.54 | 11.1754 | 2.7373 | |||
| V / Visa Inc. | 0.02 | -25.94 | 5.66 | -24.97 | 3.6700 | -0.4500 | |||
| CRWD / CrowdStrike Holdings, Inc. | 0.01 | -36.24 | 4.25 | -7.89 | 2.7538 | 0.2356 | |||
| JPM / JPMorgan Chase & Co. | 0.01 | -21.27 | 4.16 | -6.95 | 2.6984 | 0.2560 | |||
| NVDA / NVIDIA Corporation | 0.03 | -28.31 | 4.16 | 4.50 | 2.6928 | 0.5226 | |||
| COST / Costco Wholesale Corporation | 0.00 | -26.70 | 4.05 | -23.29 | 2.6240 | -0.2565 | |||
| GE / General Electric Company | 0.01 | -29.14 | 3.58 | -8.85 | 2.3216 | 0.1759 | |||
| AMZN / Amazon.com, Inc. | 0.01 | -32.43 | 3.28 | -22.08 | 2.1240 | -0.1720 | |||
| TJX / The TJX Companies, Inc. | 0.03 | -19.21 | 3.22 | -18.10 | 2.0876 | -0.0589 | |||
| HD / The Home Depot, Inc. | 0.01 | -25.37 | 2.83 | -25.36 | 1.8368 | -0.2354 | |||
| META / Meta Platforms, Inc. | 0.00 | -31.47 | 2.79 | -12.24 | 1.8068 | 0.0728 | |||
| MA / Mastercard Incorporated | 0.00 | -36.56 | 2.52 | -34.97 | 1.6355 | -0.4825 | |||
| LLY / Eli Lilly and Company | 0.00 | -22.09 | 2.48 | -26.47 | 1.6072 | -0.2335 | |||
| SYK / Stryker Corporation | 0.01 | -30.09 | 2.43 | -25.70 | 1.5763 | -0.2104 | |||
| GOOGL / Alphabet Inc. | 0.01 | -28.16 | 2.31 | -18.14 | 1.4979 | -0.0432 | |||
| ADBE / Adobe Inc. | 0.00 | -33.01 | 1.91 | -32.41 | 1.2376 | -0.3050 | |||
| MAR / Marriott International, Inc. | 0.01 | -38.38 | 1.88 | -29.32 | 1.2202 | -0.2339 | |||
| ABBV / AbbVie Inc. | 0.01 | -1.77 | 1.78 | -12.95 | 1.1503 | 0.0370 | |||
| GS / The Goldman Sachs Group, Inc. | 0.00 | -33.07 | 1.46 | -13.31 | 0.9456 | 0.0271 | |||
| AXP / American Express Company | 0.00 | -39.64 | 1.45 | -28.44 | 0.9392 | -0.1662 | |||
| MCD / McDonald's Corporation | 0.00 | -42.29 | 1.44 | -46.04 | 0.9361 | -0.5244 | |||
| PWR / Quanta Services, Inc. | 0.00 | 1.43 | 0.9275 | 0.9275 | |||||
| LOW / Lowe's Companies, Inc. | 0.01 | -15.80 | 1.42 | -19.90 | 0.9211 | -0.0474 | |||
| WFC / Wells Fargo & Company | 0.02 | 1.40 | 0.9044 | 0.9044 | |||||
| CMG / Chipotle Mexican Grill, Inc. | 0.02 | -23.39 | 1.32 | -14.31 | 0.8574 | 0.0145 | |||
| RSG / Republic Services, Inc. | 0.01 | -28.17 | 1.31 | -26.87 | 0.8485 | -0.1284 | |||
| FTNT / Fortinet, Inc. | 0.01 | -49.25 | 1.29 | -44.29 | 0.8382 | -0.4285 | |||
| TSLA / Tesla, Inc. | 0.00 | -3.99 | 1.28 | 17.71 | 0.8272 | 0.2352 | |||
| CRM / Salesforce, Inc. | 0.00 | -30.27 | 1.21 | -29.16 | 0.7843 | -0.1480 | |||
| ADP / Automatic Data Processing, Inc. | 0.00 | -24.80 | 1.18 | -24.08 | 0.7639 | -0.0838 | |||
| ABT / Abbott Laboratories | 0.01 | -20.95 | 1.17 | -18.93 | 0.7577 | -0.0296 | |||
| NSC / Norfolk Southern Corporation | 0.00 | -35.74 | 1.11 | -30.56 | 0.7186 | -0.1529 | |||
| CB / Chubb Limited | 0.00 | -30.28 | 0.98 | -33.11 | 0.6351 | -0.1646 | |||
| KO / The Coca-Cola Company | 0.01 | -24.95 | 0.97 | -25.90 | 0.6270 | -0.0853 | |||
| XOM / Exxon Mobil Corporation | 0.01 | -34.53 | 0.95 | -40.69 | 0.6134 | -0.2572 | |||
| BRK.B / Berkshire Hathaway Inc. | 0.00 | -2.40 | 0.93 | -10.95 | 0.6009 | 0.0324 | |||
| NOW / ServiceNow, Inc. | 0.00 | -30.58 | 0.91 | -10.39 | 0.5929 | 0.0359 | |||
| LMT / Lockheed Martin Corporation | 0.00 | -21.53 | 0.86 | -18.64 | 0.5600 | -0.0197 | |||
| TXRH / Texas Roadhouse, Inc. | 0.00 | -30.28 | 0.84 | -21.65 | 0.5423 | -0.0402 | |||
| NOC / Northrop Grumman Corporation | 0.00 | -38.47 | 0.76 | -39.98 | 0.4937 | -0.1984 | |||
| NFLX / Netflix, Inc. | 0.00 | -0.64 | 0.62 | 42.86 | 0.4017 | 0.1646 | |||
| AVGO / Broadcom Inc. | 0.00 | 4.12 | 0.53 | 71.20 | 0.3433 | 0.1746 | |||
| AEP / American Electric Power Company, Inc. | 0.00 | -33.40 | 0.48 | -36.81 | 0.3140 | -0.1042 | |||
| DIS / The Walt Disney Company | 0.00 | -23.06 | 0.46 | -3.35 | 0.2992 | 0.0385 | |||
| GOOG / Alphabet Inc. | 0.00 | 0.00 | 0.43 | 13.39 | 0.2804 | 0.0724 | |||
| ODFL / Old Dominion Freight Line, Inc. | 0.00 | -34.97 | 0.43 | -36.26 | 0.2783 | -0.0891 | |||
| CVX / Chevron Corporation | 0.00 | -12.34 | 0.41 | -25.05 | 0.2662 | -0.0326 | |||
| BMY / Bristol-Myers Squibb Company | 0.01 | -31.65 | 0.36 | -48.14 | 0.2355 | -0.1468 | |||
| DUK / Duke Energy Corporation | 0.00 | -16.28 | 0.35 | -19.07 | 0.2260 | -0.0090 | |||
| BX / Blackstone Inc. | 0.00 | -5.34 | 0.34 | 1.18 | 0.2232 | 0.0376 | |||
| PAYX / Paychex, Inc. | 0.00 | -3.85 | 0.33 | -9.42 | 0.2121 | 0.0150 | |||
| MS / Morgan Stanley | 0.00 | 0.32 | 0.2090 | 0.2090 | |||||
| CSX / CSX Corporation | 0.01 | 0.00 | 0.29 | 10.57 | 0.1905 | 0.0458 | |||
| IWF / iShares Trust - iShares Russell 1000 Growth ETF | 0.00 | 0.27 | 0.1780 | 0.1780 | |||||
| BAC / Bank of America Corporation | 0.01 | -36.37 | 0.24 | -28.06 | 0.1568 | -0.0262 | |||
| CARR / Carrier Global Corporation | 0.00 | -6.38 | 0.24 | 8.07 | 0.1567 | 0.0346 | |||
| LSTR / Landstar System, Inc. | 0.00 | 0.00 | 0.24 | -7.45 | 0.1531 | 0.0138 | |||
| GEV / GE Vernova Inc. | 0.00 | 0.21 | 0.1365 | 0.1365 | |||||
| PANW / Palo Alto Networks, Inc. | 0.00 | 0.21 | 0.1334 | 0.1334 | |||||
| ALLO / Allogene Therapeutics, Inc. | 0.14 | -46.41 | 0.15 | -58.70 | 0.0990 | -0.1021 | |||
| PEP / PepsiCo, Inc. | 0.00 | -100.00 | 0.00 | 0.0000 | |||||
| H / Hyatt Hotels Corporation | 0.00 | -100.00 | 0.00 | 0.0000 | |||||
| IBM / International Business Machines Corporation | 0.00 | -100.00 | 0.00 | 0.0000 |