Mga Batayang Estadistika
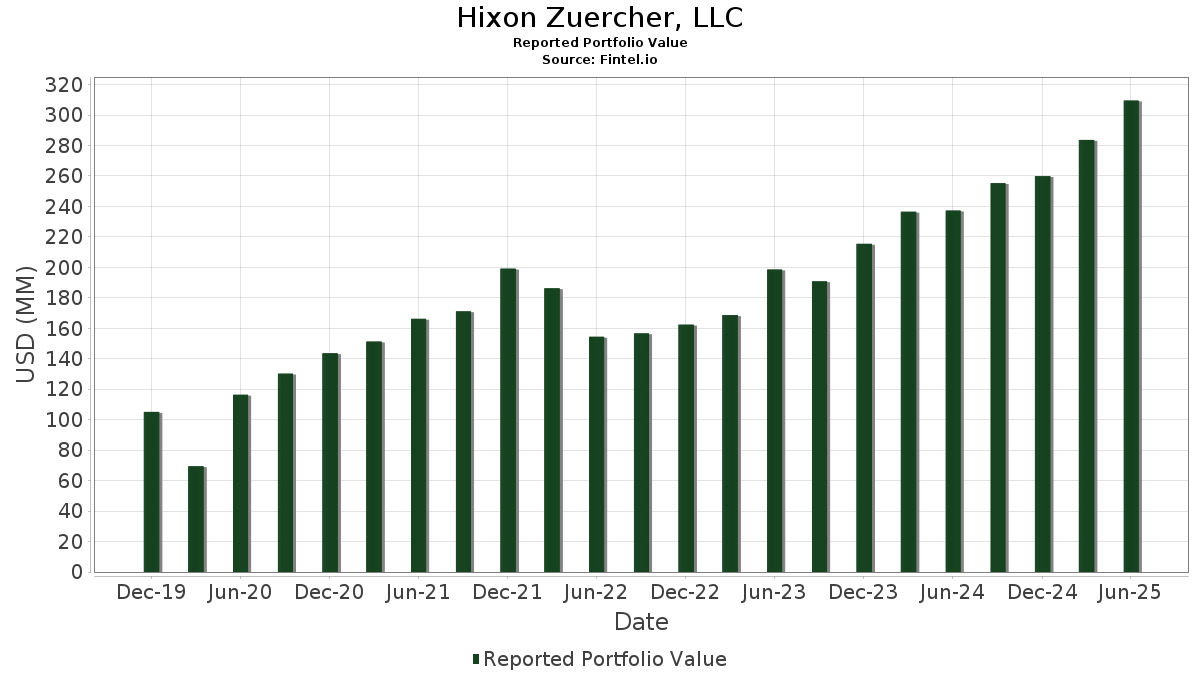
| Nilai Portofolio | $ 309,478,408 |
| Posisi Saat Ini | 78 |
Kepemilikan Terbaru, Kinerja, AUM (dari 13F, 13D)
Hixon Zuercher, LLC telah mengungkapkan total kepemilikan 78 dalam pengajuan SEC terbaru mereka. Nilai portofolio terbaru dihitung sebesar $ 309,478,408 USD. Aset yang Dikelola (AUM) sebenarnya adalah nilai ini ditambah kas (yang tidak diungkapkan). Aset-aset utama Hixon Zuercher, LLC adalah Goldman Sachs ETF Trust - Goldman Sachs ActiveBeta International Equity ETF (US:GSIE) , Goldman Sachs ETF Trust - Goldman Sachs ActiveBeta U.S. Large Cap Equity ETF (US:GSLC) , JPMorgan Chase & Co. (US:JPM) , Microsoft Corporation (US:MSFT) , and Stryker Corporation (US:SYK) .
Peningkatan Tertinggi Kuartal Ini
Kami menggunakan perubahan dalam alokasi portofolio karena ini adalah metrik yang paling bermakna. Perubahan dapat disebabkan oleh perdagangan atau perubahan harga saham.
| Keamanan | Saham (MM) |
Nilai (Juta Dolar AS) |
Portfolio % | ΔPorsyento ng Portfolio |
|---|---|---|---|---|
| 0.02 | 9.16 | 2.9587 | 0.8021 | |
| 0.05 | 7.82 | 2.5284 | 0.6013 | |
| 0.04 | 4.54 | 1.4662 | 0.5468 | |
| 0.02 | 3.14 | 1.0162 | 0.5070 | |
| 0.00 | 6.39 | 2.0644 | 0.4797 | |
| 0.01 | 6.96 | 2.2480 | 0.3702 | |
| 0.01 | 2.97 | 0.9582 | 0.2904 | |
| 0.01 | 6.04 | 1.9506 | 0.2773 | |
| 0.03 | 1.59 | 0.5125 | 0.2725 | |
| 0.01 | 2.46 | 0.7952 | 0.2564 |
Penurunan Tertinggi Kuartal Ini
Kami menggunakan perubahan dalam alokasi portofolio karena ini adalah metrik yang paling bermakna. Perubahan dapat disebabkan oleh perdagangan atau perubahan harga saham.
| Keamanan | Saham (MM) |
Nilai (Juta Dolar AS) |
Portfolio % | ΔPorsyento ng Portfolio |
|---|---|---|---|---|
| 0.02 | 5.21 | 1.6841 | -0.4447 | |
| 0.05 | 7.69 | 2.4852 | -0.4295 | |
| 0.01 | 1.49 | 0.4803 | -0.4054 | |
| 0.03 | 6.80 | 2.1976 | -0.3729 | |
| 0.06 | 6.07 | 1.9614 | -0.3699 | |
| 0.01 | 4.83 | 1.5604 | -0.3146 | |
| 0.03 | 4.04 | 1.3048 | -0.2794 | |
| 0.10 | 6.67 | 2.1538 | -0.2113 | |
| 0.04 | 2.65 | 0.8559 | -0.1937 | |
| 0.03 | 9.87 | 3.1878 | -0.1860 |
Pengajuan 13F dan Dana
Formulir ini diajukan pada 2025-07-31 untuk periode pelaporan 2025-06-30. Klik ikon tautan untuk melihat riwayat transaksi selengkapnya.
Tingkatkan ke versi premium untuk membuka data premium dan ekspor ke Excel. ![]() .
.
| Keamanan | Ketik | Harga Saham Rata-rata | Saham (MM) |
ΔSaham (%) |
ΔSaham (%) |
Nilai ($MM) |
Portpolyo (%) |
ΔPortofolio (%) |
|
|---|---|---|---|---|---|---|---|---|---|
| GSIE / Goldman Sachs ETF Trust - Goldman Sachs ActiveBeta International Equity ETF | 0.55 | 1.03 | 22.00 | 12.39 | 7.1097 | 0.2078 | |||
| GSLC / Goldman Sachs ETF Trust - Goldman Sachs ActiveBeta U.S. Large Cap Equity ETF | 0.09 | -5.60 | 10.32 | 4.09 | 3.3353 | -0.1610 | |||
| JPM / JPMorgan Chase & Co. | 0.03 | -12.77 | 9.87 | 3.09 | 3.1878 | -0.1860 | |||
| MSFT / Microsoft Corporation | 0.02 | 12.97 | 9.16 | 49.68 | 2.9587 | 0.8021 | |||
| SYK / Stryker Corporation | 0.02 | 0.50 | 8.99 | 6.81 | 2.9060 | -0.0628 | |||
| EMGF / iShares, Inc. - iShares Emerging Markets Equity Factor ETF | 0.17 | 1.46 | 8.71 | 12.93 | 2.8136 | 0.0952 | |||
| CAT / Caterpillar Inc. | 0.02 | -8.65 | 8.31 | 7.52 | 2.6853 | -0.0396 | |||
| JHMM / John Hancock Exchange-Traded Fund Trust - John Hancock Multifactor Mid Cap ETF | 0.13 | 9.34 | 8.20 | 16.65 | 2.6485 | 0.1712 | |||
| NVDA / NVIDIA Corporation | 0.05 | -1.79 | 7.82 | 43.17 | 2.5284 | 0.6013 | |||
| JNJ / Johnson & Johnson | 0.05 | 1.01 | 7.69 | -6.96 | 2.4852 | -0.4295 | |||
| MA / Mastercard Incorporated | 0.01 | -0.69 | 7.38 | 1.81 | 2.3858 | -0.1711 | |||
| AMZN / Amazon.com, Inc. | 0.03 | 0.23 | 7.32 | 15.59 | 2.3643 | 0.1323 | |||
| GS / The Goldman Sachs Group, Inc. | 0.01 | 0.82 | 6.96 | 30.62 | 2.2480 | 0.3702 | |||
| AAPL / Apple Inc. | 0.03 | 0.99 | 6.80 | -6.71 | 2.1976 | -0.3729 | |||
| NEE / NextEra Energy, Inc. | 0.10 | 1.47 | 6.67 | -0.64 | 2.1538 | -0.2113 | |||
| NFLX / Netflix, Inc. | 0.00 | -1.02 | 6.39 | 42.15 | 2.0644 | 0.4797 | |||
| XOM / Exxon Mobil Corporation | 0.06 | 1.28 | 6.07 | -8.21 | 1.9614 | -0.3699 | |||
| HON / Honeywell International Inc. | 0.03 | 2.99 | 6.04 | 13.26 | 1.9513 | 0.0717 | |||
| META / Meta Platforms, Inc. | 0.01 | -0.68 | 6.04 | 27.18 | 1.9506 | 0.2773 | |||
| COST / Costco Wholesale Corporation | 0.01 | 0.95 | 5.81 | 5.65 | 1.8785 | -0.0615 | |||
| WMT / Walmart Inc. | 0.06 | -0.17 | 5.39 | 11.19 | 1.7403 | 0.0326 | |||
| LOW / Lowe's Companies, Inc. | 0.02 | -9.26 | 5.21 | -13.68 | 1.6841 | -0.4447 | |||
| GOOGL / Alphabet Inc. | 0.03 | -1.99 | 4.94 | 11.67 | 1.5952 | 0.0369 | |||
| TLT / iShares Trust - iShares 20+ Year Treasury Bond ETF | 0.05 | 4.87 | 4.85 | 1.68 | 1.5659 | -0.1146 | |||
| SHV / iShares Trust - iShares Short Treasury Bond ETF | 0.04 | 1.88 | 4.83 | 1.85 | 1.5622 | -0.1115 | |||
| BRK.B / Berkshire Hathaway Inc. | 0.01 | -0.45 | 4.83 | -9.20 | 1.5604 | -0.3146 | |||
| SCHW / The Charles Schwab Corporation | 0.05 | -0.03 | 4.63 | 16.52 | 1.4949 | 0.0950 | |||
| DELL / Dell Technologies Inc. | 0.04 | 29.37 | 4.54 | 74.03 | 1.4662 | 0.5468 | |||
| CPRT / Copart, Inc. | 0.09 | 21.21 | 4.36 | 5.09 | 1.4075 | -0.0537 | |||
| PEP / PepsiCo, Inc. | 0.03 | 2.05 | 4.04 | -10.13 | 1.3048 | -0.2794 | |||
| CRM / Salesforce, Inc. | 0.01 | 0.55 | 3.92 | 2.16 | 1.2661 | -0.0861 | |||
| DOX / Amdocs Limited | 0.04 | -0.15 | 3.63 | -0.44 | 1.1731 | -0.1125 | |||
| AMD / Advanced Micro Devices, Inc. | 0.02 | 2.03 | 3.42 | 40.94 | 1.1060 | 0.2497 | |||
| BAC / Bank of America Corporation | 0.07 | 1.72 | 3.30 | 15.33 | 1.0649 | 0.0575 | |||
| ADBE / Adobe Inc. | 0.01 | 1.95 | 3.22 | 2.84 | 1.0398 | -0.0634 | |||
| JPST / J.P. Morgan Exchange-Traded Fund Trust - JPMorgan Ultra-Short Income ETF | 0.06 | 5.46 | 3.16 | 5.58 | 1.0209 | -0.0343 | |||
| MANH / Manhattan Associates, Inc. | 0.02 | 90.80 | 3.14 | 117.73 | 1.0162 | 0.5070 | |||
| ABT / Abbott Laboratories | 0.02 | -0.06 | 3.14 | 2.48 | 1.0158 | -0.0658 | |||
| DIS / The Walt Disney Company | 0.02 | 1.24 | 3.01 | 27.23 | 0.9724 | 0.1383 | |||
| ORCL / Oracle Corporation | 0.01 | 0.11 | 2.97 | 56.55 | 0.9582 | 0.2904 | |||
| TDG / TransDigm Group Incorporated | 0.00 | 0.05 | 2.93 | 9.98 | 0.9473 | 0.0075 | |||
| PGR / The Progressive Corporation | 0.01 | 34.60 | 2.91 | 26.96 | 0.9403 | 0.1319 | |||
| DLR / Digital Realty Trust, Inc. | 0.02 | -0.17 | 2.78 | 21.44 | 0.8969 | 0.0912 | |||
| GSSC / Goldman Sachs ETF Trust - Goldman Sachs ActiveBeta U.S. Small Cap Equity ETF | 0.04 | -17.74 | 2.65 | -11.05 | 0.8559 | -0.1937 | |||
| SBUX / Starbucks Corporation | 0.03 | 0.90 | 2.58 | -5.77 | 0.8340 | -0.1314 | |||
| AVGO / Broadcom Inc. | 0.01 | -2.19 | 2.46 | 61.06 | 0.7952 | 0.2564 | |||
| HCA / HCA Healthcare, Inc. | 0.01 | -0.36 | 2.46 | 10.48 | 0.7937 | 0.0098 | |||
| EW / Edwards Lifesciences Corporation | 0.03 | 0.74 | 2.40 | 8.68 | 0.7766 | -0.0029 | |||
| APD / Air Products and Chemicals, Inc. | 0.01 | 2.22 | 2.35 | -2.24 | 0.7603 | -0.0883 | |||
| APH / Amphenol Corporation | 0.02 | -1.38 | 2.34 | 48.54 | 0.7556 | 0.2003 | |||
| ICE / Intercontinental Exchange, Inc. | 0.01 | 0.28 | 2.34 | 6.67 | 0.7549 | -0.0174 | |||
| BKR / Baker Hughes Company | 0.06 | 2.49 | 2.33 | -10.60 | 0.7526 | -0.1658 | |||
| ZTS / Zoetis Inc. | 0.01 | 65.25 | 2.31 | 56.46 | 0.7480 | 0.2266 | |||
| PPG / PPG Industries, Inc. | 0.02 | 1.34 | 2.25 | 5.38 | 0.7277 | -0.0255 | |||
| PLD / Prologis, Inc. | 0.02 | 2.82 | 2.09 | -3.33 | 0.6765 | -0.0869 | |||
| PFE / Pfizer Inc. | 0.08 | 3.55 | 2.03 | -0.98 | 0.6552 | -0.0665 | |||
| DE / Deere & Company | 0.00 | 0.03 | 1.92 | 8.35 | 0.6210 | -0.0043 | |||
| AMT / American Tower Corporation | 0.01 | 0.96 | 1.80 | 2.57 | 0.5811 | -0.0372 | |||
| DG / Dollar General Corporation | 0.02 | -2.34 | 1.75 | 27.02 | 0.5655 | 0.0798 | |||
| AEP / American Electric Power Company, Inc. | 0.02 | 1.40 | 1.60 | -3.74 | 0.5159 | -0.0687 | |||
| NYT / The New York Times Company | 0.03 | 106.47 | 1.59 | 133.09 | 0.5125 | 0.2725 | |||
| MCD / McDonald's Corporation | 0.01 | -36.74 | 1.49 | -40.84 | 0.4803 | -0.4054 | |||
| TSCO / Tractor Supply Company | 0.03 | 2.37 | 1.48 | -1.92 | 0.4777 | -0.0539 | |||
| QCOM / QUALCOMM Incorporated | 0.01 | 4.67 | 1.41 | 8.55 | 0.4553 | -0.0025 | |||
| LLY / Eli Lilly and Company | 0.00 | 0.00 | 1.39 | -5.62 | 0.4506 | -0.0703 | |||
| CDW / CDW Corporation | 0.01 | 4.80 | 1.34 | 16.83 | 0.4330 | 0.0285 | |||
| OC / Owens Corning | 0.01 | 4.12 | 1.23 | 0.25 | 0.3963 | -0.0350 | |||
| MPC / Marathon Petroleum Corporation | 0.00 | 0.04 | 0.75 | 14.00 | 0.2423 | 0.0105 | |||
| V / Visa Inc. | 0.00 | 0.00 | 0.71 | 1.29 | 0.2284 | -0.0176 | |||
| HSY / The Hershey Company | 0.00 | 2.38 | 0.68 | -0.59 | 0.2195 | -0.0216 | |||
| TSLA / Tesla, Inc. | 0.00 | -0.05 | 0.67 | 22.53 | 0.2164 | 0.0237 | |||
| JEPI / J.P. Morgan Exchange-Traded Fund Trust - JPMorgan Equity Premium Income ETF | 0.01 | 10.20 | 0.63 | 9.62 | 0.2028 | 0.0010 | |||
| GJR / Strats Trust For Procter & Gambel Security - Preferred Security | 0.00 | -23.71 | 0.60 | -28.67 | 0.1946 | -0.1031 | |||
| ABBV / AbbVie Inc. | 0.00 | 0.07 | 0.54 | -11.28 | 0.1730 | -0.0399 | |||
| HDV / iShares Trust - iShares Core High Dividend ETF | 0.00 | 4.06 | 0.46 | 0.65 | 0.1503 | -0.0126 | |||
| DVY / iShares Trust - iShares Select Dividend ETF | 0.00 | 5.28 | 0.46 | 4.04 | 0.1497 | -0.0072 | |||
| JKHY / Jack Henry & Associates, Inc. | 0.00 | 0.00 | 0.45 | -1.32 | 0.1454 | -0.0154 | |||
| MMM / 3M Company | 0.00 | 0.00 | 0.27 | 3.79 | 0.0885 | -0.0047 | |||
| ILMN / Illumina, Inc. | 0.00 | -100.00 | 0.00 | 0.0000 | |||||
| MKTX / MarketAxess Holdings Inc. | 0.00 | -100.00 | 0.00 | 0.0000 |