Mga Batayang Estadistika
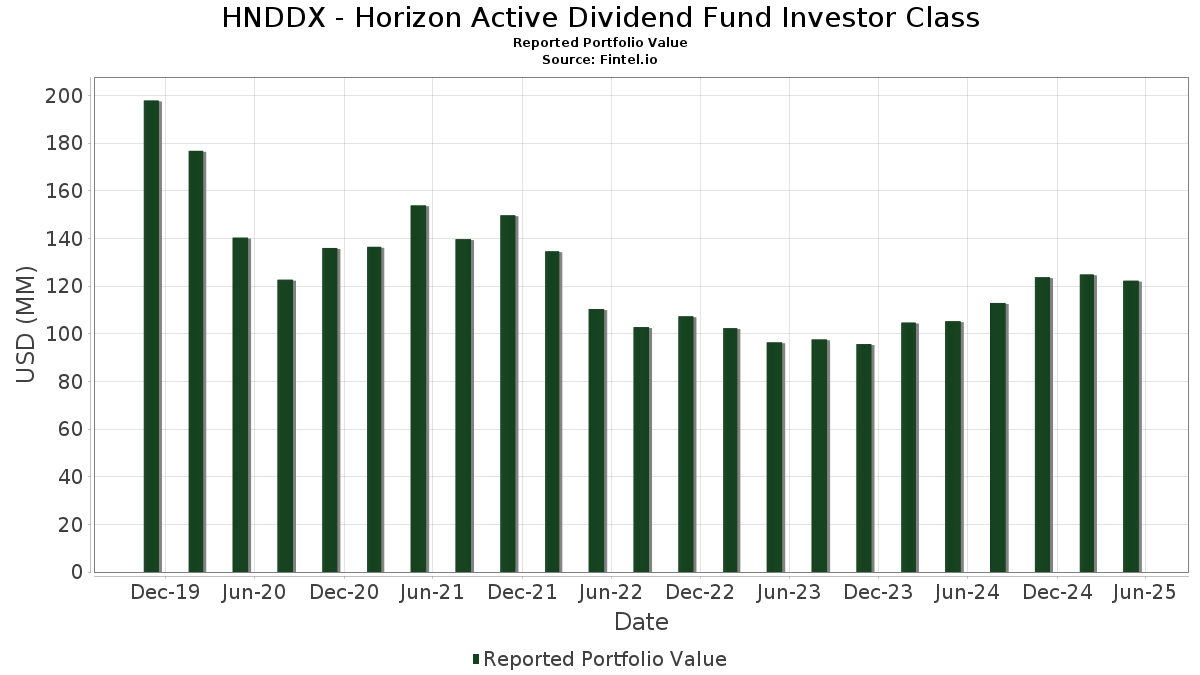
| Nilai Portofolio | $ 122,232,175 |
| Posisi Saat Ini | 202 |
Kepemilikan Terbaru, Kinerja, AUM (dari 13F, 13D)
HNDDX - Horizon Active Dividend Fund Investor Class telah mengungkapkan total kepemilikan 202 dalam pengajuan SEC terbaru mereka. Nilai portofolio terbaru dihitung sebesar $ 122,232,175 USD. Aset yang Dikelola (AUM) sebenarnya adalah nilai ini ditambah kas (yang tidak diungkapkan). Aset-aset utama HNDDX - Horizon Active Dividend Fund Investor Class adalah Microsoft Corporation (US:MSFT) , Apple Inc. (US:AAPL) , NVIDIA Corporation (US:NVDA) , Alphabet Inc. (US:GOOGL) , and Broadcom Inc. (US:AVGO) .
Peningkatan Tertinggi Kuartal Ini
Kami menggunakan perubahan dalam alokasi portofolio karena ini adalah metrik yang paling bermakna. Perubahan dapat disebabkan oleh perdagangan atau perubahan harga saham.
| Keamanan | Saham (MM) |
Nilai (Juta Dolar AS) |
Portfolio % | ΔPorsyento ng Portfolio |
|---|---|---|---|---|
| 0.02 | 7.60 | 6.1910 | 0.9155 | |
| 0.02 | 3.72 | 3.0268 | 0.5629 | |
| 0.04 | 5.50 | 4.4760 | 0.3875 | |
| 0.00 | 1.18 | 0.9623 | 0.1889 | |
| 0.01 | 1.21 | 0.9885 | 0.1487 | |
| 0.00 | 1.04 | 0.8454 | 0.1388 | |
| 0.01 | 0.50 | 0.4108 | 0.1102 | |
| 0.00 | 0.64 | 0.5233 | 0.1019 | |
| 0.18 | 0.18 | 0.1431 | 0.0920 | |
| 0.00 | 0.59 | 0.4809 | 0.0808 |
Penurunan Tertinggi Kuartal Ini
Kami menggunakan perubahan dalam alokasi portofolio karena ini adalah metrik yang paling bermakna. Perubahan dapat disebabkan oleh perdagangan atau perubahan harga saham.
| Keamanan | Saham (MM) |
Nilai (Juta Dolar AS) |
Portfolio % | ΔPorsyento ng Portfolio |
|---|---|---|---|---|
| 0.03 | 5.59 | 4.5503 | -0.8633 | |
| 0.00 | 0.92 | 0.7468 | -0.4146 | |
| 0.00 | 1.27 | 1.0337 | -0.2413 | |
| 0.01 | 0.57 | 0.4640 | -0.1685 | |
| 0.01 | 1.66 | 1.3495 | -0.1480 | |
| 0.01 | 0.81 | 0.6605 | -0.1231 | |
| 0.01 | 1.00 | 0.8143 | -0.1195 | |
| 0.02 | 1.91 | 1.5544 | -0.1170 | |
| 0.01 | 0.45 | 0.3649 | -0.1078 | |
| 0.01 | 1.25 | 1.0170 | -0.1020 |
Pengajuan 13F dan Dana
Formulir ini diajukan pada 2025-07-23 untuk periode pelaporan 2025-05-31. Klik ikon tautan untuk melihat riwayat transaksi selengkapnya.
Tingkatkan ke versi premium untuk membuka data premium dan ekspor ke Excel. ![]() .
.
| Keamanan | Ketik | Harga Saham Rata-rata | Saham (MM) |
ΔSaham (%) |
ΔSaham (%) |
Nilai ($MM) |
Portpolyo (%) |
ΔPortofolio (%) |
|
|---|---|---|---|---|---|---|---|---|---|
| MSFT / Microsoft Corporation | 0.02 | -0.67 | 7.60 | 15.18 | 6.1910 | 0.9155 | |||
| AAPL / Apple Inc. | 0.03 | -0.67 | 5.59 | -17.51 | 4.5503 | -0.8633 | |||
| NVDA / NVIDIA Corporation | 0.04 | -0.67 | 5.50 | 7.45 | 4.4760 | 0.3875 | |||
| GOOGL / Alphabet Inc. | 0.02 | -0.67 | 4.00 | 0.20 | 3.2529 | 0.0660 | |||
| AVGO / Broadcom Inc. | 0.02 | -0.67 | 3.72 | 20.56 | 3.0268 | 0.5629 | |||
| AMZN / Amazon.com, Inc. | 0.02 | -0.66 | 3.40 | -4.06 | 2.7694 | -0.0639 | |||
| META / Meta Platforms, Inc. | 0.00 | -0.68 | 3.24 | -3.75 | 2.6349 | -0.0521 | |||
| JPM / JPMorgan Chase & Co. | 0.01 | -0.67 | 2.99 | -0.90 | 2.4322 | 0.0231 | |||
| WMT / Walmart Inc. | 0.02 | -0.67 | 2.06 | -0.58 | 1.6744 | 0.0217 | |||
| XOM / Exxon Mobil Corporation | 0.02 | -0.67 | 1.91 | -8.70 | 1.5544 | -0.1170 | |||
| JNJ / Johnson & Johnson | 0.01 | -0.66 | 1.82 | -6.59 | 1.4783 | -0.0746 | |||
| HD / The Home Depot, Inc. | 0.00 | -0.68 | 1.66 | -7.76 | 1.3551 | -0.0870 | |||
| ABBV / AbbVie Inc. | 0.01 | -0.66 | 1.66 | -11.53 | 1.3495 | -0.1480 | |||
| V / Visa Inc. | 0.00 | -0.73 | 1.64 | -0.06 | 1.3350 | 0.0241 | |||
| BRK.B / Berkshire Hathaway Inc. | 0.00 | -0.68 | 1.63 | -2.57 | 1.3249 | -0.0100 | |||
| CSCO / Cisco Systems, Inc. | 0.02 | -0.67 | 1.54 | -2.28 | 1.2572 | -0.0061 | |||
| ORCL / Oracle Corporation | 0.01 | -0.66 | 1.51 | -0.98 | 1.2321 | 0.0108 | |||
| IBM / International Business Machines Corporation | 0.01 | -0.67 | 1.50 | 1.97 | 1.2215 | 0.0454 | |||
| PG / The Procter & Gamble Company | 0.01 | -0.68 | 1.49 | -2.99 | 1.2163 | -0.0136 | |||
| BAC / Bank of America Corporation | 0.03 | -0.67 | 1.37 | -4.91 | 1.1190 | -0.0360 | |||
| VZ / Verizon Communications Inc. | 0.03 | -0.67 | 1.31 | 1.32 | 1.0648 | 0.0333 | |||
| LLY / Eli Lilly and Company | 0.00 | -0.69 | 1.27 | -20.44 | 1.0337 | -0.2413 | |||
| TMUS / T-Mobile US, Inc. | 0.01 | -0.67 | 1.25 | -10.79 | 1.0170 | -0.1020 | |||
| KO / The Coca-Cola Company | 0.02 | -0.67 | 1.23 | 0.57 | 0.9985 | 0.0240 | |||
| PM / Philip Morris International Inc. | 0.01 | -0.66 | 1.21 | 15.62 | 0.9885 | 0.1487 | |||
| NFLX / Netflix, Inc. | 0.00 | -0.81 | 1.18 | 22.13 | 0.9623 | 0.1889 | |||
| MCD / McDonald's Corporation | 0.00 | -0.69 | 1.14 | 1.16 | 0.9258 | 0.0270 | |||
| WFC / Wells Fargo & Company | 0.01 | -0.68 | 1.10 | -5.19 | 0.8928 | -0.0312 | |||
| TSLA / Tesla, Inc. | 0.00 | -0.70 | 1.04 | 17.42 | 0.8454 | 0.1388 | |||
| MA / Mastercard Incorporated | 0.00 | -0.76 | 1.00 | 0.91 | 0.8144 | 0.0218 | |||
| CVX / Chevron Corporation | 0.01 | -0.69 | 1.00 | -14.38 | 0.8143 | -0.1195 | |||
| MS / Morgan Stanley | 0.01 | -0.69 | 0.96 | -4.49 | 0.7798 | -0.0215 | |||
| UNH / UnitedHealth Group Incorporated | 0.00 | -0.72 | 0.92 | -36.89 | 0.7468 | -0.4146 | |||
| TXN / Texas Instruments Incorporated | 0.01 | -0.67 | 0.92 | -7.29 | 0.7462 | -0.0441 | |||
| ACN / Accenture plc | 0.00 | -0.66 | 0.86 | -9.73 | 0.7032 | -0.0610 | |||
| CMCSA / Comcast Corporation | 0.02 | -0.67 | 0.85 | -4.29 | 0.6900 | -0.0176 | |||
| MRK / Merck & Co., Inc. | 0.01 | -0.68 | 0.81 | -17.24 | 0.6605 | -0.1231 | |||
| RTX / RTX Corporation | 0.01 | -0.69 | 0.76 | 1.87 | 0.6208 | 0.0229 | |||
| GS / The Goldman Sachs Group, Inc. | 0.00 | -0.79 | 0.75 | -4.33 | 0.6131 | -0.0155 | |||
| CRM / Salesforce, Inc. | 0.00 | -0.67 | 0.75 | -11.44 | 0.6117 | -0.0667 | |||
| PEP / PepsiCo, Inc. | 0.01 | -0.68 | 0.71 | -15.02 | 0.5813 | -0.0893 | |||
| GILD / Gilead Sciences, Inc. | 0.01 | -0.67 | 0.70 | -4.36 | 0.5722 | -0.0149 | |||
| QCOM / QUALCOMM Incorporated | 0.00 | -0.68 | 0.70 | -8.25 | 0.5714 | -0.0398 | |||
| DIS / The Walt Disney Company | 0.01 | -0.70 | 0.69 | -1.28 | 0.5637 | 0.0028 | |||
| AMGN / Amgen Inc. | 0.00 | -0.72 | 0.68 | -7.15 | 0.5500 | -0.0312 | |||
| LIN / Linde plc | 0.00 | -0.77 | 0.67 | -0.60 | 0.5425 | 0.0065 | |||
| NEE / NextEra Energy, Inc. | 0.01 | -0.69 | 0.66 | 0.00 | 0.5382 | 0.0098 | |||
| C / Citigroup Inc. | 0.01 | -0.67 | 0.66 | -6.42 | 0.5348 | -0.0261 | |||
| INTU / Intuit Inc. | 0.00 | -0.70 | 0.64 | 21.82 | 0.5233 | 0.1019 | |||
| COST / Costco Wholesale Corporation | 0.00 | -0.65 | 0.64 | -1.54 | 0.5209 | 0.0021 | |||
| GE / General Electric Company | 0.00 | -0.70 | 0.59 | 18.00 | 0.4809 | 0.0808 | |||
| BKNG / Booking Holdings Inc. | 0.00 | -0.94 | 0.58 | 9.04 | 0.4718 | 0.0469 | |||
| SBUX / Starbucks Corporation | 0.01 | -0.67 | 0.57 | -28.07 | 0.4640 | -0.1685 | |||
| TJX / The TJX Companies, Inc. | 0.00 | -0.71 | 0.57 | 1.07 | 0.4637 | 0.0131 | |||
| BLK / BlackRock, Inc. | 0.00 | -0.68 | 0.57 | -0.53 | 0.4627 | 0.0064 | |||
| LOW / Lowe's Companies, Inc. | 0.00 | -0.68 | 0.56 | -9.79 | 0.4578 | -0.0405 | |||
| HON / Honeywell International Inc. | 0.00 | -0.73 | 0.55 | 5.75 | 0.4498 | 0.0321 | |||
| AXP / American Express Company | 0.00 | -0.69 | 0.55 | -3.00 | 0.4479 | -0.0052 | |||
| BMY / Bristol-Myers Squibb Company | 0.01 | -0.66 | 0.55 | -19.50 | 0.4441 | -0.0977 | |||
| NOW / ServiceNow, Inc. | 0.00 | -0.92 | 0.54 | 7.72 | 0.4437 | 0.0395 | |||
| ADI / Analog Devices, Inc. | 0.00 | -0.70 | 0.54 | -7.67 | 0.4418 | -0.0277 | |||
| CAT / Caterpillar Inc. | 0.00 | -0.72 | 0.53 | 0.38 | 0.4296 | 0.0099 | |||
| UNP / Union Pacific Corporation | 0.00 | -0.71 | 0.53 | -10.68 | 0.4292 | -0.0430 | |||
| MDT / Medtronic plc | 0.01 | -0.69 | 0.52 | -10.48 | 0.4249 | -0.0408 | |||
| ADP / Automatic Data Processing, Inc. | 0.00 | -0.68 | 0.52 | 2.57 | 0.4228 | 0.0182 | |||
| CME / CME Group Inc. | 0.00 | -0.73 | 0.51 | 13.02 | 0.4177 | 0.0551 | |||
| APH / Amphenol Corporation | 0.01 | -0.66 | 0.50 | 34.04 | 0.4108 | 0.1102 | |||
| LMT / Lockheed Martin Corporation | 0.00 | -0.76 | 0.50 | 6.34 | 0.4100 | 0.0314 | |||
| SO / The Southern Company | 0.01 | -0.66 | 0.47 | -0.42 | 0.3859 | 0.0055 | |||
| SCHW / The Charles Schwab Corporation | 0.01 | -0.70 | 0.45 | 10.29 | 0.3665 | 0.0404 | |||
| NKE / NIKE, Inc. | 0.01 | -0.68 | 0.45 | -24.20 | 0.3649 | -0.1078 | |||
| DE / Deere & Company | 0.00 | -0.79 | 0.45 | 4.68 | 0.3640 | 0.0220 | |||
| DUK / Duke Energy Corporation | 0.00 | -0.71 | 0.44 | -0.45 | 0.3612 | 0.0048 | |||
| ADBE / Adobe Inc. | 0.00 | -0.76 | 0.43 | -6.06 | 0.3539 | -0.0159 | |||
| UPS / United Parcel Service, Inc. | 0.00 | -0.68 | 0.43 | -18.58 | 0.3463 | -0.0713 | |||
| CVS / CVS Health Corporation | 0.01 | -0.68 | 0.42 | -3.24 | 0.3407 | -0.0048 | |||
| MSI / Motorola Solutions, Inc. | 0.00 | -0.79 | 0.42 | -6.29 | 0.3399 | -0.0165 | |||
| GLW / Corning Incorporated | 0.01 | -0.68 | 0.42 | -1.66 | 0.3380 | 0.0002 | |||
| KLAC / KLA Corporation | 0.00 | -0.91 | 0.41 | 5.90 | 0.3365 | 0.0244 | |||
| AMAT / Applied Materials, Inc. | 0.00 | -0.72 | 0.41 | -1.43 | 0.3364 | 0.0010 | |||
| LRCX / Lam Research Corporation | 0.00 | -0.68 | 0.40 | 4.68 | 0.3284 | 0.0202 | |||
| PANW / Palo Alto Networks, Inc. | 0.00 | -0.73 | 0.39 | 0.26 | 0.3185 | 0.0068 | |||
| TE Connectivity PLC / EC (IE000IVNQZ81) | 0.00 | -0.69 | 0.39 | 3.17 | 0.3181 | 0.0156 | |||
| ANET / Arista Networks Inc | 0.00 | -0.69 | 0.37 | -7.67 | 0.3042 | -0.0187 | |||
| SYK / Stryker Corporation | 0.00 | -0.82 | 0.37 | -1.59 | 0.3022 | 0.0004 | |||
| BX / Blackstone Inc. | 0.00 | -0.71 | 0.37 | -14.62 | 0.3004 | -0.0445 | |||
| ETN / Eaton Corporation plc | 0.00 | -0.73 | 0.35 | 8.39 | 0.2847 | 0.0269 | |||
| MMM / 3M Company | 0.00 | -0.68 | 0.35 | -4.96 | 0.2812 | -0.0094 | |||
| ROP / Roper Technologies, Inc. | 0.00 | -0.83 | 0.34 | -3.39 | 0.2791 | -0.0040 | |||
| MO / Altria Group, Inc. | 0.01 | -0.66 | 0.34 | 7.62 | 0.2767 | 0.0248 | |||
| MU / Micron Technology, Inc. | 0.00 | -0.70 | 0.34 | 0.00 | 0.2734 | 0.0055 | |||
| CB / Chubb Limited | 0.00 | -0.62 | 0.33 | 3.44 | 0.2696 | 0.0138 | |||
| MAR / Marriott International, Inc. | 0.00 | -0.81 | 0.32 | -6.63 | 0.2640 | -0.0137 | |||
| USB / U.S. Bancorp | 0.01 | -0.69 | 0.32 | -7.47 | 0.2622 | -0.0166 | |||
| PNC / The PNC Financial Services Group, Inc. | 0.00 | -0.77 | 0.31 | -10.12 | 0.2537 | -0.0234 | |||
| MMC / Marsh & McLennan Companies, Inc. | 0.00 | -0.75 | 0.31 | -2.52 | 0.2523 | -0.0017 | |||
| SPGI / S&P Global Inc. | 0.00 | -0.82 | 0.31 | -4.92 | 0.2522 | -0.0075 | |||
| CI / The Cigna Group | 0.00 | -0.82 | 0.31 | 1.66 | 0.2506 | 0.0087 | |||
| F / Ford Motor Company | 0.03 | -0.67 | 0.30 | 8.03 | 0.2411 | 0.0219 | |||
| AMD / Advanced Micro Devices, Inc. | 0.00 | -0.72 | 0.29 | 10.27 | 0.2361 | 0.0256 | |||
| ISRG / Intuitive Surgical, Inc. | 0.00 | -0.94 | 0.29 | -4.62 | 0.2361 | -0.0066 | |||
| WM / Waste Management, Inc. | 0.00 | -0.75 | 0.29 | 2.89 | 0.2325 | 0.0104 | |||
| HPE / Hewlett Packard Enterprise Company | 0.02 | -0.67 | 0.28 | -13.50 | 0.2300 | -0.0305 | |||
| ITW / Illinois Tool Works Inc. | 0.00 | -0.70 | 0.28 | -7.69 | 0.2251 | -0.0146 | |||
| UBER / Uber Technologies, Inc. | 0.00 | -0.70 | 0.27 | 10.04 | 0.2232 | 0.0239 | |||
| YUM / Yum! Brands, Inc. | 0.00 | -0.74 | 0.27 | -8.78 | 0.2204 | -0.0164 | |||
| GD / General Dynamics Corporation | 0.00 | -0.82 | 0.27 | 9.31 | 0.2202 | 0.0226 | |||
| AEP / American Electric Power Company, Inc. | 0.00 | -0.69 | 0.27 | -3.27 | 0.2171 | -0.0028 | |||
| GRMN / Garmin Ltd. | 0.00 | -0.77 | 0.26 | -12.04 | 0.2143 | -0.0248 | |||
| APD / Air Products and Chemicals, Inc. | 0.00 | -0.74 | 0.26 | -12.42 | 0.2126 | -0.0257 | |||
| PAYX / Paychex, Inc. | 0.00 | -0.79 | 0.26 | 3.19 | 0.2111 | 0.0105 | |||
| HPQ / HP Inc. | 0.01 | -0.67 | 0.26 | -20.12 | 0.2108 | -0.0474 | |||
| ELV / Elevance Health, Inc. | 0.00 | -0.74 | 0.26 | -4.10 | 0.2097 | -0.0047 | |||
| GM / General Motors Company | 0.01 | -0.68 | 0.26 | 0.39 | 0.2079 | 0.0045 | |||
| TMO / Thermo Fisher Scientific Inc. | 0.00 | -0.63 | 0.26 | -24.33 | 0.2079 | -0.0617 | |||
| ICE / Intercontinental Exchange, Inc. | 0.00 | -0.77 | 0.25 | 3.25 | 0.2069 | 0.0097 | |||
| PCAR / PACCAR Inc | 0.00 | -0.71 | 0.25 | -13.19 | 0.2043 | -0.0265 | |||
| JCI / Johnson Controls International plc | 0.00 | -0.73 | 0.25 | 17.45 | 0.2033 | 0.0335 | |||
| TFC / Truist Financial Corporation | 0.01 | -0.69 | 0.25 | -15.17 | 0.2004 | -0.0320 | |||
| TT / Trane Technologies plc | 0.00 | -0.69 | 0.25 | 21.18 | 0.2004 | 0.0376 | |||
| NOC / Northrop Grumman Corporation | 0.00 | -0.78 | 0.25 | 4.26 | 0.1997 | 0.0115 | |||
| D / Dominion Energy, Inc. | 0.00 | -0.69 | 0.24 | -0.81 | 0.1991 | 0.0025 | |||
| ROST / Ross Stores, Inc. | 0.00 | -0.73 | 0.23 | -0.87 | 0.1863 | 0.0018 | |||
| EMR / Emerson Electric Co. | 0.00 | -0.68 | 0.23 | -2.58 | 0.1851 | -0.0012 | |||
| COP / ConocoPhillips | 0.00 | -0.71 | 0.23 | -14.34 | 0.1848 | -0.0274 | |||
| PH / Parker-Hannifin Corporation | 0.00 | -0.87 | 0.23 | -1.31 | 0.1845 | 0.0008 | |||
| BK / The Bank of New York Mellon Corporation | 0.00 | -0.71 | 0.22 | -1.34 | 0.1804 | 0.0014 | |||
| HCA / HCA Healthcare, Inc. | 0.00 | -0.68 | 0.22 | 24.16 | 0.1801 | 0.0372 | |||
| EXC / Exelon Corporation | 0.01 | -0.68 | 0.22 | -1.35 | 0.1784 | 0.0006 | |||
| NEM / Newmont Corporation | 0.00 | -0.70 | 0.22 | 22.47 | 0.1777 | 0.0350 | |||
| SRE / Sempra | 0.00 | -0.69 | 0.21 | 9.18 | 0.1748 | 0.0175 | |||
| ABNB / Airbnb, Inc. | 0.00 | -0.72 | 0.21 | -7.76 | 0.1742 | -0.0112 | |||
| PGR / The Progressive Corporation | 0.00 | -0.53 | 0.21 | 0.47 | 0.1742 | 0.0041 | |||
| LVS / Las Vegas Sands Corp. | 0.01 | -0.69 | 0.21 | -8.58 | 0.1741 | -0.0128 | |||
| MET / MetLife, Inc. | 0.00 | -0.67 | 0.21 | -9.52 | 0.1704 | -0.0143 | |||
| SHW / The Sherwin-Williams Company | 0.00 | -0.69 | 0.21 | -1.90 | 0.1692 | 0.0004 | |||
| RSG / Republic Services, Inc. | 0.00 | -0.74 | 0.21 | 7.81 | 0.1691 | 0.0151 | |||
| MDLZ / Mondelez International, Inc. | 0.00 | -0.68 | 0.21 | 4.57 | 0.1680 | 0.0100 | |||
| BSX / Boston Scientific Corporation | 0.00 | -0.72 | 0.20 | 0.50 | 0.1649 | 0.0042 | |||
| ZTS / Zoetis Inc. | 0.00 | -0.76 | 0.20 | 0.00 | 0.1604 | 0.0031 | |||
| ABT / Abbott Laboratories | 0.00 | -0.68 | 0.20 | -3.94 | 0.1591 | -0.0033 | |||
| CTAS / Cintas Corporation | 0.00 | -0.82 | 0.19 | 7.95 | 0.1555 | 0.0145 | |||
| ECL / Ecolab Inc. | 0.00 | -0.84 | 0.19 | -2.09 | 0.1529 | -0.0004 | |||
| COF / Capital One Financial Corporation | 0.00 | -0.71 | 0.18 | -6.12 | 0.1500 | -0.0072 | |||
| XEL / Xcel Energy Inc. | 0.00 | -0.72 | 0.18 | -3.68 | 0.1494 | -0.0025 | |||
| FDX / FedEx Corporation | 0.00 | -0.83 | 0.18 | -17.65 | 0.1485 | -0.0287 | |||
| CSX / CSX Corporation | 0.01 | -0.69 | 0.18 | -2.16 | 0.1478 | -0.0002 | |||
| CEG / Constellation Energy Corporation | 0.00 | -0.84 | 0.18 | 20.81 | 0.1471 | 0.0279 | |||
| AFL / Aflac Incorporated | 0.00 | -0.69 | 0.18 | -5.76 | 0.1466 | -0.0066 | |||
| FXFXX / First American Funds Inc - First American Treasury Obligations Fund Class X | 0.18 | 174.80 | 0.18 | 177.78 | 0.1431 | 0.0920 | |||
| PEG / Public Service Enterprise Group Incorporated | 0.00 | -0.78 | 0.18 | -0.57 | 0.1426 | 0.0013 | |||
| CARR / Carrier Global Corporation | 0.00 | -0.74 | 0.17 | 8.86 | 0.1408 | 0.0141 | |||
| DHI / D.R. Horton, Inc. | 0.00 | -0.83 | 0.17 | -7.65 | 0.1382 | -0.0087 | |||
| LHX / L3Harris Technologies, Inc. | 0.00 | -0.86 | 0.17 | 17.48 | 0.1375 | 0.0227 | |||
| TRV / The Travelers Companies, Inc. | 0.00 | -0.83 | 0.17 | 5.77 | 0.1347 | 0.0097 | |||
| AIG / American International Group, Inc. | 0.00 | -0.66 | 0.16 | 1.23 | 0.1340 | 0.0043 | |||
| WMB / The Williams Companies, Inc. | 0.00 | -0.70 | 0.16 | 3.16 | 0.1332 | 0.0066 | |||
| ALL / The Allstate Corporation | 0.00 | -0.64 | 0.16 | 5.19 | 0.1321 | 0.0083 | |||
| KKR / KKR & Co. Inc. | 0.00 | -0.75 | 0.16 | -11.60 | 0.1310 | -0.0136 | |||
| ED / Consolidated Edison, Inc. | 0.00 | -0.71 | 0.16 | 1.92 | 0.1302 | 0.0051 | |||
| BDX / Becton, Dickinson and Company | 0.00 | -0.76 | 0.16 | -24.15 | 0.1283 | -0.0375 | |||
| MCK / McKesson Corporation | 0.00 | -0.90 | 0.16 | 11.35 | 0.1283 | 0.0152 | |||
| WEC / WEC Energy Group, Inc. | 0.00 | -0.75 | 0.16 | 0.00 | 0.1273 | 0.0023 | |||
| PRU / Prudential Financial, Inc. | 0.00 | -0.67 | 0.16 | -9.88 | 0.1262 | -0.0119 | |||
| LEN / Lennar Corporation | 0.00 | -0.75 | 0.15 | -12.07 | 0.1252 | -0.0144 | |||
| KR / The Kroger Co. | 0.00 | -0.67 | 0.15 | 4.86 | 0.1232 | 0.0075 | |||
| FCX / Freeport-McMoRan Inc. | 0.00 | -0.69 | 0.15 | 3.45 | 0.1224 | 0.0064 | |||
| MCO / Moody's Corporation | 0.00 | -0.63 | 0.15 | -5.06 | 0.1222 | -0.0047 | |||
| AJG / Arthur J. Gallagher & Co. | 0.00 | -0.94 | 0.15 | 1.39 | 0.1197 | 0.0044 | |||
| AON / Aon plc | 0.00 | -0.51 | 0.14 | -9.43 | 0.1175 | -0.0100 | |||
| VRTX / Vertex Pharmaceuticals Incorporated | 0.00 | -0.32 | 0.14 | -8.11 | 0.1109 | -0.0076 | |||
| AMP / Ameriprise Financial, Inc. | 0.00 | -0.77 | 0.13 | -5.76 | 0.1070 | -0.0047 | |||
| OTIS / Otis Worldwide Corporation | 0.00 | -0.78 | 0.12 | -4.72 | 0.0986 | -0.0035 | |||
| KDP / Keurig Dr Pepper Inc. | 0.00 | -0.69 | 0.12 | 0.00 | 0.0980 | 0.0016 | |||
| KMB / Kimberly-Clark Corporation | 0.00 | -0.85 | 0.12 | 0.00 | 0.0956 | 0.0021 | |||
| SYY / Sysco Corporation | 0.00 | -0.74 | 0.12 | -4.10 | 0.0955 | -0.0022 | |||
| URI / United Rentals, Inc. | 0.00 | -1.20 | 0.12 | 9.43 | 0.0946 | 0.0094 | |||
| MPC / Marathon Petroleum Corporation | 0.00 | -0.86 | 0.11 | 5.77 | 0.0903 | 0.0068 | |||
| CL / Colgate-Palmolive Company | 0.00 | -0.75 | 0.11 | 1.85 | 0.0897 | 0.0027 | |||
| OKE / ONEOK, Inc. | 0.00 | -0.73 | 0.11 | -20.44 | 0.0892 | -0.0203 | |||
| DHR / Danaher Corporation | 0.00 | -0.70 | 0.11 | -9.32 | 0.0877 | -0.0071 | |||
| VLO / Valero Energy Corporation | 0.00 | -0.63 | 0.10 | -1.94 | 0.0824 | -0.0001 | |||
| GIS / General Mills, Inc. | 0.00 | -0.70 | 0.10 | -10.71 | 0.0816 | -0.0085 | |||
| HSY / The Hershey Company | 0.00 | -0.81 | 0.10 | -8.41 | 0.0806 | -0.0051 | |||
| PPG / PPG Industries, Inc. | 0.00 | -0.79 | 0.10 | -3.00 | 0.0794 | -0.0009 | |||
| EIX / Edison International | 0.00 | -0.69 | 0.10 | 1.05 | 0.0786 | 0.0026 | |||
| KHC / The Kraft Heinz Company | 0.00 | -0.69 | 0.10 | -13.51 | 0.0783 | -0.0106 | |||
| LYB / LyondellBasell Industries N.V. | 0.00 | -0.76 | 0.10 | -26.72 | 0.0782 | -0.0270 | |||
| EOG / EOG Resources, Inc. | 0.00 | -0.79 | 0.10 | -15.93 | 0.0781 | -0.0122 | |||
| DD / DuPont de Nemours, Inc. | 0.00 | -0.83 | 0.10 | -19.49 | 0.0780 | -0.0165 | |||
| PFE / Pfizer Inc. | 0.00 | -0.67 | 0.09 | -11.32 | 0.0768 | -0.0086 | |||
| PSX / Phillips 66 | 0.00 | -0.84 | 0.09 | -12.96 | 0.0768 | -0.0101 | |||
| ADM / Archer-Daniels-Midland Company | 0.00 | -0.76 | 0.09 | 2.33 | 0.0717 | 0.0024 | |||
| STZ / Constellation Brands, Inc. | 0.00 | -0.87 | 0.08 | 1.25 | 0.0663 | 0.0017 | |||
| SLB / Schlumberger Limited | 0.00 | -0.69 | 0.08 | -21.57 | 0.0657 | -0.0161 | |||
| TGT / Target Corporation | 0.00 | -0.83 | 0.08 | -25.00 | 0.0641 | -0.0198 | |||
| OXY / Occidental Petroleum Corporation | 0.00 | -0.74 | 0.08 | -17.39 | 0.0624 | -0.0115 | |||
| NUE / Nucor Corporation | 0.00 | -0.85 | 0.08 | -20.83 | 0.0622 | -0.0152 | |||
| HUM / Humana Inc. | 0.00 | -0.33 | 0.07 | -14.81 | 0.0569 | -0.0081 | |||
| REGN / Regeneron Pharmaceuticals, Inc. | 0.00 | -0.86 | 0.06 | -30.86 | 0.0459 | -0.0189 | |||
| MRP / Millrose Properties, Inc. | 0.00 | -0.68 | 0.02 | 25.00 | 0.0166 | 0.0031 | |||
| SPXW US 06/05/25 C6000 / DE (N/A) | -0.12 | -0.0952 | -0.0952 |