Mga Batayang Estadistika
| Nilai Portofolio | $ 50,886,228 |
| Posisi Saat Ini | 88 |
Kepemilikan Terbaru, Kinerja, AUM (dari 13F, 13D)
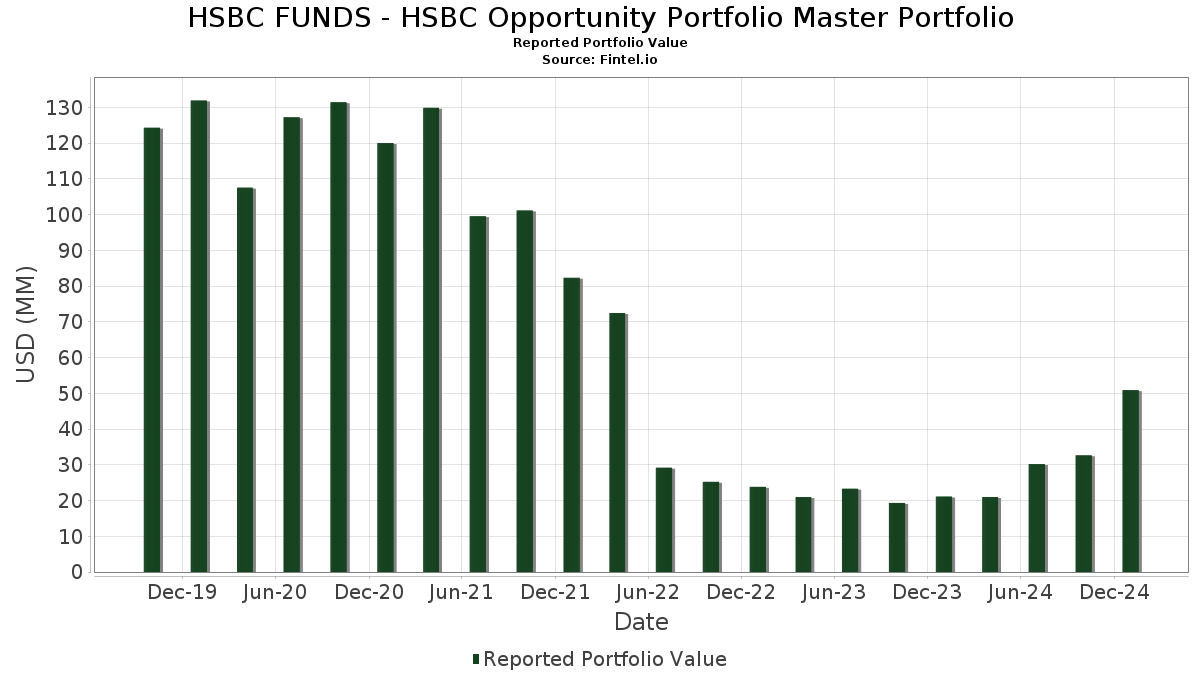
HSBC FUNDS - HSBC Opportunity Portfolio Master Portfolio telah mengungkapkan total kepemilikan 88 dalam pengajuan SEC terbaru mereka. Nilai portofolio terbaru dihitung sebesar $ 50,886,228 USD. Aset yang Dikelola (AUM) sebenarnya adalah nilai ini ditambah kas (yang tidak diungkapkan). Aset-aset utama HSBC FUNDS - HSBC Opportunity Portfolio Master Portfolio adalah DocuSign, Inc. (US:DOCU) , F5, Inc. (US:FFIV) , Nextracker Inc. (US:NXT) , Jabil Inc. (US:JBL) , and Guidewire Software, Inc. (US:GWRE) . Posisi baru HSBC FUNDS - HSBC Opportunity Portfolio Master Portfolio meliputi: Procore Technologies, Inc. (US:PCOR) , Newell Brands Inc. (US:NWL) , MasterBrand, Inc. (US:MBC) , Texas Capital Bancshares, Inc. (US:TCBI) , and Interface, Inc. (US:TILE) .
Peningkatan Tertinggi Kuartal Ini
Kami menggunakan perubahan dalam alokasi portofolio karena ini adalah metrik yang paling bermakna. Perubahan dapat disebabkan oleh perdagangan atau perubahan harga saham.
| Keamanan | Saham (MM) |
Nilai (Juta Dolar AS) |
Portfolio % | ΔPorsyento ng Portfolio |
|---|---|---|---|---|
| 0.00 | 0.99 | 1.9062 | 1.9062 | |
| 0.01 | 0.79 | 1.5228 | 1.5228 | |
| 0.00 | 0.79 | 1.5326 | 1.4052 | |
| 0.07 | 0.70 | 1.3495 | 1.3495 | |
| 0.01 | 0.68 | 1.3067 | 1.3067 | |
| 0.04 | 0.65 | 1.2525 | 1.2525 | |
| 0.01 | 0.62 | 1.2016 | 1.2016 | |
| 0.02 | 0.61 | 1.1807 | 1.1807 | |
| 0.02 | 0.56 | 1.0902 | 1.0902 | |
| 0.00 | 0.55 | 1.0691 | 1.0691 |
Penurunan Tertinggi Kuartal Ini
Kami menggunakan perubahan dalam alokasi portofolio karena ini adalah metrik yang paling bermakna. Perubahan dapat disebabkan oleh perdagangan atau perubahan harga saham.
| Keamanan | Saham (MM) |
Nilai (Juta Dolar AS) |
Portfolio % | ΔPorsyento ng Portfolio |
|---|---|---|---|---|
| 0.01 | 0.24 | 0.4641 | -1.4969 | |
| 0.00 | 0.27 | 0.5146 | -1.3708 | |
| 0.00 | 0.00 | -0.8101 | ||
| 0.02 | 0.58 | 1.1247 | -0.7733 | |
| 0.00 | 0.00 | -0.6725 | ||
| 0.00 | 0.41 | 0.7904 | -0.5780 | |
| 0.00 | 0.48 | 0.9246 | -0.5259 | |
| 0.01 | 0.42 | 0.8140 | -0.5007 | |
| 0.02 | 0.42 | 0.8069 | -0.4900 | |
| 0.01 | 0.49 | 0.9488 | -0.4413 |
Pengajuan 13F dan Dana
Formulir ini diajukan pada 2025-03-21 untuk periode pelaporan 2025-01-31. Klik ikon tautan untuk melihat riwayat transaksi selengkapnya.
Tingkatkan ke versi premium untuk membuka data premium dan ekspor ke Excel. ![]() .
.
| Keamanan | Ketik | Harga Saham Rata-rata | Saham (MM) |
ΔSaham (%) |
ΔSaham (%) |
Nilai ($MM) |
Portpolyo (%) |
ΔPortofolio (%) |
|
|---|---|---|---|---|---|---|---|---|---|
| DOCU / DocuSign, Inc. | 0.01 | 16.26 | 1.06 | 61.95 | 2.0570 | 0.0773 | |||
| FFIV / F5, Inc. | 0.00 | 0.99 | 1.9062 | 1.9062 | |||||
| NXT / Nextracker Inc. | 0.02 | 87.34 | 0.96 | 137.53 | 1.8591 | 0.6364 | |||
| JBL / Jabil Inc. | 0.01 | 47.18 | 0.93 | 94.17 | 1.8006 | 0.3541 | |||
| GWRE / Guidewire Software, Inc. | 0.00 | 21.67 | 0.93 | 38.06 | 1.7873 | -0.2331 | |||
| NTNX / Nutanix, Inc. | 0.01 | 41.46 | 0.92 | 56.80 | 1.7811 | 0.0072 | |||
| SFM / Sprouts Farmers Market, Inc. | 0.01 | 6.03 | 0.92 | 30.77 | 1.7738 | -0.3430 | |||
| SGI / Somnigroup International Inc. | 0.01 | 46.25 | 0.90 | 92.70 | 1.7354 | 0.3308 | |||
| SMTC / Semtech Corporation | 0.01 | -4.80 | 0.84 | 44.39 | 1.6153 | -0.1316 | |||
| AYI / Acuity Inc. | 0.00 | 210.00 | 0.82 | 243.33 | 1.5922 | 0.8673 | |||
| FLEX / Flex Ltd. | 0.02 | 116.61 | 0.80 | 160.71 | 1.5526 | 0.6218 | |||
| CVCO / Cavco Industries, Inc. | 0.00 | 1,460.00 | 0.79 | 3,204.17 | 1.5326 | 1.4052 | |||
| PCOR / Procore Technologies, Inc. | 0.01 | 0.79 | 1.5228 | 1.5228 | |||||
| JLL / Jones Lang LaSalle Incorporated | 0.00 | 35.00 | 0.76 | 41.04 | 1.4748 | -0.1581 | |||
| EHC / Encompass Health Corporation | 0.01 | 143.49 | 0.76 | 143.13 | 1.4706 | 0.5266 | |||
| FTDR / Frontdoor, Inc. | 0.01 | 5.53 | 0.74 | 27.23 | 1.4353 | -0.3255 | |||
| MGNI / Magnite, Inc. | 0.04 | 40.10 | 0.74 | 93.23 | 1.4345 | 0.2755 | |||
| OC / Owens Corning | 0.00 | 52.69 | 0.73 | 59.48 | 1.4151 | 0.0301 | |||
| CVLT / Commvault Systems, Inc. | 0.00 | 88.02 | 0.72 | 92.04 | 1.3996 | 0.2607 | |||
| PLMR / Palomar Holdings, Inc. | 0.01 | 49.89 | 0.71 | 80.51 | 1.3772 | 0.1843 | |||
| JWN / Nordstrom, Inc. | 0.03 | 61.34 | 0.71 | 72.75 | 1.3733 | 0.1327 | |||
| BDC / Belden Inc. | 0.01 | 39.26 | 0.70 | 42.39 | 1.3565 | -0.1292 | |||
| NWL / Newell Brands Inc. | 0.07 | 0.70 | 1.3495 | 1.3495 | |||||
| TRN / Trinity Industries, Inc. | 0.02 | 42.04 | 0.70 | 56.88 | 1.3430 | 0.0064 | |||
| KTB / Kontoor Brands, Inc. | 0.01 | 26.13 | 0.69 | 35.23 | 1.3359 | -0.2045 | |||
| PLUS / ePlus inc. | 0.01 | 150.58 | 0.69 | 125.57 | 1.3303 | 0.4083 | |||
| CASH / Pathward Financial, Inc. | 0.01 | 96.36 | 0.69 | 121.61 | 1.3274 | 0.3914 | |||
| CCK / Crown Holdings, Inc. | 0.01 | 0.68 | 1.3067 | 1.3067 | |||||
| EWBC / East West Bancorp, Inc. | 0.01 | 13.22 | 0.67 | 19.64 | 1.2947 | -0.3943 | |||
| NBIX / Neurocrine Biosciences, Inc. | 0.00 | 73.62 | 0.67 | 119.34 | 1.2932 | 0.3727 | |||
| NTRA / Natera, Inc. | 0.00 | 53.66 | 0.67 | 124.92 | 1.2917 | 0.3951 | |||
| IBP / Installed Building Products, Inc. | 0.00 | 61.54 | 0.67 | 48.12 | 1.2904 | -0.0690 | |||
| GFF / Griffon Corporation | 0.01 | 48.38 | 0.66 | 78.59 | 1.2747 | 0.1625 | |||
| FBHS / Fortune Brands Home & Security Inc | 0.01 | 511.41 | 0.65 | 425.81 | 1.2611 | 0.8870 | |||
| GNRC / Generac Holdings Inc. | 0.00 | 63.30 | 0.65 | 47.29 | 1.2575 | -0.0743 | |||
| MBC / MasterBrand, Inc. | 0.04 | 0.65 | 1.2525 | 1.2525 | |||||
| JXN / Jackson Financial Inc. | 0.01 | 76.86 | 0.65 | 67.01 | 1.2523 | 0.0808 | |||
| HAS / Hasbro, Inc. | 0.01 | 91.24 | 0.64 | 68.77 | 1.2434 | 0.0925 | |||
| VRNS / Varonis Systems, Inc. | 0.01 | 113.66 | 0.64 | 92.75 | 1.2336 | 0.2334 | |||
| MANH / Manhattan Associates, Inc. | 0.00 | 47.80 | 0.63 | 17.25 | 1.2207 | -0.4060 | |||
| BURL / Burlington Stores, Inc. | 0.00 | 0.00 | 0.63 | 14.55 | 1.2174 | -0.4399 | |||
| FN / Fabrinet | 0.00 | 85.90 | 0.63 | 67.20 | 1.2110 | 0.0784 | |||
| TCBI / Texas Capital Bancshares, Inc. | 0.01 | 0.62 | 1.2016 | 1.2016 | |||||
| BXP / Boston Properties, Inc. | 0.01 | 150.74 | 0.62 | 197.13 | 1.2008 | 0.2203 | |||
| TILE / Interface, Inc. | 0.02 | 0.61 | 1.1807 | 1.1807 | |||||
| FHN / First Horizon Corporation | 0.03 | 0.00 | 0.60 | 26.32 | 1.1593 | -0.2725 | |||
| SLVM / Sylvamo Corporation | 0.01 | 67.65 | 0.59 | 58.13 | 1.1464 | 0.0141 | |||
| AAT / American Assets Trust, Inc. | 0.02 | 48.46 | 0.59 | 33.79 | 1.1321 | -0.1883 | |||
| GEN / Gen Digital Inc. | 0.02 | 0.00 | 0.58 | -7.47 | 1.1247 | -0.7733 | |||
| WLDN / Willdan Group, Inc. | 0.02 | 0.56 | 1.0902 | 1.0902 | |||||
| UTHR / United Therapeutics Corporation | 0.00 | 78.65 | 0.56 | 68.07 | 1.0784 | 0.0756 | |||
| PHR / Phreesia, Inc. | 0.02 | 712.50 | 0.55 | 638.67 | 1.0719 | 0.7168 | |||
| RNR / RenaissanceRe Holdings Ltd. | 0.00 | 0.55 | 1.0691 | 1.0691 | |||||
| HALO / Halozyme Therapeutics, Inc. | 0.01 | 19.46 | 0.55 | 33.90 | 1.0612 | -0.1761 | |||
| AXS / AXIS Capital Holdings Limited | 0.01 | 0.00 | 0.51 | 16.25 | 0.9827 | -0.3354 | |||
| LNTH / Lantheus Holdings, Inc. | 0.01 | 26.43 | 0.49 | 6.51 | 0.9488 | -0.4413 | |||
| DVAX / Dynavax Technologies Corporation | 0.04 | 125.21 | 0.48 | 148.70 | 0.9276 | 0.3441 | |||
| GKOS / Glaukos Corporation | 0.00 | -15.93 | 0.48 | -0.62 | 0.9246 | -0.5259 | |||
| QLYS / Qualys, Inc. | 0.00 | 0.47 | 0.8993 | 0.8993 | |||||
| VCYT / Veracyte, Inc. | 0.01 | 25.51 | 0.45 | 69.29 | 0.8732 | 0.0680 | |||
| MWA / Mueller Water Products, Inc. | 0.02 | 0.00 | 0.45 | 6.43 | 0.8649 | -0.4017 | |||
| MDXG / MiMedx Group, Inc. | 0.05 | 0.00 | 0.43 | 27.22 | 0.8309 | -0.1897 | |||
| ALKS / Alkermes plc | 0.01 | 0.00 | 0.43 | 22.77 | 0.8240 | -0.2238 | |||
| ICUI / ICU Medical, Inc. | 0.00 | 0.42 | 0.8159 | 0.8159 | |||||
| APOG / Apogee Enterprises, Inc. | 0.01 | 41.68 | 0.42 | -3.44 | 0.8140 | -0.5007 | |||
| GPK / Graphic Packaging Holding Company | 0.02 | 0.00 | 0.42 | -3.02 | 0.8069 | -0.4900 | |||
| ENSG / The Ensign Group, Inc. | 0.00 | 0.00 | 0.41 | -9.91 | 0.7904 | -0.5780 | |||
| VCEL / Vericel Corporation | 0.01 | 0.00 | 0.41 | 33.01 | 0.7869 | -0.1366 | |||
| EXEL / Exelixis, Inc. | 0.01 | 0.00 | 0.40 | -0.25 | 0.7683 | -0.4321 | |||
| DCI / Donaldson Company, Inc. | 0.01 | 0.00 | 0.37 | -2.65 | 0.7123 | -0.4296 | |||
| BHE / Benchmark Electronics, Inc. | 0.01 | 0.37 | 0.7061 | 0.7061 | |||||
| ATRC / AtriCure, Inc. | 0.01 | 75.44 | 0.36 | 105.75 | 0.6931 | -0.1222 | |||
| INSP / Inspire Medical Systems, Inc. | 0.00 | 9.32 | 0.34 | 49.78 | 0.6578 | -0.0825 | |||
| SNV / Synovus Financial Corp. | 0.01 | 0.00 | 0.34 | 13.38 | 0.6549 | -0.2482 | |||
| AXGN / Axogen, Inc. | 0.02 | 0.33 | 0.6394 | 0.6394 | |||||
| VRRM / Verra Mobility Corporation | 0.01 | 0.00 | 0.33 | 1.56 | 0.6285 | -0.3364 | |||
| MYGN / Myriad Genetics, Inc. | 0.03 | 144.03 | 0.32 | 40.97 | 0.6199 | -0.0670 | |||
| VMI / Valmont Industries, Inc. | 0.00 | 0.00 | 0.32 | 6.42 | 0.6087 | -0.2834 | |||
| VNT / Vontier Corporation | 0.01 | 0.00 | 0.30 | 4.17 | 0.5800 | -0.2903 | |||
| CRY / Artivion Inc | 0.01 | 0.00 | 0.29 | 17.67 | 0.5663 | -0.1850 | |||
| FOLD / Amicus Therapeutics, Inc. | 0.03 | 0.29 | 0.5640 | 0.5640 | |||||
| SUPN / Supernus Pharmaceuticals, Inc. | 0.01 | 0.29 | 0.5529 | 0.5529 | |||||
| OMCL / Omnicell, Inc. | 0.01 | 0.28 | 0.5422 | 0.5422 | |||||
| PSTG / Pure Storage, Inc. | 0.00 | -59.27 | 0.27 | -53.98 | 0.5146 | -1.3708 | |||
| GAP / The Gap, Inc. | 0.01 | 0.00 | 0.25 | 16.13 | 0.4877 | -0.1688 | |||
| NVCR / NovoCure Limited | 0.01 | 16.25 | 0.24 | -58.12 | 0.4641 | -1.4969 | |||
| OCUL / Ocular Therapeutix, Inc. | 0.03 | 0.23 | 0.4404 | 0.4404 | |||||
| HAE / Haemonetics Corporation | 0.00 | 0.00 | 0.23 | -3.00 | 0.4374 | -0.2658 | |||
| TFX / Teleflex Incorporated | 0.00 | -100.00 | 0.00 | -100.00 | -0.6725 | ||||
| PLOW / Douglas Dynamics, Inc. | 0.00 | -100.00 | 0.00 | -100.00 | -0.8101 |