Mga Batayang Estadistika
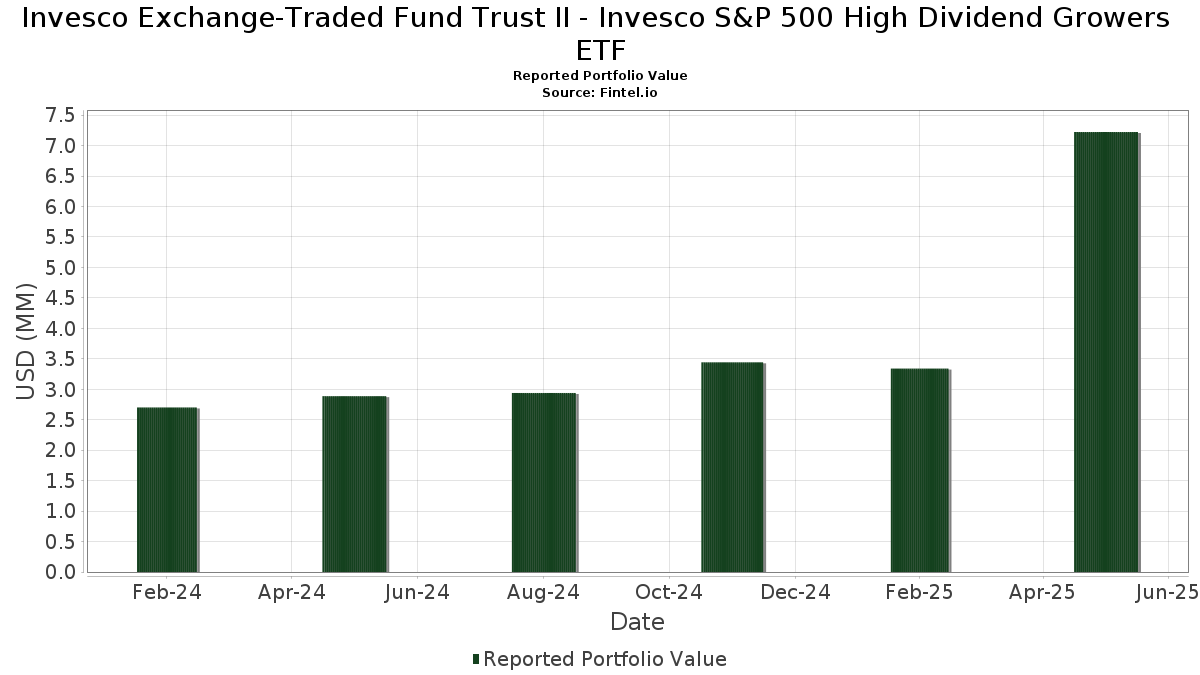
| Nilai Portofolio | $ 7,222,408 |
| Posisi Saat Ini | 103 |
Kepemilikan Terbaru, Kinerja, AUM (dari 13F, 13D)
Invesco Exchange-Traded Fund Trust II - Invesco S&P 500 High Dividend Growers ETF telah mengungkapkan total kepemilikan 103 dalam pengajuan SEC terbaru mereka. Nilai portofolio terbaru dihitung sebesar $ 7,222,408 USD. Aset yang Dikelola (AUM) sebenarnya adalah nilai ini ditambah kas (yang tidak diungkapkan). Aset-aset utama Invesco Exchange-Traded Fund Trust II - Invesco S&P 500 High Dividend Growers ETF adalah Franklin Resources, Inc. (US:BEN) , Altria Group, Inc. (US:MO) , LyondellBasell Industries N.V. (US:LYB) , Pfizer Inc. (US:PFE) , and Crown Castle Inc. (US:CCI) . Posisi baru Invesco Exchange-Traded Fund Trust II - Invesco S&P 500 High Dividend Growers ETF meliputi: Citizens Financial Corp. (US:CIWV) , General Mills, Inc. (GB:GRMD) , NIKE, Inc. (US:NKE) , Johnson Controls International plc (US:JCI) , and Diamondback Energy, Inc. (US:FANG) .
Peningkatan Tertinggi Kuartal Ini
Kami menggunakan perubahan dalam alokasi portofolio karena ini adalah metrik yang paling bermakna. Perubahan dapat disebabkan oleh perdagangan atau perubahan harga saham.
| Keamanan | Saham (MM) |
Nilai (Juta Dolar AS) |
Portfolio % | ΔPorsyento ng Portfolio |
|---|---|---|---|---|
| 0.18 | 0.18 | 2.5851 | 2.5851 | |
| 0.00 | 0.14 | 1.9573 | 1.9573 | |
| 0.00 | 0.10 | 1.3856 | 1.3856 | |
| 0.00 | 0.08 | 1.1803 | 1.1803 | |
| 0.00 | 0.07 | 1.0454 | 1.0454 | |
| 0.07 | 0.07 | 0.9912 | 0.9912 | |
| 0.01 | 0.12 | 1.6471 | 0.8891 | |
| 0.00 | 0.06 | 0.8281 | 0.8281 | |
| 0.00 | 0.06 | 0.8000 | 0.8000 | |
| 0.00 | 0.06 | 0.7897 | 0.7897 |
Penurunan Tertinggi Kuartal Ini
Kami menggunakan perubahan dalam alokasi portofolio karena ini adalah metrik yang paling bermakna. Perubahan dapat disebabkan oleh perdagangan atau perubahan harga saham.
| Keamanan | Saham (MM) |
Nilai (Juta Dolar AS) |
Portfolio % | ΔPorsyento ng Portfolio |
|---|---|---|---|---|
| 0.00 | 0.06 | 0.8873 | -0.6455 | |
| 0.00 | 0.08 | 1.1643 | -0.5702 | |
| 0.00 | 0.16 | 2.2628 | -0.5649 | |
| 0.00 | 0.08 | 1.0918 | -0.5005 | |
| 0.00 | 0.06 | 0.8867 | -0.4189 | |
| 0.00 | 0.09 | 1.2268 | -0.3654 | |
| 0.00 | 0.08 | 1.1609 | -0.3608 | |
| 0.00 | 0.04 | 0.6104 | -0.3285 | |
| 0.00 | 0.06 | 0.8992 | -0.3175 | |
| 0.00 | 0.05 | 0.7579 | -0.3010 |
Pengajuan 13F dan Dana
Formulir ini diajukan pada 2025-07-28 untuk periode pelaporan 2025-05-31. Klik ikon tautan untuk melihat riwayat transaksi selengkapnya.
Tingkatkan ke versi premium untuk membuka data premium dan ekspor ke Excel. ![]() .
.
| Keamanan | Ketik | Harga Saham Rata-rata | Saham (MM) |
ΔSaham (%) |
ΔSaham (%) |
Nilai ($MM) |
Portpolyo (%) |
ΔPortofolio (%) |
|
|---|---|---|---|---|---|---|---|---|---|
| Invesco Private Prime Fund / STIV (N/A) | 0.18 | 0.18 | 2.5851 | 2.5851 | |||||
| BEN / Franklin Resources, Inc. | 0.01 | 134.59 | 0.17 | 153.85 | 2.3664 | 0.2999 | |||
| MO / Altria Group, Inc. | 0.00 | 61.42 | 0.16 | 75.56 | 2.2628 | -0.5649 | |||
| LYB / LyondellBasell Industries N.V. | 0.00 | 361.14 | 0.16 | 244.44 | 2.2271 | 0.7891 | |||
| PFE / Pfizer Inc. | 0.01 | 223.82 | 0.15 | 186.54 | 2.1448 | 0.5133 | |||
| CCI / Crown Castle Inc. | 0.00 | 0.14 | 1.9573 | 1.9573 | |||||
| RF / Regions Financial Corporation | 0.01 | 185.29 | 0.12 | 158.70 | 1.7089 | 0.2587 | |||
| ES / Eversource Energy | 0.00 | 166.14 | 0.12 | 176.74 | 1.7068 | 0.3418 | |||
| VICI / VICI Properties Inc. | 0.00 | 123.89 | 0.12 | 118.52 | 1.6938 | -0.0031 | |||
| EIX / Edison International | 0.00 | 334.84 | 0.12 | 180.95 | 1.6911 | 0.1836 | |||
| AES / The AES Corporation | 0.01 | 446.45 | 0.12 | 379.17 | 1.6471 | 0.8891 | |||
| ARE / Alexandria Real Estate Equities, Inc. | 0.00 | 290.48 | 0.11 | 172.50 | 1.5660 | 0.2869 | |||
| CAG / Conagra Brands, Inc. | 0.00 | 286.82 | 0.11 | 186.49 | 1.5292 | 0.1936 | |||
| PRU / Prudential Financial, Inc. | 0.00 | 172.93 | 0.10 | 148.78 | 1.4699 | 0.1637 | |||
| IPG / The Interpublic Group of Companies, Inc. | 0.00 | 199.79 | 0.10 | 165.79 | 1.4473 | 0.2387 | |||
| FE / FirstEnergy Corp. | 0.00 | 152.71 | 0.10 | 175.00 | 1.4282 | 0.2845 | |||
| CIWV / Citizens Financial Corp. | 0.00 | 0.10 | 1.3856 | 1.3856 | |||||
| HPQ / HP Inc. | 0.00 | 303.72 | 0.09 | 225.00 | 1.3172 | 0.4317 | |||
| IRM / Iron Mountain Incorporated | 0.00 | 351.22 | 0.09 | 378.95 | 1.3076 | 0.7088 | |||
| SRE / Sempra | 0.00 | 190.63 | 0.09 | 221.43 | 1.2920 | 0.4057 | |||
| FITB / Fifth Third Bancorp | 0.00 | 178.86 | 0.09 | 148.57 | 1.2551 | 0.1336 | |||
| PLD / Prologis, Inc. | 0.00 | 191.30 | 0.09 | 155.88 | 1.2504 | 0.1781 | |||
| STT / State Street Corporation | 0.00 | 128.28 | 0.09 | 123.08 | 1.2464 | 0.0145 | |||
| EVRG / Evergy, Inc. | 0.00 | 75.03 | 0.09 | 70.00 | 1.2268 | -0.3654 | |||
| HRL / Hormel Foods Corporation | 0.00 | 123.57 | 0.08 | 144.12 | 1.2003 | 0.1035 | |||
| OKE / ONEOK, Inc. | 0.00 | 119.07 | 0.08 | 76.60 | 1.1970 | -0.2885 | |||
| GRMD / General Mills, Inc. | 0.00 | 0.08 | 1.1803 | 1.1803 | |||||
| CVS / CVS Health Corporation | 0.00 | 88.89 | 0.08 | 84.09 | 1.1693 | -0.2215 | |||
| BMY / Bristol-Myers Squibb Company | 0.00 | 81.47 | 0.08 | 47.27 | 1.1643 | -0.5702 | |||
| CVX / Chevron Corporation | 0.00 | 93.79 | 0.08 | 68.75 | 1.1609 | -0.3608 | |||
| C / Citigroup Inc. | 0.00 | 89.40 | 0.08 | 77.78 | 1.1563 | -0.2624 | |||
| MS / Morgan Stanley | 0.00 | 88.32 | 0.08 | 81.82 | 1.1532 | -0.2406 | |||
| MAA / Mid-America Apartment Communities, Inc. | 0.00 | 94.30 | 0.08 | 81.82 | 1.1463 | -0.2398 | |||
| PFG / Principal Financial Group, Inc. | 0.00 | 146.98 | 0.08 | 117.14 | 1.0965 | -0.0145 | |||
| INVH / Invitation Homes Inc. | 0.00 | 121.90 | 0.08 | 123.53 | 1.0955 | 0.0048 | |||
| WMB / The Williams Companies, Inc. | 0.00 | 44.33 | 0.08 | 52.00 | 1.0918 | -0.5005 | |||
| CMCSA / Comcast Corporation | 0.00 | 186.47 | 0.07 | 174.07 | 1.0693 | 0.2212 | |||
| ESS / Essex Property Trust, Inc. | 0.00 | 118.33 | 0.07 | 100.00 | 1.0652 | -0.1070 | |||
| MDT / Medtronic plc | 0.00 | 133.94 | 0.07 | 111.43 | 1.0647 | -0.0402 | |||
| MRK / Merck & Co., Inc. | 0.00 | 0.07 | 1.0454 | 1.0454 | |||||
| PEP / PepsiCo, Inc. | 0.00 | 187.37 | 0.07 | 144.83 | 1.0278 | 0.1137 | |||
| NEE / NextEra Energy, Inc. | 0.00 | 212.00 | 0.07 | 222.73 | 1.0258 | 0.3108 | |||
| WEC / WEC Energy Group, Inc. | 0.00 | 74.02 | 0.07 | 77.50 | 1.0201 | -0.2543 | |||
| XEL / Xcel Energy Inc. | 0.00 | 79.00 | 0.07 | 75.00 | 1.0099 | -0.2604 | |||
| ABBV / AbbVie Inc. | 0.00 | 119.77 | 0.07 | 100.00 | 1.0074 | -0.1197 | |||
| Invesco Private Government Fund / STIV (N/A) | 0.07 | 0.07 | 0.9912 | 0.9912 | |||||
| LNT / Alliant Energy Corporation | 0.00 | 101.09 | 0.07 | 94.29 | 0.9821 | -0.1266 | |||
| MPC / Marathon Petroleum Corporation | 0.00 | 200.00 | 0.07 | 230.00 | 0.9461 | 0.3010 | |||
| BAC / Bank of America Corporation | 0.00 | 123.46 | 0.07 | 116.67 | 0.9391 | -0.0220 | |||
| AMGN / Amgen Inc. | 0.00 | 144.09 | 0.07 | 132.14 | 0.9368 | 0.0386 | |||
| PEG / Public Service Enterprise Group Incorporated | 0.00 | 155.16 | 0.06 | 156.00 | 0.9179 | 0.1292 | |||
| MDLZ / Mondelez International, Inc. | 0.00 | 151.74 | 0.06 | 173.91 | 0.9075 | 0.1564 | |||
| PAYX / Paychex, Inc. | 0.00 | 81.82 | 0.06 | 90.91 | 0.9045 | -0.1415 | |||
| NI / NiSource Inc. | 0.00 | 66.98 | 0.06 | 63.16 | 0.8992 | -0.3175 | |||
| EOG / EOG Resources, Inc. | 0.00 | 135.66 | 0.06 | 106.67 | 0.8940 | -0.0770 | |||
| ETR / Entergy Corporation | 0.00 | 32.86 | 0.06 | 27.08 | 0.8873 | -0.6455 | |||
| CTRA / Coterra Energy Inc. | 0.00 | 65.07 | 0.06 | 48.78 | 0.8867 | -0.4189 | |||
| LW / Lamb Weston Holdings, Inc. | 0.00 | 199.18 | 0.06 | 238.89 | 0.8747 | 0.2795 | |||
| CMS / CMS Energy Corporation | 0.00 | 97.03 | 0.06 | 93.55 | 0.8659 | -0.1349 | |||
| COP / ConocoPhillips | 0.00 | 160.67 | 0.06 | 126.92 | 0.8507 | 0.0207 | |||
| NSC / Norfolk Southern Corporation | 0.00 | 0.06 | 0.8281 | 0.8281 | |||||
| KDP / Keurig Dr Pepper Inc. | 0.00 | 146.16 | 0.06 | 147.83 | 0.8202 | 0.0940 | |||
| BK / The Bank of New York Mellon Corporation | 0.00 | 76.03 | 0.06 | 75.00 | 0.8109 | -0.2014 | |||
| EQIX / Equinix, Inc. | 0.00 | 162.50 | 0.06 | 161.90 | 0.8019 | 0.1212 | |||
| JPM / JPMorgan Chase & Co. | 0.00 | 82.76 | 0.06 | 83.33 | 0.8015 | -0.1609 | |||
| NKE / NIKE, Inc. | 0.00 | 0.06 | 0.8000 | 0.8000 | |||||
| ITW / Illinois Tool Works Inc. | 0.00 | 149.45 | 0.06 | 129.17 | 0.7967 | 0.0436 | |||
| JCI / Johnson Controls International plc | 0.00 | 0.06 | 0.7897 | 0.7897 | |||||
| PG / The Procter & Gamble Company | 0.00 | 118.92 | 0.06 | 120.00 | 0.7883 | -0.0183 | |||
| FANG / Diamondback Energy, Inc. | 0.00 | 0.05 | 0.7649 | 0.7649 | |||||
| DVN / Devon Energy Corporation | 0.00 | 208.03 | 0.05 | 165.00 | 0.7648 | 0.1142 | |||
| SNA / Snap-on Incorporated | 0.00 | 66.67 | 0.05 | 57.58 | 0.7579 | -0.3010 | |||
| BLK / BlackRock, Inc. | 0.00 | 107.69 | 0.05 | 108.00 | 0.7578 | -0.0392 | |||
| SBUX / Starbucks Corporation | 0.00 | 139.46 | 0.05 | 73.33 | 0.7514 | -0.1962 | |||
| FDX / FedEx Corporation | 0.00 | 196.25 | 0.05 | 142.86 | 0.7402 | 0.0809 | |||
| ATO / Atmos Energy Corporation | 0.00 | 85.96 | 0.05 | 88.89 | 0.7332 | -0.1157 | |||
| FAST / Fastenal Company | 0.00 | 277.37 | 0.05 | 112.50 | 0.7305 | -0.0458 | |||
| SYF / Synchrony Financial | 0.00 | 97.30 | 0.05 | 127.27 | 0.7232 | -0.0689 | |||
| STZ / Constellation Brands, Inc. | 0.00 | 302.90 | 0.05 | 308.33 | 0.7098 | 0.3302 | |||
| AWK / American Water Works Company, Inc. | 0.00 | 113.04 | 0.05 | 133.33 | 0.7023 | 0.0160 | |||
| ADP / Automatic Data Processing, Inc. | 0.00 | 94.74 | 0.05 | 108.70 | 0.6899 | -0.0610 | |||
| SBAC / SBA Communications Corporation | 0.00 | 0.05 | 0.6874 | 0.6874 | |||||
| ACN / Accenture plc | 0.00 | 208.51 | 0.05 | 181.25 | 0.6579 | 0.1444 | |||
| ADI / Analog Devices, Inc. | 0.00 | 187.84 | 0.05 | 164.71 | 0.6527 | 0.1190 | |||
| KR / The Kroger Co. | 0.00 | 57.66 | 0.04 | 62.96 | 0.6439 | -0.2055 | |||
| AFL / Aflac Incorporated | 0.00 | 136.52 | 0.04 | 126.32 | 0.6242 | 0.0134 | |||
| BKR / Baker Hughes Company | 0.00 | 78.32 | 0.04 | 48.28 | 0.6197 | -0.2959 | |||
| AIG / American International Group, Inc. | 0.00 | 68.09 | 0.04 | 72.00 | 0.6194 | -0.1711 | |||
| GRMN / Garmin Ltd. | 0.00 | 13.51 | 0.04 | 68.00 | 0.6104 | -0.3285 | |||
| AVGO / Broadcom Inc. | 0.00 | 126.67 | 0.04 | 192.86 | 0.5893 | 0.1204 | |||
| ORCL / Oracle Corporation | 0.00 | 238.10 | 0.04 | 250.00 | 0.5049 | 0.1769 | |||
| NOC / Northrop Grumman Corporation | 0.00 | 132.26 | 0.03 | 142.86 | 0.4998 | 0.0511 | |||
| LRCX / Lam Research Corporation | 0.00 | 192.25 | 0.03 | 230.00 | 0.4801 | 0.1385 | |||
| DPZ / Domino's Pizza, Inc. | 0.00 | 89.19 | 0.03 | 83.33 | 0.4750 | -0.0931 | |||
| ZTS / Zoetis Inc. | 0.00 | 237.04 | 0.03 | 233.33 | 0.4395 | 0.1564 | |||
| APH / Amphenol Corporation | 0.00 | 112.50 | 0.03 | 200.00 | 0.4379 | 0.1038 | |||
| AXP / American Express Company | 0.00 | 130.23 | 0.03 | 141.67 | 0.4169 | 0.0112 | |||
| 1DHI / D.R. Horton, Inc. | 0.00 | 0.03 | 0.4159 | 0.4159 | |||||
| AMAT / Applied Materials, Inc. | 0.00 | 0.03 | 0.4153 | 0.4153 | |||||
| NQG / Monolithic Power Systems, Inc. | 0.00 | 0.03 | 0.4076 | 0.4076 | |||||
| GE / General Electric Company | 0.00 | 0.02 | 0.3099 | 0.3099 | |||||
| UNH / UnitedHealth Group Incorporated | 0.00 | 144.44 | 0.02 | 58.33 | 0.2854 | -0.1167 | |||
| US8252528851 / Invesco Government & Agency Portfolio, Institutional Class | 0.00 | 39.03 | 0.00 | 100.00 | 0.0290 | -0.0248 |