Mga Batayang Estadistika
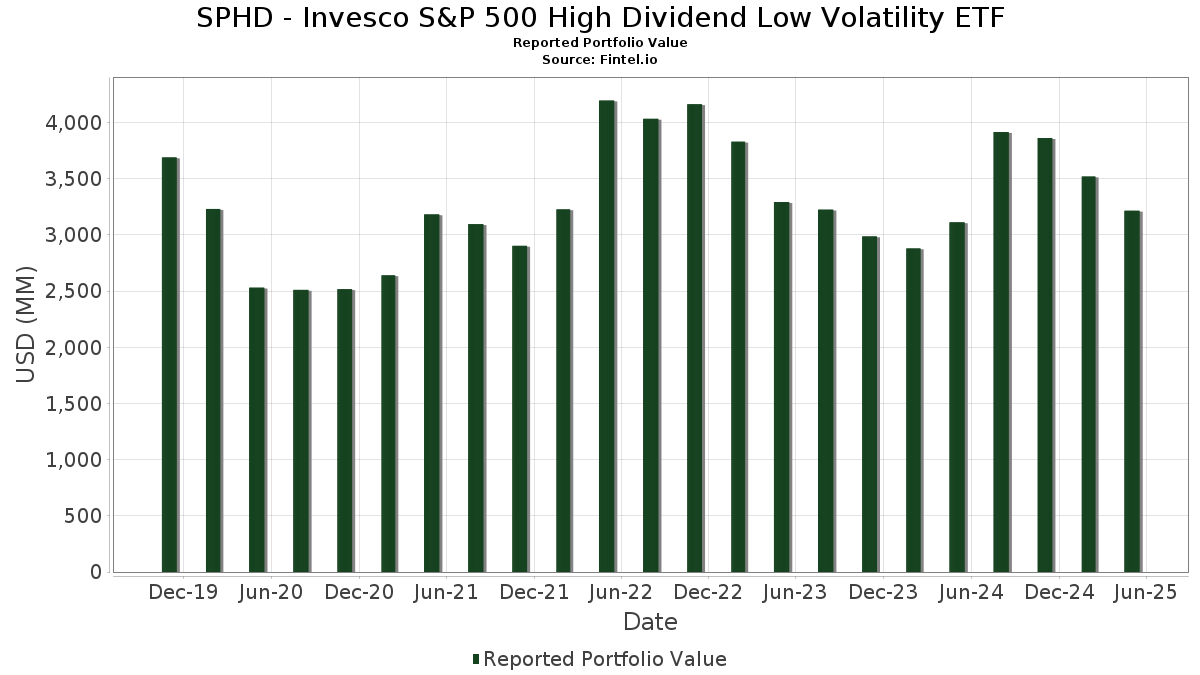
| Nilai Portofolio | $ 3,214,826,312 |
| Posisi Saat Ini | 52 |
Kepemilikan Terbaru, Kinerja, AUM (dari 13F, 13D)
SPHD - Invesco S&P 500 High Dividend Low Volatility ETF telah mengungkapkan total kepemilikan 52 dalam pengajuan SEC terbaru mereka. Nilai portofolio terbaru dihitung sebesar $ 3,214,826,312 USD. Aset yang Dikelola (AUM) sebenarnya adalah nilai ini ditambah kas (yang tidak diungkapkan). Aset-aset utama SPHD - Invesco S&P 500 High Dividend Low Volatility ETF adalah Altria Group, Inc. (US:MO) , Crown Castle Inc. (US:CCI) , Verizon Communications Inc. (US:VZ) , Philip Morris International Inc. (US:PM) , and VICI Properties Inc. (US:VICI) .
Peningkatan Tertinggi Kuartal Ini
Kami menggunakan perubahan dalam alokasi portofolio karena ini adalah metrik yang paling bermakna. Perubahan dapat disebabkan oleh perdagangan atau perubahan harga saham.
| Keamanan | Saham (MM) |
Nilai (Juta Dolar AS) |
Portfolio % | ΔPorsyento ng Portfolio |
|---|---|---|---|---|
| 0.49 | 88.72 | 2.7685 | 0.5485 | |
| 1.90 | 115.37 | 3.6002 | 0.5120 | |
| 1.11 | 111.06 | 3.4656 | 0.4406 | |
| 12.65 | 12.65 | 0.3949 | 0.3949 | |
| 2.40 | 105.50 | 3.2920 | 0.2876 | |
| 1.53 | 64.33 | 2.0074 | 0.2769 | |
| 1.26 | 81.37 | 2.5391 | 0.2421 | |
| 3.05 | 84.69 | 2.6429 | 0.2182 | |
| 1.53 | 86.78 | 2.7081 | 0.1697 | |
| 1.96 | 54.96 | 1.7151 | 0.1691 |
Penurunan Tertinggi Kuartal Ini
Kami menggunakan perubahan dalam alokasi portofolio karena ini adalah metrik yang paling bermakna. Perubahan dapat disebabkan oleh perdagangan atau perubahan harga saham.
| Keamanan | Saham (MM) |
Nilai (Juta Dolar AS) |
Portfolio % | ΔPorsyento ng Portfolio |
|---|---|---|---|---|
| 1.28 | 72.35 | 2.2577 | -0.6008 | |
| 0.74 | 52.17 | 1.6281 | -0.5788 | |
| 2.39 | 66.43 | 2.0730 | -0.5778 | |
| 0.55 | 53.83 | 1.6797 | -0.2318 | |
| 0.55 | 43.12 | 1.3455 | -0.2212 | |
| 0.54 | 43.31 | 1.3515 | -0.2137 | |
| 4.04 | 70.26 | 2.1924 | -0.2051 | |
| 1.45 | 57.22 | 1.7855 | -0.1684 | |
| 2.52 | 67.47 | 2.1052 | -0.1453 | |
| 0.41 | 56.13 | 1.7517 | -0.1438 |
Pengajuan 13F dan Dana
Formulir ini diajukan pada 2025-07-28 untuk periode pelaporan 2025-05-31. Klik ikon tautan untuk melihat riwayat transaksi selengkapnya.
Tingkatkan ke versi premium untuk membuka data premium dan ekspor ke Excel. ![]() .
.
| Keamanan | Ketik | Harga Saham Rata-rata | Saham (MM) |
ΔSaham (%) |
ΔSaham (%) |
Nilai ($MM) |
Portpolyo (%) |
ΔPortofolio (%) |
|
|---|---|---|---|---|---|---|---|---|---|
| MO / Altria Group, Inc. | 1.90 | -1.06 | 115.37 | 7.38 | 3.6002 | 0.5120 | |||
| CCI / Crown Castle Inc. | 1.11 | -1.05 | 111.06 | 5.52 | 3.4656 | 0.4406 | |||
| VZ / Verizon Communications Inc. | 2.40 | -1.05 | 105.50 | 0.93 | 3.2920 | 0.2876 | |||
| PM / Philip Morris International Inc. | 0.49 | -1.23 | 88.72 | 14.86 | 2.7685 | 0.5485 | |||
| VICI / VICI Properties Inc. | 2.78 | -1.02 | 88.27 | -3.40 | 2.7544 | 0.1282 | |||
| O / Realty Income Corporation | 1.53 | -1.02 | 86.78 | -1.73 | 2.7081 | 0.1697 | |||
| T / AT&T Inc. | 3.05 | -1.01 | 84.69 | 0.39 | 2.6429 | 0.2182 | |||
| ES / Eversource Energy | 1.26 | -1.01 | 81.37 | 1.81 | 2.5391 | 0.2421 | |||
| PFE / Pfizer Inc. | 3.45 | -1.04 | 80.95 | -12.04 | 2.5262 | -0.1192 | |||
| D / Dominion Energy, Inc. | 1.32 | -1.01 | 74.59 | -0.92 | 2.3275 | 0.1638 | |||
| LYB / LyondellBasell Industries N.V. | 1.28 | -1.06 | 72.35 | -27.25 | 2.2577 | -0.6008 | |||
| AMCR / Amcor plc | 7.77 | -1.03 | 70.77 | -10.90 | 2.2085 | -0.0746 | |||
| DOC / Healthpeak Properties, Inc. | 4.04 | -1.02 | 70.26 | -15.77 | 2.1924 | -0.2051 | |||
| KHC / The Kraft Heinz Company | 2.52 | -1.01 | 67.47 | -13.84 | 2.1052 | -0.1453 | |||
| DOW / Dow Inc. | 2.39 | -1.04 | 66.43 | -27.97 | 2.0730 | -0.5778 | |||
| FE / FirstEnergy Corp. | 1.53 | -1.23 | 64.33 | 6.84 | 2.0074 | 0.2769 | |||
| EXC / Exelon Corporation | 1.46 | -1.23 | 63.80 | -2.08 | 1.9910 | 0.1181 | |||
| CAG / Conagra Brands, Inc. | 2.78 | -1.23 | 63.60 | -11.48 | 1.9848 | -0.0805 | |||
| PNW / Pinnacle West Capital Corporation | 0.69 | -1.23 | 63.00 | -2.63 | 1.9660 | 0.1062 | |||
| EVRG / Evergy, Inc. | 0.94 | -1.24 | 62.59 | -4.82 | 1.9530 | 0.0631 | |||
| SPG / Simon Property Group, Inc. | 0.38 | -1.23 | 62.50 | -13.45 | 1.9503 | -0.1253 | |||
| KVUE / Kenvue Inc. | 2.59 | -1.23 | 61.88 | -0.10 | 1.9310 | 0.1505 | |||
| EXR / Extra Space Storage Inc. | 0.40 | -1.23 | 61.15 | -2.14 | 1.9081 | 0.1121 | |||
| SJM / The J. M. Smucker Company | 0.53 | -1.23 | 59.92 | 0.62 | 1.8699 | 0.1583 | |||
| HST / Host Hotels & Resorts, Inc. | 3.83 | -1.23 | 59.29 | -5.15 | 1.8500 | 0.0534 | |||
| KMB / Kimberly-Clark Corporation | 0.41 | -1.23 | 59.20 | -0.02 | 1.8473 | 0.1455 | |||
| DUK / Duke Energy Corporation | 0.50 | -1.24 | 58.46 | -1.04 | 1.8244 | 0.1263 | |||
| AEP / American Electric Power Company, Inc. | 0.56 | -1.23 | 57.93 | -3.62 | 1.8078 | 0.0802 | |||
| TFC / Truist Financial Corporation | 1.45 | -1.23 | 57.22 | -15.83 | 1.7855 | -0.1684 | |||
| IPG / The Interpublic Group of Companies, Inc. | 2.34 | -1.23 | 56.16 | -13.63 | 1.7523 | -0.1165 | |||
| CVX / Chevron Corporation | 0.41 | -1.23 | 56.13 | -14.88 | 1.7517 | -0.1438 | |||
| PRU / Prudential Financial, Inc. | 0.53 | -1.23 | 55.16 | -10.85 | 1.7214 | -0.0571 | |||
| KMI / Kinder Morgan, Inc. | 1.96 | -1.24 | 54.96 | 2.18 | 1.7151 | 0.1691 | |||
| KIM / Kimco Realty Corporation | 2.56 | -1.23 | 54.53 | -4.99 | 1.7015 | 0.0520 | |||
| ABBV / AbbVie Inc. | 0.29 | -1.23 | 54.14 | -12.06 | 1.6894 | -0.0801 | |||
| UPS / United Parcel Service, Inc. | 0.55 | -1.23 | 53.83 | -19.06 | 1.6797 | -0.2318 | |||
| EIX / Edison International | 0.96 | -1.23 | 53.25 | 0.97 | 1.6617 | 0.1458 | |||
| PSX / Phillips 66 | 0.46 | -1.23 | 52.23 | -13.58 | 1.6297 | -0.1072 | |||
| USB / U.S. Bancorp | 1.20 | -1.23 | 52.21 | -8.20 | 1.6293 | -0.0056 | |||
| ARE / Alexandria Real Estate Equities, Inc. | 0.74 | -1.00 | 52.17 | -32.05 | 1.6281 | -0.5788 | |||
| RF / Regions Financial Corporation | 2.42 | -1.23 | 51.84 | -10.69 | 1.6175 | -0.0507 | |||
| AMGN / Amgen Inc. | 0.18 | -1.24 | 51.30 | -7.61 | 1.6009 | 0.0049 | |||
| TROW / T. Rowe Price Group, Inc. | 0.55 | -1.23 | 51.03 | -12.56 | 1.5924 | -0.0850 | |||
| JNJ / Johnson & Johnson | 0.33 | -1.23 | 50.96 | -7.10 | 1.5902 | 0.0136 | |||
| WMB / The Williams Companies, Inc. | 0.84 | -1.19 | 50.63 | 2.77 | 1.5801 | 0.1639 | |||
| XOM / Exxon Mobil Corporation | 0.47 | -1.23 | 47.72 | -9.24 | 1.4891 | -0.0222 | |||
| GIS / General Mills, Inc. | 0.88 | -1.23 | 47.62 | -11.60 | 1.4860 | -0.0623 | |||
| MDT / Medtronic plc | 0.55 | -1.24 | 45.63 | -10.94 | 1.4238 | -0.0487 | |||
| OKE / ONEOK, Inc. | 0.54 | -1.24 | 43.31 | -20.47 | 1.3515 | -0.2137 | |||
| EMN / Eastman Chemical Company | 0.55 | -1.24 | 43.12 | -20.90 | 1.3455 | -0.2212 | |||
| Invesco Private Prime Fund / STIV (N/A) | 12.65 | 12.65 | 0.3949 | 0.3949 | |||||
| Invesco Private Government Fund / STIV (N/A) | 4.78 | 4.78 | 0.1491 | 0.1491 |