Mga Batayang Estadistika
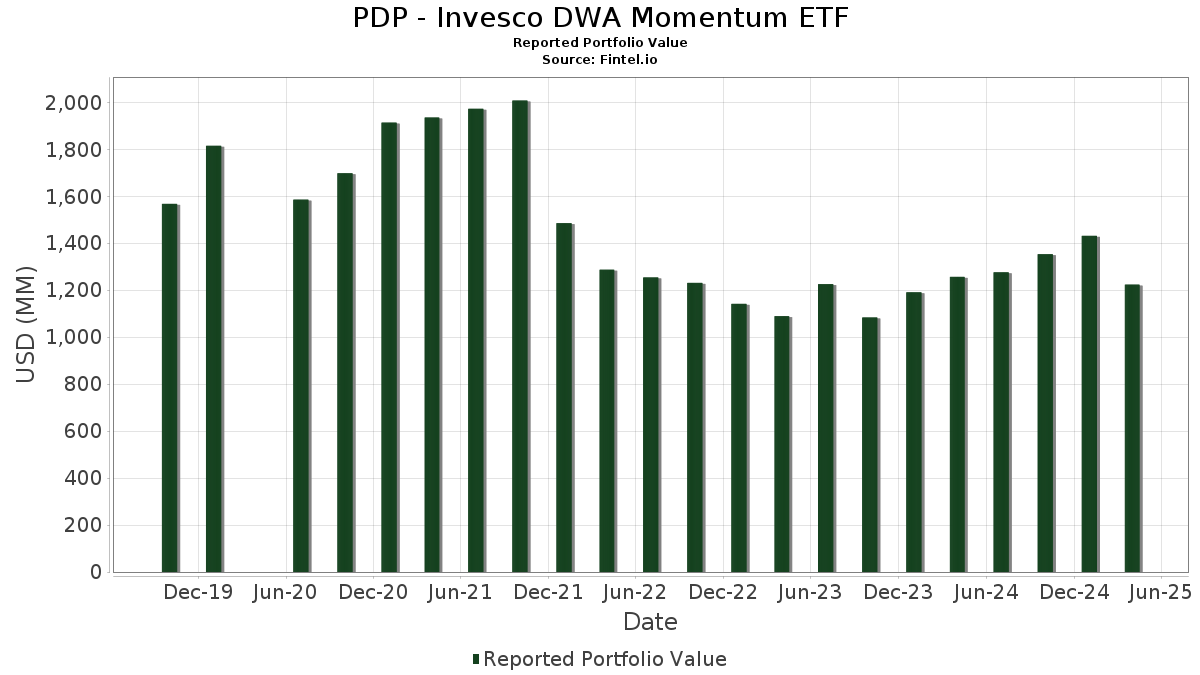
| Nilai Portofolio | $ 1,223,577,371 |
| Posisi Saat Ini | 103 |
Kepemilikan Terbaru, Kinerja, AUM (dari 13F, 13D)
PDP - Invesco DWA Momentum ETF telah mengungkapkan total kepemilikan 103 dalam pengajuan SEC terbaru mereka. Nilai portofolio terbaru dihitung sebesar $ 1,223,577,371 USD. Aset yang Dikelola (AUM) sebenarnya adalah nilai ini ditambah kas (yang tidak diungkapkan). Aset-aset utama PDP - Invesco DWA Momentum ETF adalah O'Reilly Automotive, Inc. (US:ORLY) , Apple Inc. (US:AAPL) , Copart, Inc. (US:CPRT) , Mastercard Incorporated (US:MA) , and Amphenol Corporation (US:APH) . Posisi baru PDP - Invesco DWA Momentum ETF meliputi: Insmed Incorporated (US:INSM) , Republic Services, Inc. (US:RSG) , General Electric Company (US:GE) , Casey's General Stores, Inc. (US:CASY) , and Cardinal Health, Inc. (US:CAH) .
Peningkatan Tertinggi Kuartal Ini
Kami menggunakan perubahan dalam alokasi portofolio karena ini adalah metrik yang paling bermakna. Perubahan dapat disebabkan oleh perdagangan atau perubahan harga saham.
| Keamanan | Saham (MM) |
Nilai (Juta Dolar AS) |
Portfolio % | ΔPorsyento ng Portfolio |
|---|---|---|---|---|
| 25.84 | 25.84 | 2.1768 | 2.1768 | |
| 0.02 | 17.86 | 1.5044 | 1.5044 | |
| 0.04 | 12.61 | 1.0625 | 1.0625 | |
| 0.16 | 11.74 | 0.9886 | 0.9886 | |
| 9.93 | 9.93 | 0.8368 | 0.8368 | |
| 0.04 | 9.28 | 0.7819 | 0.7819 | |
| 0.05 | 9.24 | 0.7781 | 0.7781 | |
| 0.03 | 9.18 | 0.7734 | 0.7734 | |
| 0.02 | 8.84 | 0.7442 | 0.7442 | |
| 0.06 | 8.79 | 0.7403 | 0.7403 |
Penurunan Tertinggi Kuartal Ini
Kami menggunakan perubahan dalam alokasi portofolio karena ini adalah metrik yang paling bermakna. Perubahan dapat disebabkan oleh perdagangan atau perubahan harga saham.
| Keamanan | Saham (MM) |
Nilai (Juta Dolar AS) |
Portfolio % | ΔPorsyento ng Portfolio |
|---|---|---|---|---|
| 0.00 | 0.00 | -2.6203 | ||
| 0.17 | 5.80 | 0.4885 | -1.3393 | |
| 0.00 | 0.00 | -1.0307 | ||
| 0.00 | 0.00 | -0.9285 | ||
| 0.00 | 0.00 | -0.8467 | ||
| 0.00 | 0.00 | -0.8250 | ||
| 0.00 | 0.00 | -0.7695 | ||
| 0.00 | 0.00 | -0.7325 | ||
| 0.00 | 0.00 | -0.6841 | ||
| 0.00 | 0.00 | -0.6367 |
Pengajuan 13F dan Dana
Formulir ini diajukan pada 2025-06-27 untuk periode pelaporan 2025-04-30. Klik ikon tautan untuk melihat riwayat transaksi selengkapnya.
Tingkatkan ke versi premium untuk membuka data premium dan ekspor ke Excel. ![]() .
.
| Keamanan | Ketik | Harga Saham Rata-rata | Saham (MM) |
ΔSaham (%) |
ΔSaham (%) |
Nilai ($MM) |
Portpolyo (%) |
ΔPortofolio (%) |
|
|---|---|---|---|---|---|---|---|---|---|
| ORLY / O'Reilly Automotive, Inc. | 0.03 | -21.03 | 36.70 | 10.30 | 3.0915 | 0.2969 | |||
| AAPL / Apple Inc. | 0.17 | 3.14 | 35.78 | -7.13 | 3.0135 | 0.2226 | |||
| CPRT / Copart, Inc. | 0.57 | 2.00 | 34.82 | 7.47 | 2.9333 | 0.5856 | |||
| MA / Mastercard Incorporated | 0.06 | -9.62 | 34.10 | -10.82 | 2.8720 | 0.1022 | |||
| APH / Amphenol Corporation | 0.42 | -6.86 | 32.41 | 1.26 | 2.7301 | 0.4111 | |||
| APP / AppLovin Corporation | 0.11 | -1.79 | 29.03 | -28.44 | 2.4449 | -0.4935 | |||
| Invesco Private Prime Fund / STIV (N/A) | 25.84 | 25.84 | 2.1768 | 2.1768 | |||||
| TRGP / Targa Resources Corp. | 0.15 | -16.34 | 25.37 | -27.35 | 2.1373 | -0.3931 | |||
| GWW / W.W. Grainger, Inc. | 0.02 | 11.21 | 24.78 | 7.20 | 2.0870 | 0.4125 | |||
| FI / Fiserv, Inc. | 0.12 | -0.25 | 22.87 | -14.78 | 1.9264 | -0.0178 | |||
| COST / Costco Wholesale Corporation | 0.02 | 8.65 | 21.66 | 10.28 | 1.8243 | 0.4014 | |||
| TT / Trane Technologies plc | 0.06 | 9.16 | 21.49 | 15.35 | 1.8105 | 0.4605 | |||
| SFM / Sprouts Farmers Market, Inc. | 0.12 | 2.66 | 20.74 | 10.87 | 1.7473 | 0.3917 | |||
| HWM / Howmet Aerospace Inc. | 0.13 | -4.38 | 18.63 | 4.69 | 1.5692 | 0.2799 | |||
| LLY / Eli Lilly and Company | 0.02 | 17.86 | 1.5044 | 1.5044 | |||||
| TJX / The TJX Companies, Inc. | 0.14 | 5.24 | 17.41 | 8.53 | 1.4665 | 0.3043 | |||
| CRS / Carpenter Technology Corporation | 0.09 | -0.74 | 17.40 | 0.57 | 1.4657 | 0.2122 | |||
| V / Visa Inc. | 0.05 | 0.22 | 17.36 | 1.31 | 1.4624 | 0.2208 | |||
| NFLX / Netflix, Inc. | 0.01 | 18.39 | 16.53 | 37.18 | 1.3922 | 0.5193 | |||
| TMUS / T-Mobile US, Inc. | 0.06 | 0.69 | 15.48 | 6.73 | 1.3042 | 0.2532 | |||
| RCL / Royal Caribbean Cruises Ltd. | 0.07 | 6.62 | 15.12 | -14.06 | 1.2737 | -0.0009 | |||
| ISRG / Intuitive Surgical, Inc. | 0.03 | 18.43 | 14.88 | 6.81 | 1.2535 | 0.2441 | |||
| META / Meta Platforms, Inc. | 0.02 | 13.40 | 13.67 | -9.67 | 1.1517 | 0.0551 | |||
| MSFT / Microsoft Corporation | 0.03 | 25.43 | 13.65 | 19.44 | 1.1497 | 0.3218 | |||
| COKE / Coca-Cola Consolidated, Inc. | 0.01 | 18.84 | 13.49 | 17.82 | 1.1366 | 0.3069 | |||
| SNA / Snap-on Incorporated | 0.04 | 24.16 | 12.86 | 9.70 | 1.0831 | 0.2339 | |||
| AJG / Arthur J. Gallagher & Co. | 0.04 | 27.26 | 12.85 | 35.22 | 1.0823 | 0.3939 | |||
| AON / Aon plc | 0.04 | 12.61 | 1.0625 | 1.0625 | |||||
| BJ / BJ's Wholesale Club Holdings, Inc. | 0.11 | 26.08 | 12.61 | 49.65 | 1.0623 | 0.4517 | |||
| AM / Antero Midstream Corporation | 0.76 | 31.01 | 12.51 | 77.14 | 1.0535 | 0.4316 | |||
| NTNX / Nutanix, Inc. | 0.18 | 26.98 | 12.41 | 26.86 | 1.0455 | 0.3367 | |||
| JBL / Jabil Inc. | 0.08 | 30.70 | 12.13 | 17.94 | 1.0217 | 0.2766 | |||
| GOOGL / Alphabet Inc. | 0.08 | 47.47 | 11.96 | 36.52 | 1.0072 | 0.3016 | |||
| BRO / Brown & Brown, Inc. | 0.11 | 28.60 | 11.74 | 35.91 | 0.9889 | 0.3630 | |||
| INSM / Insmed Incorporated | 0.16 | 11.74 | 0.9886 | 0.9886 | |||||
| AIT / Applied Industrial Technologies, Inc. | 0.05 | 22.08 | 11.69 | 14.21 | 0.9845 | 0.2431 | |||
| MCK / McKesson Corporation | 0.02 | 18.10 | 11.64 | 41.54 | 0.9805 | 0.3847 | |||
| UNM / Unum Group | 0.15 | 29.75 | 11.52 | 32.15 | 0.9705 | 0.3389 | |||
| DASH / DoorDash, Inc. | 0.06 | 23.68 | 11.43 | 26.33 | 0.9628 | 0.3073 | |||
| PRI / Primerica, Inc. | 0.04 | 33.15 | 11.19 | 20.26 | 0.9422 | 0.2683 | |||
| PFGC / Performance Food Group Company | 0.14 | 18.24 | 11.05 | 5.61 | 0.9312 | 0.1728 | |||
| USFD / US Foods Holding Corp. | 0.16 | 23.54 | 10.33 | 14.37 | 0.8704 | 0.2158 | |||
| BRBR / BellRing Brands, Inc. | 0.13 | 22.61 | 10.20 | 22.28 | 0.8595 | 0.2549 | |||
| HLI / Houlihan Lokey, Inc. | 0.06 | 25.12 | 10.01 | 11.60 | 0.8435 | 0.1934 | |||
| Invesco Private Government Fund / STIV (N/A) | 9.93 | 9.93 | 0.8368 | 0.8368 | |||||
| WMB / The Williams Companies, Inc. | 0.17 | 13.88 | 9.76 | 20.34 | 0.8224 | 0.2346 | |||
| WAL / Western Alliance Bancorporation | 0.14 | 19.68 | 9.47 | -5.05 | 0.7977 | 0.0751 | |||
| ICE / Intercontinental Exchange, Inc. | 0.06 | 23.85 | 9.41 | 33.46 | 0.7923 | 0.2416 | |||
| RSG / Republic Services, Inc. | 0.04 | 9.28 | 0.7819 | 0.7819 | |||||
| GE / General Electric Company | 0.05 | 9.24 | 0.7781 | 0.7781 | |||||
| PGR / The Progressive Corporation | 0.03 | 9.18 | 0.7734 | 0.7734 | |||||
| GWRE / Guidewire Software, Inc. | 0.04 | 12.10 | 9.17 | 23.24 | 0.7725 | 0.1910 | |||
| CVLT / Commvault Systems, Inc. | 0.05 | 13.96 | 9.12 | 19.59 | 0.7682 | 0.2157 | |||
| TPL / Texas Pacific Land Corporation | 0.01 | 90.07 | 8.90 | 32.71 | 0.7499 | 0.0722 | |||
| CASY / Casey's General Stores, Inc. | 0.02 | 8.84 | 0.7442 | 0.7442 | |||||
| PH / Parker-Hannifin Corporation | 0.01 | 19.35 | 8.79 | 2.14 | 0.7405 | 0.1169 | |||
| CAH / Cardinal Health, Inc. | 0.06 | 8.79 | 0.7403 | 0.7403 | |||||
| CW / Curtiss-Wright Corporation | 0.03 | 14.57 | 8.74 | 13.89 | 0.7363 | 0.1803 | |||
| AZO / AutoZone, Inc. | 0.00 | 8.44 | 0.7109 | 0.7109 | |||||
| TXRH / Texas Roadhouse, Inc. | 0.05 | 14.98 | 8.28 | 5.37 | 0.6973 | 0.1281 | |||
| MTG / MGIC Investment Corporation | 0.33 | 8.12 | 0.6838 | 0.6838 | |||||
| AMP / Ameriprise Financial, Inc. | 0.02 | 15.62 | 8.09 | 0.24 | 0.6818 | 0.0967 | |||
| BKNG / Booking Holdings Inc. | 0.00 | 8.09 | 0.6812 | 0.6812 | |||||
| ADP / Automatic Data Processing, Inc. | 0.03 | 7.97 | 0.6715 | 0.6715 | |||||
| BSX / Boston Scientific Corporation | 0.08 | 7.96 | 0.6706 | 0.6706 | |||||
| WELL / Welltower Inc. | 0.05 | 7.63 | 0.6431 | 0.6431 | |||||
| RL / Ralph Lauren Corporation | 0.03 | 7.59 | 0.6396 | 0.6396 | |||||
| TOST / Toast, Inc. | 0.21 | 7.59 | 0.6392 | 0.6392 | |||||
| WSM / Williams-Sonoma, Inc. | 0.05 | 18.87 | 7.56 | -13.13 | 0.6369 | 0.0063 | |||
| TPR / Tapestry, Inc. | 0.11 | -26.06 | 7.44 | 21.07 | 0.6264 | 0.0797 | |||
| GRMN / Garmin Ltd. | 0.04 | 8.81 | 7.43 | -5.80 | 0.6257 | 0.0544 | |||
| PANW / Palo Alto Networks, Inc. | 0.04 | 218.10 | 7.38 | 5.94 | 0.6215 | 0.0537 | |||
| MSI / Motorola Solutions, Inc. | 0.02 | 7.31 | 0.6159 | 0.6159 | |||||
| WAB / Westinghouse Air Brake Technologies Corporation | 0.04 | 7.29 | 0.6143 | 0.6143 | |||||
| EXEL / Exelixis, Inc. | 0.19 | 7.28 | 0.6131 | 0.6131 | |||||
| RYAN / Ryan Specialty Holdings, Inc. | 0.11 | 7.28 | 0.6128 | 0.6128 | |||||
| LII / Lennox International Inc. | 0.01 | 12.77 | 7.27 | 4.08 | 0.6120 | 0.1062 | |||
| FAST / Fastenal Company | 0.09 | 7.21 | 0.6075 | 0.6075 | |||||
| AFL / Aflac Incorporated | 0.07 | 7.18 | 0.6049 | 0.6049 | |||||
| ACM / AECOM | 0.07 | 7.11 | 0.5993 | 0.5993 | |||||
| EQH / Equitable Holdings, Inc. | 0.14 | 7.06 | 0.5946 | 0.5946 | |||||
| LNTH / Lantheus Holdings, Inc. | 0.07 | 7.04 | 0.5929 | 0.5929 | |||||
| SYK / Stryker Corporation | 0.02 | 7.04 | 0.5927 | 0.5927 | |||||
| TMHC / Taylor Morrison Home Corporation | 0.12 | 7.01 | 0.5908 | 0.5908 | |||||
| HLT / Hilton Worldwide Holdings Inc. | 0.03 | 7.00 | 0.5892 | 0.5892 | |||||
| AIG / American International Group, Inc. | 0.09 | 6.96 | 0.5861 | 0.5861 | |||||
| MAR / Marriott International, Inc. | 0.03 | 6.93 | 0.5839 | 0.5839 | |||||
| TW / Tradeweb Markets Inc. | 0.05 | 6.79 | 0.5721 | 0.5721 | |||||
| GSCE / GS Connect S&P GSCI Enhanced Commodity Total Return ETN | 0.01 | 6.79 | 0.5717 | 0.5717 | |||||
| RBC / RBC Bearings Incorporated | 0.02 | 6.72 | 0.5661 | 0.5661 | |||||
| IBM / International Business Machines Corporation | 0.03 | 6.72 | 0.5657 | 0.5657 | |||||
| AXP / American Express Company | 0.03 | 6.71 | 0.5656 | 0.5656 | |||||
| CBRE / CBRE Group, Inc. | 0.05 | 6.71 | 0.5651 | 0.5651 | |||||
| RJF / Raymond James Financial, Inc. | 0.05 | 6.64 | 0.5590 | 0.5590 | |||||
| HEI / HEICO Corporation | 0.03 | -73.23 | 6.59 | -42.99 | 0.5552 | -0.0497 | |||
| HALO / Halozyme Therapeutics, Inc. | 0.11 | 6.56 | 0.5523 | 0.5523 | |||||
| SPG / Simon Property Group, Inc. | 0.04 | 6.53 | 0.5503 | 0.5503 | |||||
| PNFP / Pinnacle Financial Partners, Inc. | 0.06 | 6.47 | 0.5452 | 0.5452 | |||||
| PLNT / Planet Fitness, Inc. | 0.07 | -46.97 | 6.46 | -37.91 | 0.5442 | -0.0321 | |||
| WSO / Watsco, Inc. | 0.01 | 6.35 | 0.5353 | 0.5353 | |||||
| SF / Stifel Financial Corp. | 0.07 | 6.33 | 0.5334 | 0.5334 | |||||
| AR / Antero Resources Corporation | 0.17 | -70.02 | 5.80 | -71.52 | 0.4885 | -1.3393 | |||
| US8252528851 / Invesco Government & Agency Portfolio, Institutional Class | 0.69 | -55.84 | 0.69 | -55.84 | 0.0580 | -0.0549 | |||
| NVDA / NVIDIA Corporation | 0.00 | -100.00 | 0.00 | -100.00 | -2.6203 | ||||
| DECK / Deckers Outdoor Corporation | 0.00 | -100.00 | 0.00 | -100.00 | -1.0307 | ||||
| APO / Apollo Global Management, Inc. | 0.00 | -100.00 | 0.00 | -100.00 | -0.9285 | ||||
| TSLA / Tesla, Inc. | 0.00 | -100.00 | 0.00 | -100.00 | -0.5396 | ||||
| DRS / Leonardo DRS, Inc. | 0.00 | -100.00 | 0.00 | -100.00 | -0.7325 | ||||
| GDDY / GoDaddy Inc. | 0.00 | -100.00 | 0.00 | -100.00 | -0.5943 | ||||
| IBKR / Interactive Brokers Group, Inc. | 0.00 | -100.00 | 0.00 | -100.00 | -0.6841 | ||||
| ALSN / Allison Transmission Holdings, Inc. | 0.00 | -100.00 | 0.00 | -100.00 | -0.6367 | ||||
| SOFI / SoFi Technologies, Inc. | 0.00 | -100.00 | 0.00 | -100.00 | -0.5679 | ||||
| 0R1Z / Oracle Corporation | 0.00 | -100.00 | 0.00 | -100.00 | -0.8467 | ||||
| EME / EMCOR Group, Inc. | 0.00 | -100.00 | 0.00 | -100.00 | -0.8250 | ||||
| SPXC / SPX Technologies, Inc. | 0.00 | -100.00 | 0.00 | -100.00 | -0.5691 | ||||
| MLI / Mueller Industries, Inc. | 0.00 | -100.00 | 0.00 | -100.00 | -0.7695 |