Mga Batayang Estadistika
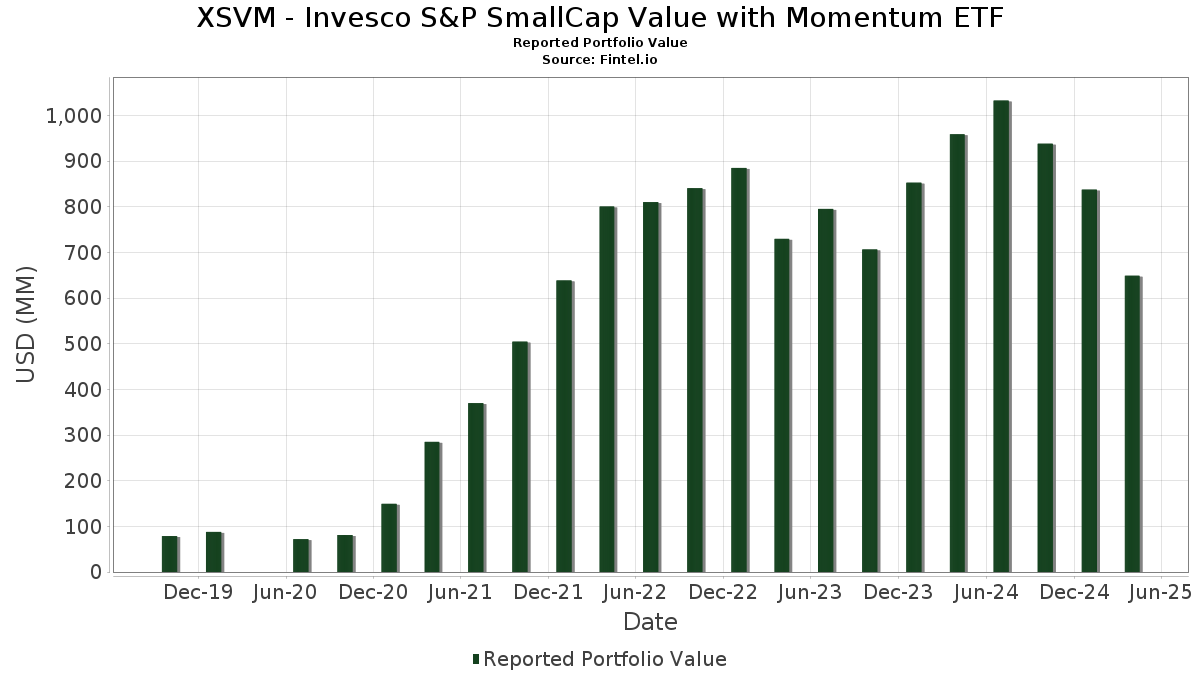
| Nilai Portofolio | $ 649,089,382 |
| Posisi Saat Ini | 121 |
Kepemilikan Terbaru, Kinerja, AUM (dari 13F, 13D)
XSVM - Invesco S&P SmallCap Value with Momentum ETF telah mengungkapkan total kepemilikan 121 dalam pengajuan SEC terbaru mereka. Nilai portofolio terbaru dihitung sebesar $ 649,089,382 USD. Aset yang Dikelola (AUM) sebenarnya adalah nilai ini ditambah kas (yang tidak diungkapkan). Aset-aset utama XSVM - Invesco S&P SmallCap Value with Momentum ETF adalah StoneX Group Inc. (US:SNEX) , EZCORP, Inc. (US:EZPW) , World Fuel Services Corp. (US:INT) , Fresh Del Monte Produce Inc. (US:FDP) , and Lincoln National Corporation (US:LNC) . Posisi baru XSVM - Invesco S&P SmallCap Value with Momentum ETF meliputi: Easterly Government Properties, Inc. (US:DEA) , .
Peningkatan Tertinggi Kuartal Ini
Kami menggunakan perubahan dalam alokasi portofolio karena ini adalah metrik yang paling bermakna. Perubahan dapat disebabkan oleh perdagangan atau perubahan harga saham.
| Keamanan | Saham (MM) |
Nilai (Juta Dolar AS) |
Portfolio % | ΔPorsyento ng Portfolio |
|---|---|---|---|---|
| 54.11 | 54.11 | 9.4233 | 9.4233 | |
| 20.80 | 20.80 | 3.6225 | 3.6225 | |
| 0.67 | 11.02 | 1.9196 | 0.7139 | |
| 0.14 | 12.47 | 2.1717 | 0.6302 | |
| 0.16 | 3.24 | 0.5644 | 0.5644 | |
| 0.26 | 8.80 | 1.5321 | 0.3573 | |
| 0.45 | 7.60 | 1.3239 | 0.3432 | |
| 0.15 | 8.50 | 1.4796 | 0.3264 | |
| 0.05 | 5.97 | 1.0394 | 0.2618 | |
| 0.15 | 6.12 | 1.0660 | 0.2575 |
Penurunan Tertinggi Kuartal Ini
Kami menggunakan perubahan dalam alokasi portofolio karena ini adalah metrik yang paling bermakna. Perubahan dapat disebabkan oleh perdagangan atau perubahan harga saham.
| Keamanan | Saham (MM) |
Nilai (Juta Dolar AS) |
Portfolio % | ΔPorsyento ng Portfolio |
|---|---|---|---|---|
| 0.00 | 0.00 | -1.0191 | ||
| 0.00 | 0.00 | -0.7967 | ||
| 0.27 | 3.91 | 0.6808 | -0.2561 | |
| 0.09 | 3.94 | 0.6867 | -0.2339 | |
| 0.03 | 7.05 | 1.2280 | -0.2148 | |
| 0.10 | 1.83 | 0.3180 | -0.2133 | |
| 0.84 | 3.67 | 0.6398 | -0.1939 | |
| 0.76 | 5.24 | 0.9118 | -0.1867 | |
| 0.42 | 3.90 | 0.6787 | -0.1842 | |
| 0.09 | 4.84 | 0.8435 | -0.1789 |
Pengajuan 13F dan Dana
Formulir ini diajukan pada 2025-06-27 untuk periode pelaporan 2025-04-30. Klik ikon tautan untuk melihat riwayat transaksi selengkapnya.
Tingkatkan ke versi premium untuk membuka data premium dan ekspor ke Excel. ![]() .
.
| Keamanan | Ketik | Harga Saham Rata-rata | Saham (MM) |
ΔSaham (%) |
ΔSaham (%) |
Nilai ($MM) |
Portpolyo (%) |
ΔPortofolio (%) |
|
|---|---|---|---|---|---|---|---|---|---|
| Invesco Private Prime Fund / STIV (N/A) | 54.11 | 54.11 | 9.4233 | 9.4233 | |||||
| Invesco Private Government Fund / STIV (N/A) | 20.80 | 20.80 | 3.6225 | 3.6225 | |||||
| SNEX / StoneX Group Inc. | 0.14 | 31.59 | 12.47 | 6.41 | 2.1717 | 0.6302 | |||
| EZPW / EZCORP, Inc. | 0.67 | -11.77 | 11.02 | 20.26 | 1.9196 | 0.7139 | |||
| INT / World Fuel Services Corp. | 0.43 | -12.22 | 10.80 | -22.09 | 1.8806 | 0.0574 | |||
| FDP / Fresh Del Monte Produce Inc. | 0.26 | -11.69 | 8.80 | -1.50 | 1.5321 | 0.3573 | |||
| LNC / Lincoln National Corporation | 0.28 | -12.26 | 8.78 | -20.47 | 1.5296 | 0.0769 | |||
| SAH / Sonic Automotive, Inc. | 0.14 | -11.80 | 8.70 | -27.87 | 1.5150 | -0.0715 | |||
| UVV / Universal Corporation | 0.15 | -11.66 | 8.50 | -3.10 | 1.4796 | 0.3264 | |||
| GPI / Group 1 Automotive, Inc. | 0.02 | -11.87 | 8.01 | -22.07 | 1.3956 | 0.0429 | |||
| SEM / Select Medical Holdings Corporation | 0.42 | -12.24 | 7.69 | -18.62 | 1.3391 | 0.0962 | |||
| SPNT / SiriusPoint Ltd. | 0.45 | -11.63 | 7.60 | 1.96 | 1.3239 | 0.3432 | |||
| SITC / SITE Centers Corp. | 0.62 | -10.96 | 7.38 | -29.62 | 1.2860 | -0.0942 | |||
| GIII / G-III Apparel Group, Ltd. | 0.28 | -11.67 | 7.13 | -28.65 | 1.2426 | -0.0727 | |||
| PRAA / PRA Group, Inc. | 0.39 | -11.61 | 7.11 | -26.85 | 1.2379 | -0.0402 | |||
| ABG / Asbury Automotive Group, Inc. | 0.03 | -12.57 | 7.05 | -35.71 | 1.2280 | -0.2148 | |||
| AGO / Assured Guaranty Ltd. | 0.08 | -12.25 | 7.01 | -18.63 | 1.2208 | 0.0877 | |||
| PMT / PennyMac Mortgage Investment Trust | 0.54 | -12.31 | 6.99 | -17.22 | 1.2182 | 0.1068 | |||
| EFC / Ellington Financial Inc. | 0.54 | -12.30 | 6.97 | -9.00 | 1.2144 | 0.2063 | |||
| AL / Air Lease Corporation | 0.15 | -12.05 | 6.88 | -10.99 | 1.1989 | 0.1816 | |||
| ARR / ARMOUR Residential REIT, Inc. | 0.37 | -12.11 | 6.15 | -23.08 | 1.0705 | 0.0193 | |||
| AVA / Avista Corporation | 0.15 | -12.06 | 6.12 | -0.42 | 1.0660 | 0.2575 | |||
| COOP / Mr. Cooper Group Inc. | 0.05 | -11.93 | 5.97 | 0.96 | 1.0394 | 0.2618 | |||
| RWT / Redwood Trust, Inc. | 0.93 | -12.57 | 5.78 | -17.10 | 1.0070 | 0.0894 | |||
| CHEF / The Chefs' Warehouse, Inc. | 0.10 | -12.57 | 5.78 | -7.52 | 1.0069 | 0.1845 | |||
| SAFE / Safehold Inc. | 0.36 | -12.03 | 5.75 | -14.53 | 1.0008 | 0.1164 | |||
| PSMT / PriceSmart, Inc. | 0.06 | -12.57 | 5.60 | -2.46 | 0.9748 | 0.2200 | |||
| MDU / MDU Resources Group, Inc. | 0.33 | -12.57 | 5.58 | -15.90 | 0.9726 | 0.0991 | |||
| EIG / Employers Holdings, Inc. | 0.11 | -12.02 | 5.51 | -13.04 | 0.9591 | 0.1260 | |||
| HMN / Horace Mann Educators Corporation | 0.13 | -12.05 | 5.44 | -5.43 | 0.9470 | 0.1907 | |||
| RNST / Renasant Corporation | 0.17 | -12.76 | 5.38 | -28.05 | 0.9371 | -0.0465 | |||
| RDN / Radian Group Inc. | 0.17 | -12.59 | 5.34 | -17.92 | 0.9298 | 0.0741 | |||
| ABM / ABM Industries Incorporated | 0.11 | -12.59 | 5.29 | -20.17 | 0.9212 | 0.0497 | |||
| HSC / Enviri Corp | 0.76 | -12.58 | 5.24 | -37.31 | 0.9118 | -0.1867 | |||
| SANM / Sanmina Corporation | 0.07 | -12.53 | 5.23 | -19.79 | 0.9102 | 0.0532 | |||
| FBRT / Franklin BSP Realty Trust, Inc. | 0.45 | -12.58 | 5.11 | -21.85 | 0.8903 | 0.0299 | |||
| DXPE / DXP Enterprises, Inc. | 0.06 | -12.88 | 5.11 | -23.92 | 0.8892 | 0.0065 | |||
| ADS / Bread Financial Holdings Inc | 0.11 | -12.12 | 5.10 | -34.16 | 0.8887 | -0.1307 | |||
| TPH / Tri Pointe Homes, Inc. | 0.16 | -12.55 | 5.01 | -27.04 | 0.8720 | -0.0308 | |||
| KALU / Kaiser Aluminum Corporation | 0.08 | -12.59 | 4.96 | -19.51 | 0.8630 | 0.0532 | |||
| CAL / Caleres, Inc. | 0.32 | -12.07 | 4.94 | -26.90 | 0.8597 | -0.0285 | |||
| HOPE / Hope Bancorp, Inc. | 0.49 | -12.57 | 4.89 | -25.25 | 0.8522 | -0.0088 | |||
| CCS / Century Communities, Inc. | 0.09 | -12.73 | 4.84 | -37.69 | 0.8435 | -0.1789 | |||
| BRKL / Brookline Bancorp, Inc. | 0.46 | -12.56 | 4.83 | -25.36 | 0.8416 | -0.0101 | |||
| SCSC / ScanSource, Inc. | 0.15 | -12.10 | 4.79 | -30.71 | 0.8344 | -0.0752 | |||
| VTOL / Bristow Group Inc. | 0.16 | -12.55 | 4.77 | -23.89 | 0.8306 | 0.0063 | |||
| HAFC / Hanmi Financial Corporation | 0.21 | -12.57 | 4.75 | -16.77 | 0.8274 | 0.0767 | |||
| ETD / Ethan Allen Interiors Inc. | 0.17 | -12.58 | 4.74 | -19.89 | 0.8251 | 0.0472 | |||
| MTH / Meritage Homes Corporation | 0.07 | -12.60 | 4.69 | -23.52 | 0.8162 | 0.0101 | |||
| NMIH / NMI Holdings, Inc. | 0.13 | -12.56 | 4.67 | -18.11 | 0.8129 | 0.0632 | |||
| SBH / Sally Beauty Holdings, Inc. | 0.57 | -12.57 | 4.62 | -34.53 | 0.8051 | -0.1237 | |||
| TRMK / Trustmark Corporation | 0.13 | -11.98 | 4.50 | -21.26 | 0.7832 | 0.0320 | |||
| OGN / Organon & Co. | 0.35 | -12.58 | 4.47 | -27.35 | 0.7792 | -0.0309 | |||
| STC / Stewart Information Services Corporation | 0.07 | -12.60 | 4.47 | -12.22 | 0.7783 | 0.1087 | |||
| STEL / Stellar Bancorp, Inc. | 0.18 | -12.58 | 4.44 | -23.17 | 0.7727 | 0.0131 | |||
| TRST / TrustCo Bank Corp NY | 0.14 | -12.60 | 4.40 | -17.25 | 0.7655 | 0.0668 | |||
| INDB / Independent Bank Corp. | 0.07 | -12.51 | 4.38 | -23.02 | 0.7623 | 0.0143 | |||
| MCY / Mercury General Corporation | 0.08 | -12.11 | 4.36 | -2.26 | 0.7599 | 0.1726 | |||
| ABR / Arbor Realty Trust, Inc. | 0.38 | -12.56 | 4.35 | -24.71 | 0.7578 | -0.0024 | |||
| SFNC / Simmons First National Corporation | 0.23 | -12.56 | 4.34 | -28.18 | 0.7559 | -0.0391 | |||
| STBA / S&T Bancorp, Inc. | 0.12 | -12.57 | 4.33 | -19.22 | 0.7539 | 0.0490 | |||
| RUSHA / Rush Enterprises, Inc. | 0.08 | -12.04 | 4.33 | -26.18 | 0.7534 | -0.0173 | |||
| HFWA / Heritage Financial Corporation | 0.19 | -12.58 | 4.31 | -22.39 | 0.7499 | 0.0202 | |||
| BJRI / BJ's Restaurants, Inc. | 0.13 | -12.56 | 4.26 | -19.56 | 0.7421 | 0.0453 | |||
| LZB / La-Z-Boy Incorporated | 0.11 | -12.02 | 4.26 | -26.38 | 0.7418 | -0.0192 | |||
| US71880K1016 / Phinia Inc | 0.11 | -12.90 | 4.24 | -31.29 | 0.7387 | -0.0732 | |||
| CNXN / PC Connection, Inc. | 0.07 | -12.60 | 4.18 | -26.94 | 0.7283 | -0.0247 | |||
| GRBK / Green Brick Partners, Inc. | 0.07 | -12.53 | 4.16 | -14.68 | 0.7250 | 0.0833 | |||
| WSFS / WSFS Financial Corporation | 0.08 | -11.86 | 4.15 | -18.86 | 0.7223 | 0.0499 | |||
| FFBC / First Financial Bancorp. | 0.18 | -12.58 | 4.14 | -27.78 | 0.7213 | -0.0330 | |||
| WAFD / WaFd, Inc | 0.14 | -12.55 | 4.10 | -15.94 | 0.7139 | 0.0724 | |||
| OFG / OFG Bancorp | 0.10 | -12.57 | 4.08 | -19.44 | 0.7111 | 0.0444 | |||
| NWBI / Northwest Bancshares, Inc. | 0.33 | -12.57 | 4.08 | -18.27 | 0.7100 | 0.0539 | |||
| ABCB / Ameris Bancorp | 0.07 | -11.09 | 4.04 | -20.65 | 0.7036 | 0.0340 | |||
| SIG / Signet Jewelers Limited | 0.07 | -12.55 | 4.02 | -12.46 | 0.7001 | 0.0961 | |||
| BKU / BankUnited, Inc. | 0.12 | -11.98 | 4.01 | -29.96 | 0.6982 | -0.0548 | |||
| PFS / Provident Financial Services, Inc. | 0.24 | -12.56 | 4.01 | -22.92 | 0.6981 | 0.0140 | |||
| VBTX / Veritex Holdings, Inc. | 0.17 | -12.60 | 3.99 | -24.08 | 0.6947 | 0.0035 | |||
| MHO / M/I Homes, Inc. | 0.04 | -12.51 | 3.97 | -25.82 | 0.6911 | -0.0125 | |||
| JBGS / JBG SMITH Properties | 0.28 | -12.55 | 3.95 | -21.19 | 0.6880 | 0.0287 | |||
| AMWD / American Woodmark Corporation | 0.07 | -12.51 | 3.95 | -33.70 | 0.6872 | -0.0957 | |||
| GBX / The Greenbrier Companies, Inc. | 0.09 | -11.99 | 3.94 | -43.66 | 0.6867 | -0.2339 | |||
| MBC / MasterBrand, Inc. | 0.32 | -12.57 | 3.94 | -38.67 | 0.6863 | -0.1589 | |||
| CENX / Century Aluminum Company | 0.24 | -12.58 | 3.91 | -21.52 | 0.6813 | 0.0256 | |||
| HSII / Heidrick & Struggles International, Inc. | 0.10 | -11.96 | 3.91 | -26.10 | 0.6810 | -0.0151 | |||
| DLX / Deluxe Corporation | 0.27 | -12.82 | 3.91 | -45.11 | 0.6808 | -0.2561 | |||
| CWK / Cushman & Wakefield plc | 0.42 | -12.57 | 3.90 | -40.59 | 0.6787 | -0.1842 | |||
| FCF / First Commonwealth Financial Corporation | 0.25 | -12.56 | 3.89 | -19.69 | 0.6776 | 0.0403 | |||
| PFBC / Preferred Bank | 0.05 | -11.99 | 3.87 | -23.08 | 0.6736 | 0.0123 | |||
| CATY / Cathay General Bancorp | 0.09 | -12.58 | 3.83 | -23.26 | 0.6679 | 0.0106 | |||
| FHB / First Hawaiian, Inc. | 0.17 | -11.06 | 3.81 | -26.39 | 0.6633 | -0.0173 | |||
| FULT / Fulton Financial Corporation | 0.23 | -12.58 | 3.81 | -28.32 | 0.6632 | -0.0355 | |||
| SBSI / Southside Bancshares, Inc. | 0.13 | -12.57 | 3.80 | -21.58 | 0.6625 | 0.0244 | |||
| DFH / Dream Finders Homes, Inc. | 0.17 | -12.59 | 3.79 | -14.15 | 0.6595 | 0.0793 | |||
| PATK / Patrick Industries, Inc. | 0.05 | -12.51 | 3.78 | -30.67 | 0.6584 | -0.0589 | |||
| WABC / Westamerica Bancorporation | 0.08 | -12.59 | 3.78 | -18.22 | 0.6584 | 0.0504 | |||
| REZI / Resideo Technologies, Inc. | 0.22 | -12.56 | 3.76 | -34.85 | 0.6544 | -0.1043 | |||
| SBCF / Seacoast Banking Corporation of Florida | 0.16 | -12.55 | 3.70 | -27.12 | 0.6440 | -0.0234 | |||
| JBLU / JetBlue Airways Corporation | 0.84 | -12.52 | 3.67 | -42.05 | 0.6398 | -0.1939 | |||
| BHE / Benchmark Electronics, Inc. | 0.11 | -11.97 | 3.67 | -32.88 | 0.6398 | -0.0801 | |||
| GMS / GMS Inc. | 0.05 | -12.51 | 3.67 | -24.02 | 0.6388 | 0.0039 | |||
| UCBI / United Community Banks, Inc. | 0.13 | -12.56 | 3.64 | -27.21 | 0.6345 | -0.0239 | |||
| TTMI / TTM Technologies, Inc. | 0.18 | -10.92 | 3.61 | -27.47 | 0.6285 | -0.0260 | |||
| SHO / Sunstone Hotel Investors, Inc. | 0.43 | -12.60 | 3.59 | -35.66 | 0.6251 | -0.1088 | |||
| HCC / Warrior Met Coal, Inc. | 0.07 | -12.60 | 3.58 | -20.80 | 0.6227 | 0.0289 | |||
| BHLB / Berkshire Hills Bancorp, Inc. | 0.14 | -12.60 | 3.56 | -26.21 | 0.6193 | -0.0146 | |||
| NBHC / National Bank Holdings Corporation | 0.09 | -12.58 | 3.43 | -26.70 | 0.5981 | -0.0182 | |||
| MATX / Matson, Inc. | 0.03 | -12.50 | 3.35 | -32.70 | 0.5838 | -0.0715 | |||
| PPBI / Pacific Premier Bancorp, Inc. | 0.16 | -12.55 | 3.31 | -31.33 | 0.5762 | -0.0575 | |||
| DCOM / Dime Community Bancshares, Inc. | 0.13 | -12.56 | 3.26 | -28.06 | 0.5683 | -0.0284 | |||
| DEA / Easterly Government Properties, Inc. | 0.16 | 3.24 | 0.5644 | 0.5644 | |||||
| MTX / Minerals Technologies Inc. | 0.06 | -12.61 | 3.17 | -41.22 | 0.5522 | -0.1573 | |||
| EGBN / Eagle Bancorp, Inc. | 0.18 | -12.58 | 3.16 | -40.13 | 0.5506 | -0.1440 | |||
| AUB / Atlantic Union Bankshares Corporation | 0.11 | -12.56 | 3.12 | -35.88 | 0.5438 | -0.0967 | |||
| XHR / Xenia Hotels & Resorts, Inc. | 0.28 | -12.58 | 3.02 | -37.58 | 0.5262 | -0.1106 | |||
| BCC / Boise Cascade Company | 0.03 | -12.51 | 2.99 | -35.32 | 0.5209 | -0.0873 | |||
| SCVL / Shoe Carnival, Inc. | 0.17 | -12.58 | 2.97 | -43.85 | 0.5171 | -0.1785 | |||
| HUBG / Hub Group, Inc. | 0.09 | -11.88 | 2.94 | -37.61 | 0.5118 | -0.1077 | |||
| PRG / PROG Holdings, Inc. | 0.09 | -12.58 | 2.40 | -46.09 | 0.4180 | -0.1677 | |||
| VSCO / Victoria's Secret & Co. | 0.10 | -12.57 | 1.83 | -54.82 | 0.3180 | -0.2133 | |||
| US8252528851 / Invesco Government & Agency Portfolio, Institutional Class | 0.54 | 59.49 | 0.54 | 59.59 | 0.0942 | 0.0511 | |||
| ALK / Alaska Air Group, Inc. | 0.00 | -100.00 | 0.00 | -100.00 | -1.0191 | ||||
| SATS / EchoStar Corporation | 0.00 | -100.00 | 0.00 | -100.00 | -0.7967 |