Mga Batayang Estadistika
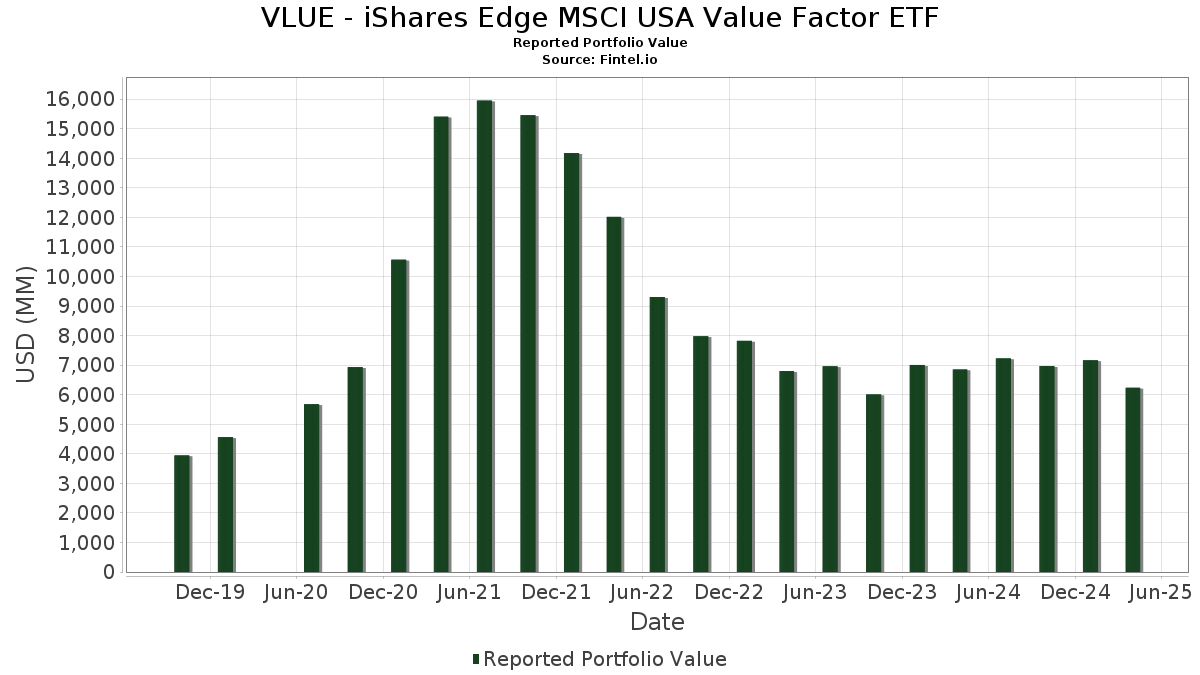
| Nilai Portofolio | $ 6,234,734,756 |
| Posisi Saat Ini | 144 |
Kepemilikan Terbaru, Kinerja, AUM (dari 13F, 13D)
VLUE - iShares Edge MSCI USA Value Factor ETF telah mengungkapkan total kepemilikan 144 dalam pengajuan SEC terbaru mereka. Nilai portofolio terbaru dihitung sebesar $ 6,234,734,756 USD. Aset yang Dikelola (AUM) sebenarnya adalah nilai ini ditambah kas (yang tidak diungkapkan). Aset-aset utama VLUE - iShares Edge MSCI USA Value Factor ETF adalah Cisco Systems, Inc. (US:CSCO) , AT&T Inc. (US:T) , International Business Machines Corporation (US:IBM) , Intel Corporation (US:INTC) , and Verizon Communications Inc. (US:VZ) .
Peningkatan Tertinggi Kuartal Ini
Kami menggunakan perubahan dalam alokasi portofolio karena ini adalah metrik yang paling bermakna. Perubahan dapat disebabkan oleh perdagangan atau perubahan harga saham.
| Keamanan | Saham (MM) |
Nilai (Juta Dolar AS) |
Portfolio % | ΔPorsyento ng Portfolio |
|---|---|---|---|---|
| 12.71 | 352.00 | 5.6577 | 1.2079 | |
| 4.71 | 207.50 | 3.3352 | 0.5977 | |
| 2.05 | 137.04 | 2.2027 | 0.4905 | |
| 11.73 | 235.86 | 3.7910 | 0.4265 | |
| 0.31 | 105.51 | 1.6959 | 0.3488 | |
| 1.14 | 82.10 | 1.3195 | 0.2854 | |
| 7.01 | 404.91 | 6.5082 | 0.2360 | |
| 0.20 | 84.29 | 1.3549 | 0.1846 | |
| 24.76 | 24.77 | 0.3981 | 0.1674 | |
| 12.12 | 121.32 | 1.9501 | 0.1472 |
Penurunan Tertinggi Kuartal Ini
Kami menggunakan perubahan dalam alokasi portofolio karena ini adalah metrik yang paling bermakna. Perubahan dapat disebabkan oleh perdagangan atau perubahan harga saham.
| Keamanan | Saham (MM) |
Nilai (Juta Dolar AS) |
Portfolio % | ΔPorsyento ng Portfolio |
|---|---|---|---|---|
| 4.64 | 75.30 | 1.2103 | -0.2413 | |
| 1.01 | 151.63 | 2.4371 | -0.2404 | |
| 1.80 | 122.96 | 1.9763 | -0.1844 | |
| 0.26 | 25.52 | 0.4102 | -0.1585 | |
| 2.12 | 54.21 | 0.8714 | -0.1454 | |
| 3.43 | 136.67 | 2.1967 | -0.1447 | |
| 0.26 | 55.34 | 0.8896 | -0.1389 | |
| 0.00 | 0.00 | -0.1373 | ||
| 1.90 | 95.55 | 1.5359 | -0.1200 | |
| 1.08 | 83.05 | 1.3348 | -0.1182 |
Pengajuan 13F dan Dana
Formulir ini diajukan pada 2025-06-23 untuk periode pelaporan 2025-04-30. Klik ikon tautan untuk melihat riwayat transaksi selengkapnya.
Tingkatkan ke versi premium untuk membuka data premium dan ekspor ke Excel. ![]() .
.
| Keamanan | Ketik | Harga Saham Rata-rata | Saham (MM) |
ΔSaham (%) |
ΔSaham (%) |
Nilai ($MM) |
Portpolyo (%) |
ΔPortofolio (%) |
|
|---|---|---|---|---|---|---|---|---|---|
| CSCO / Cisco Systems, Inc. | 7.01 | -5.41 | 404.91 | -9.89 | 6.5082 | 0.2360 | |||
| T / AT&T Inc. | 12.71 | -5.41 | 352.00 | 10.42 | 5.6577 | 1.2079 | |||
| IBM / International Business Machines Corporation | 1.22 | -5.41 | 295.28 | -10.54 | 4.7461 | 0.1386 | |||
| INTC / Intel Corporation | 11.73 | -5.41 | 235.86 | -2.15 | 3.7910 | 0.4265 | |||
| VZ / Verizon Communications Inc. | 4.71 | -5.41 | 207.50 | 5.80 | 3.3352 | 0.5977 | |||
| GM / General Motors Company | 4.44 | -5.41 | 200.92 | -13.48 | 3.2294 | -0.0121 | |||
| AMAT / Applied Materials, Inc. | 1.01 | -5.41 | 151.63 | -20.96 | 2.4371 | -0.2404 | |||
| PFE / Pfizer Inc. | 5.72 | -5.41 | 139.69 | -12.94 | 2.2453 | 0.0057 | |||
| CVS / CVS Health Corporation | 2.05 | -5.41 | 137.04 | 11.72 | 2.2027 | 0.4905 | |||
| BAC / Bank of America Corporation | 3.43 | -5.41 | 136.67 | -18.53 | 2.1967 | -0.1447 | |||
| C / Citigroup Inc. | 1.80 | -5.41 | 122.96 | -20.57 | 1.9763 | -0.1844 | |||
| F / Ford Motor Company | 12.12 | -5.41 | 121.32 | -6.07 | 1.9501 | 0.1472 | |||
| RTX / RTX Corporation | 0.92 | -5.41 | 115.51 | -7.48 | 1.8566 | 0.1140 | |||
| WFC / Wells Fargo & Company | 1.62 | -5.41 | 114.68 | -14.76 | 1.8433 | -0.0347 | |||
| CI / The Cigna Group | 0.31 | -5.41 | 105.51 | 9.33 | 1.6959 | 0.3488 | |||
| BMY / Bristol-Myers Squibb Company | 1.90 | -5.41 | 95.55 | -19.45 | 1.5359 | -0.1200 | |||
| ELV / Elevance Health, Inc. | 0.20 | -5.41 | 84.29 | 0.54 | 1.3549 | 0.1846 | |||
| MU / Micron Technology, Inc. | 1.08 | -5.41 | 83.05 | -20.22 | 1.3348 | -0.1182 | |||
| KR / The Kroger Co. | 1.14 | -5.41 | 82.10 | 10.81 | 1.3195 | 0.2854 | |||
| GS / The Goldman Sachs Group, Inc. | 0.14 | -5.41 | 78.86 | -19.12 | 1.2676 | -0.0935 | |||
| DHI / D.R. Horton, Inc. | 0.62 | -5.41 | 77.79 | -15.78 | 1.2503 | -0.0390 | |||
| HPE / Hewlett Packard Enterprise Company | 4.64 | -5.41 | 75.30 | -27.60 | 1.2103 | -0.2413 | |||
| CMCSA / Comcast Corporation | 2.14 | -5.41 | 73.17 | -3.89 | 1.1760 | 0.1134 | |||
| CTSH / Cognizant Technology Solutions Corporation | 0.97 | -5.41 | 71.33 | -15.76 | 1.1466 | -0.0354 | |||
| TEL / TE Connectivity plc | 0.48 | -5.41 | 70.91 | -6.43 | 1.1398 | 0.0820 | |||
| LEN / Lennar Corporation | 0.61 | -5.41 | 66.78 | -21.72 | 1.0734 | -0.1174 | |||
| SPG / Simon Property Group, Inc. | 0.42 | -5.41 | 66.73 | -14.38 | 1.0726 | -0.0153 | |||
| KHC / The Kraft Heinz Company | 2.27 | -5.41 | 65.94 | -7.76 | 1.0599 | 0.0621 | |||
| NXPI / NXP Semiconductors N.V. | 0.35 | -5.41 | 63.91 | -16.40 | 1.0272 | -0.0399 | |||
| GLW / Corning Incorporated | 1.43 | -5.41 | 63.29 | -19.40 | 1.0173 | -0.0787 | |||
| FDX / FedEx Corporation | 0.26 | -5.41 | 55.34 | -24.89 | 0.8896 | -0.1389 | |||
| HPQ / HP Inc. | 2.12 | -5.41 | 54.21 | -25.58 | 0.8714 | -0.1454 | |||
| ADM / Archer-Daniels-Midland Company | 1.12 | -5.41 | 53.31 | -11.84 | 0.8569 | 0.0129 | |||
| CNC / Centene Corporation | 0.85 | -5.41 | 50.82 | -11.59 | 0.8168 | 0.0145 | |||
| PHM / PulteGroup, Inc. | 0.48 | -5.40 | 49.73 | -14.72 | 0.7993 | -0.0146 | |||
| PCAR / PACCAR Inc | 0.49 | -5.40 | 44.02 | -23.04 | 0.7075 | -0.0908 | |||
| DELL / Dell Technologies Inc. | 0.46 | -5.36 | 42.11 | -16.18 | 0.6768 | -0.0244 | |||
| VLO / Valero Energy Corporation | 0.35 | -5.40 | 40.77 | -17.43 | 0.6554 | -0.0339 | |||
| COF / Capital One Financial Corporation | 0.22 | -5.38 | 39.21 | -16.27 | 0.6303 | -0.0234 | |||
| ZM / Zoom Communications Inc. | 0.48 | -5.36 | 37.57 | -15.59 | 0.6038 | -0.0174 | |||
| JCI / Johnson Controls International plc | 0.43 | -5.37 | 35.78 | 1.79 | 0.5752 | 0.0844 | |||
| TSN / Tyson Foods, Inc. | 0.57 | -5.39 | 34.82 | 2.57 | 0.5597 | 0.0858 | |||
| CMI / Cummins Inc. | 0.11 | -5.34 | 33.37 | -21.92 | 0.5364 | -0.0602 | |||
| URI / United Rentals, Inc. | 0.05 | -5.39 | 32.72 | -21.19 | 0.5259 | -0.0536 | |||
| AIG / American International Group, Inc. | 0.39 | -5.37 | 32.08 | 4.73 | 0.5156 | 0.0881 | |||
| TAP / Molson Coors Beverage Company | 0.56 | -5.51 | 32.02 | -0.71 | 0.5147 | 0.0645 | |||
| TFC / Truist Financial Corporation | 0.81 | -5.47 | 31.18 | -23.89 | 0.5012 | -0.0707 | |||
| VST / Vistra Corp. | 0.24 | -5.33 | 30.88 | -26.96 | 0.4963 | -0.0938 | |||
| LHX / L3Harris Technologies, Inc. | 0.14 | -5.34 | 30.12 | -1.76 | 0.4841 | 0.0561 | |||
| EXPE / Expedia Group, Inc. | 0.19 | -5.36 | 29.48 | -13.12 | 0.4738 | 0.0002 | |||
| NUE / Nucor Corporation | 0.24 | -5.34 | 29.18 | -12.02 | 0.4690 | 0.0061 | |||
| FANG / Diamondback Energy, Inc. | 0.22 | -5.34 | 28.68 | -23.97 | 0.4610 | -0.0656 | |||
| ON / ON Semiconductor Corporation | 0.70 | -5.25 | 27.81 | -28.13 | 0.4470 | -0.0931 | |||
| BK / The Bank of New York Mellon Corporation | 0.35 | -5.35 | 27.75 | -11.43 | 0.4460 | 0.0087 | |||
| MET / MetLife, Inc. | 0.37 | -5.10 | 27.71 | -17.32 | 0.4454 | -0.0224 | |||
| WBD / Warner Bros. Discovery, Inc. | 3.16 | -5.35 | 27.41 | -21.40 | 0.4406 | -0.0462 | |||
| USB / U.S. Bancorp | 0.67 | -5.29 | 27.10 | -20.04 | 0.4356 | -0.0375 | |||
| FFIV / F5, Inc. | 0.10 | -5.14 | 27.01 | -15.52 | 0.4342 | -0.0121 | |||
| EQT / EQT Corporation | 0.54 | -5.11 | 26.88 | -8.22 | 0.4320 | 0.0232 | |||
| WBA / Walgreens Boots Alliance, Inc. | 2.43 | -5.30 | 26.70 | 1.05 | 0.4291 | 0.0603 | |||
| JBL / Jabil Inc. | 0.18 | -5.34 | 26.65 | -14.58 | 0.4284 | -0.0071 | |||
| PRU / Prudential Financial, Inc. | 0.26 | -5.34 | 26.28 | -19.49 | 0.4224 | -0.0332 | |||
| NTAP / NetApp, Inc. | 0.29 | -5.26 | 26.24 | -30.36 | 0.4218 | -0.1042 | |||
| GEN / Gen Digital Inc. | 1.00 | -5.30 | 25.86 | -8.96 | 0.4157 | 0.0192 | |||
| TWLO / Twilio Inc. | 0.26 | -5.06 | 25.52 | -37.36 | 0.4102 | -0.1585 | |||
| PCG / PG&E Corporation | 1.54 | -5.29 | 25.41 | -0.03 | 0.4085 | 0.0537 | |||
| SWKS / Skyworks Solutions, Inc. | 0.39 | -5.47 | 25.33 | -31.54 | 0.4071 | -0.1093 | |||
| US0669225197 / BlackRock Cash Funds: Institutional, SL Agency Shares | 24.76 | 49.87 | 24.77 | 49.86 | 0.3981 | 0.1674 | |||
| D / Dominion Energy, Inc. | 0.46 | -5.55 | 24.75 | -7.60 | 0.3978 | 0.0239 | |||
| BG / Bunge Global SA | 0.31 | -5.52 | 24.16 | -2.31 | 0.3883 | 0.0431 | |||
| WY / Weyerhaeuser Company | 0.93 | -5.31 | 23.98 | -19.87 | 0.3854 | -0.0323 | |||
| COG / Cabot Oil & Gas Corp. | 0.95 | -5.31 | 23.30 | -16.10 | 0.3745 | -0.0132 | |||
| JNPR / Juniper Networks, Inc. | 0.61 | -5.52 | 22.15 | -1.56 | 0.3560 | 0.0419 | |||
| FSLR / First Solar, Inc. | 0.17 | -5.45 | 21.47 | -28.98 | 0.3450 | -0.0769 | |||
| SJM / The J. M. Smucker Company | 0.18 | -5.06 | 21.35 | 3.26 | 0.3432 | 0.0546 | |||
| VTRS / Viatris Inc. | 2.48 | -5.26 | 20.92 | -29.28 | 0.3362 | -0.0766 | |||
| CAG / Conagra Brands, Inc. | 0.84 | -5.58 | 20.72 | -9.89 | 0.3330 | 0.0121 | |||
| APTV / Aptiv PLC | 0.36 | -5.19 | 20.70 | -13.33 | 0.3328 | -0.0007 | |||
| EXE / Expand Energy Corporation | 0.20 | -5.25 | 20.52 | -3.10 | 0.3298 | 0.0342 | |||
| ATO / Atmos Energy Corporation | 0.12 | -5.58 | 19.44 | 6.43 | 0.3125 | 0.0575 | |||
| RPRX / Royalty Pharma plc | 0.59 | -6.33 | 19.31 | -2.65 | 0.3104 | 0.0335 | |||
| STLD / Steel Dynamics, Inc. | 0.15 | -5.06 | 18.95 | -3.94 | 0.3047 | 0.0292 | |||
| LKQ / LKQ Corporation | 0.49 | -5.44 | 18.85 | -3.37 | 0.3029 | 0.0307 | |||
| BBY / Best Buy Co., Inc. | 0.28 | -5.36 | 18.81 | -26.49 | 0.3024 | -0.0549 | |||
| WAB / Westinghouse Air Brake Technologies Corporation | 0.10 | -5.01 | 18.11 | -15.60 | 0.2911 | -0.0084 | |||
| OVV / Ovintiv Inc. | 0.52 | -5.35 | 17.62 | -24.71 | 0.2831 | -0.0435 | |||
| OC / Owens Corning | 0.12 | -4.96 | 17.52 | -25.12 | 0.2815 | -0.0450 | |||
| HST / Host Hotels & Resorts, Inc. | 1.23 | -5.34 | 17.41 | -20.01 | 0.2799 | -0.0240 | |||
| MAA / Mid-America Apartment Communities, Inc. | 0.11 | -5.64 | 17.41 | -1.27 | 0.2798 | 0.0337 | |||
| FOXA / Fox Corporation | 0.33 | -5.35 | 16.48 | -7.91 | 0.2649 | 0.0151 | |||
| SSNC / SS&C Technologies Holdings, Inc. | 0.22 | -5.39 | 16.47 | -11.64 | 0.2647 | 0.0045 | |||
| PPL / PPL Corporation | 0.45 | -5.63 | 16.43 | 2.51 | 0.2642 | 0.0404 | |||
| LH / Labcorp Holdings Inc. | 0.07 | -5.56 | 16.10 | -8.88 | 0.2588 | 0.0121 | |||
| EVRG / Evergy, Inc. | 0.22 | -5.56 | 15.54 | 1.69 | 0.2498 | 0.0365 | |||
| HIG / The Hartford Insurance Group, Inc. | 0.12 | -5.74 | 15.21 | 3.65 | 0.2444 | 0.0396 | |||
| STT / State Street Corporation | 0.17 | -5.85 | 15.10 | -18.38 | 0.2427 | -0.0155 | |||
| TXT / Textron Inc. | 0.21 | -5.66 | 14.61 | -13.23 | 0.2348 | -0.0002 | |||
| WDC / Western Digital Corporation | 0.33 | -5.23 | 14.42 | -36.18 | 0.2318 | -0.0836 | |||
| MTB / M&T Bank Corporation | 0.08 | -5.34 | 14.39 | -20.15 | 0.2314 | -0.0202 | |||
| DGX / Quest Diagnostics Incorporated | 0.08 | -5.49 | 14.26 | 3.27 | 0.2293 | 0.0365 | |||
| SW / Smurfit Westrock Plc | 0.34 | -5.17 | 14.24 | -24.95 | 0.2289 | -0.0359 | |||
| BLDR / Builders FirstSource, Inc. | 0.12 | -5.29 | 13.96 | -32.27 | 0.2244 | -0.0633 | |||
| ACI / Albertsons Companies, Inc. | 0.63 | -5.51 | 13.91 | 3.58 | 0.2236 | 0.0361 | |||
| DOW / Dow Inc. | 0.45 | -4.97 | 13.70 | -25.56 | 0.2203 | -0.0367 | |||
| EG / Everest Group, Ltd. | 0.04 | -6.32 | 13.69 | -3.26 | 0.2200 | 0.0225 | |||
| AKAM / Akamai Technologies, Inc. | 0.17 | -5.70 | 13.66 | -23.94 | 0.2196 | -0.0311 | |||
| LYB / LyondellBasell Industries N.V. | 0.23 | -4.85 | 13.64 | -26.83 | 0.2192 | -0.0410 | |||
| SNA / Snap-on Incorporated | 0.04 | -5.53 | 13.31 | -16.53 | 0.2139 | -0.0086 | |||
| CNH / CNH Industrial N.V. | 1.12 | -5.51 | 12.98 | -15.13 | 0.2087 | -0.0048 | |||
| ES / Eversource Energy | 0.22 | -5.87 | 12.94 | -2.93 | 0.2080 | 0.0219 | |||
| UTHR / United Therapeutics Corporation | 0.04 | -5.53 | 12.42 | -18.47 | 0.1996 | -0.0130 | |||
| CFG / Citizens Financial Group, Inc. | 0.34 | -5.35 | 12.41 | -26.60 | 0.1994 | -0.0365 | |||
| DVN / Devon Energy Corporation | 0.39 | -6.00 | 11.79 | -16.18 | 0.1895 | -0.0068 | |||
| SYF / Synchrony Financial | 0.23 | -5.27 | 11.72 | -28.66 | 0.1884 | -0.0409 | |||
| GPN / Global Payments Inc. | 0.15 | -5.54 | 11.59 | -36.13 | 0.1862 | -0.0670 | |||
| CPT / Camden Property Trust | 0.10 | -5.72 | 11.27 | -5.65 | 0.1812 | 0.0144 | |||
| DAL / Delta Air Lines, Inc. | 0.26 | -5.83 | 11.02 | -41.73 | 0.1772 | -0.0869 | |||
| CF / CF Industries Holdings, Inc. | 0.14 | -5.42 | 10.78 | -19.61 | 0.1733 | -0.0139 | |||
| UHS / Universal Health Services, Inc. | 0.06 | -6.30 | 10.76 | -12.01 | 0.1729 | 0.0022 | |||
| LDOS / Leidos Holdings, Inc. | 0.07 | -6.19 | 10.16 | -2.78 | 0.1633 | 0.0174 | |||
| HBAN / Huntington Bancshares Incorporated | 0.69 | -5.32 | 10.06 | -20.02 | 0.1618 | -0.0139 | |||
| FITB / Fifth Third Bancorp | 0.28 | -5.30 | 9.90 | -23.19 | 0.1592 | -0.0208 | |||
| RF / Regions Financial Corporation | 0.48 | -6.34 | 9.78 | -22.43 | 0.1572 | -0.0188 | |||
| L / Loews Corporation | 0.11 | -5.53 | 9.76 | -4.00 | 0.1569 | 0.0150 | |||
| FOX / Fox Corporation | 0.20 | -5.35 | 9.38 | -9.94 | 0.1508 | 0.0054 | |||
| SOLV / Solventum Corporation | 0.14 | -5.80 | 9.21 | -15.89 | 0.1480 | -0.0048 | |||
| US0669224778 / BlackRock Cash Funds: Treasury, SL Agency Shares | 8.39 | -41.54 | 8.39 | -41.54 | 0.1348 | -0.0654 | |||
| NLY / Annaly Capital Management, Inc. | 0.42 | -5.39 | 8.32 | -9.15 | 0.1337 | 0.0059 | |||
| FCNCA / First Citizens BancShares, Inc. | 0.00 | -5.48 | 8.20 | -23.72 | 0.1317 | -0.0182 | |||
| SWK / Stanley Black & Decker, Inc. | 0.12 | -5.73 | 7.43 | -35.76 | 0.1194 | -0.0420 | |||
| EQH / Equitable Holdings, Inc. | 0.14 | 0.00 | 7.07 | -9.14 | 0.1137 | 0.0050 | |||
| KEY / KeyCorp | 0.47 | -6.09 | 6.99 | -22.49 | 0.1124 | -0.0135 | |||
| LUV / Southwest Airlines Co. | 0.24 | -5.11 | 6.75 | -13.61 | 0.1086 | -0.0006 | |||
| ALLY / Ally Financial Inc. | 0.21 | -5.73 | 6.75 | -20.99 | 0.1084 | -0.0108 | |||
| EMN / Eastman Chemical Company | 0.08 | -6.14 | 6.26 | -27.48 | 0.1006 | -0.0198 | |||
| FNF / Fidelity National Financial, Inc. | 0.10 | -7.28 | 6.09 | 2.10 | 0.0978 | 0.0146 | |||
| UHALB / U-Haul Holding Company - Series N | 0.10 | -5.96 | 5.71 | -20.41 | 0.0918 | -0.0084 | |||
| FBHS / Fortune Brands Home & Security Inc | 0.09 | -5.88 | 5.09 | -29.31 | 0.0819 | -0.0187 | |||
| DVA / DaVita Inc. | 0.03 | -5.71 | 4.59 | -24.25 | 0.0737 | -0.0108 | |||
| BEN / Franklin Resources, Inc. | 0.22 | -5.47 | 4.14 | -20.25 | 0.0666 | -0.0059 | |||
| BIO / Bio-Rad Laboratories, Inc. | 0.01 | -4.88 | 2.96 | -35.68 | 0.0476 | -0.0166 | |||
| WLK / Westlake Corporation | 0.03 | -7.03 | 2.75 | -24.79 | 0.0442 | -0.0068 | |||
| S P500 EMINI FUT JUN25 / DE (N/A) | 0.21 | 0.0034 | 0.0034 | ||||||
| E MINI RUSS 2000 JUN25 / DE (N/A) | 0.19 | 0.0030 | 0.0030 | ||||||
| AES / The AES Corporation | 0.00 | -100.00 | 0.00 | -100.00 | -0.0532 | ||||
| HII / Huntington Ingalls Industries, Inc. | 0.00 | -100.00 | 0.00 | -100.00 | -0.1373 |