Mga Batayang Estadistika
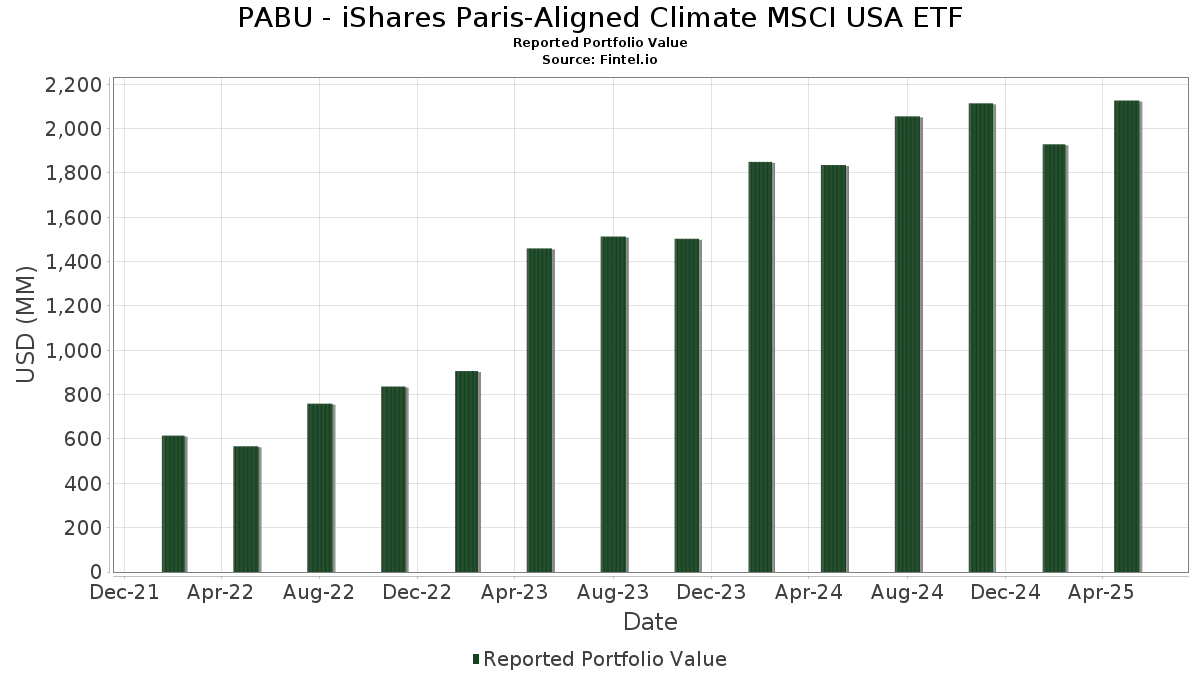
| Nilai Portofolio | $ 2,126,637,745 |
| Posisi Saat Ini | 209 |
Kepemilikan Terbaru, Kinerja, AUM (dari 13F, 13D)
PABU - iShares Paris-Aligned Climate MSCI USA ETF telah mengungkapkan total kepemilikan 209 dalam pengajuan SEC terbaru mereka. Nilai portofolio terbaru dihitung sebesar $ 2,126,637,745 USD. Aset yang Dikelola (AUM) sebenarnya adalah nilai ini ditambah kas (yang tidak diungkapkan). Aset-aset utama PABU - iShares Paris-Aligned Climate MSCI USA ETF adalah NVIDIA Corporation (US:NVDA) , Microsoft Corporation (US:MSFT) , Apple Inc. (US:AAPL) , Amazon.com, Inc. (US:AMZN) , and Tesla, Inc. (US:TSLA) .
Peningkatan Tertinggi Kuartal Ini
Kami menggunakan perubahan dalam alokasi portofolio karena ini adalah metrik yang paling bermakna. Perubahan dapat disebabkan oleh perdagangan atau perubahan harga saham.
| Keamanan | Saham (MM) |
Nilai (Juta Dolar AS) |
Portfolio % | ΔPorsyento ng Portfolio |
|---|---|---|---|---|
| 0.36 | 164.05 | 7.7889 | 1.1177 | |
| 1.30 | 176.12 | 8.3620 | 0.6843 | |
| 0.22 | 77.23 | 3.6671 | 0.5871 | |
| 0.19 | 46.52 | 2.2089 | 0.4015 | |
| 0.02 | 24.77 | 1.1760 | 0.2274 | |
| 0.26 | 43.90 | 2.0843 | 0.1976 | |
| 21.83 | 21.84 | 1.0370 | 0.1930 | |
| 0.02 | 12.98 | 0.6162 | 0.1847 | |
| 0.02 | 13.81 | 0.6555 | 0.1254 | |
| 0.03 | 29.46 | 1.3985 | 0.1212 |
Penurunan Tertinggi Kuartal Ini
Kami menggunakan perubahan dalam alokasi portofolio karena ini adalah metrik yang paling bermakna. Perubahan dapat disebabkan oleh perdagangan atau perubahan harga saham.
| Keamanan | Saham (MM) |
Nilai (Juta Dolar AS) |
Portfolio % | ΔPorsyento ng Portfolio |
|---|---|---|---|---|
| 0.64 | 129.53 | 6.1501 | -1.2048 | |
| 0.05 | 34.83 | 1.6538 | -0.3963 | |
| 0.04 | 11.95 | 0.5672 | -0.3191 | |
| 0.09 | 5.24 | 0.2487 | -0.1271 | |
| 0.02 | 8.64 | 0.4101 | -0.1252 | |
| 0.03 | 5.42 | 0.2576 | -0.1138 | |
| 0.39 | 79.08 | 3.7546 | -0.1068 | |
| 0.15 | 11.54 | 0.5481 | -0.1052 | |
| 0.07 | 18.95 | 0.8999 | -0.1033 | |
| 0.14 | 15.43 | 0.7326 | -0.0982 |
Pengajuan 13F dan Dana
Formulir ini diajukan pada 2025-07-24 untuk periode pelaporan 2025-05-31. Klik ikon tautan untuk melihat riwayat transaksi selengkapnya.
Tingkatkan ke versi premium untuk membuka data premium dan ekspor ke Excel. ![]() .
.
| Keamanan | Ketik | Harga Saham Rata-rata | Saham (MM) |
ΔSaham (%) |
ΔSaham (%) |
Nilai ($MM) |
Portpolyo (%) |
ΔPortofolio (%) |
|
|---|---|---|---|---|---|---|---|---|---|
| NVDA / NVIDIA Corporation | 1.30 | 10.74 | 176.12 | 19.79 | 8.3620 | 0.6843 | |||
| MSFT / Microsoft Corporation | 0.36 | 10.74 | 164.05 | 28.42 | 7.7889 | 1.1177 | |||
| AAPL / Apple Inc. | 0.64 | 10.74 | 129.53 | -8.03 | 6.1501 | -1.2048 | |||
| AMZN / Amazon.com, Inc. | 0.39 | 10.74 | 79.08 | 6.95 | 3.7546 | -0.1068 | |||
| TSLA / Tesla, Inc. | 0.22 | 10.74 | 77.23 | 30.95 | 3.6671 | 0.5871 | |||
| META / Meta Platforms, Inc. | 0.09 | 10.74 | 59.89 | 7.31 | 2.8435 | -0.0710 | |||
| GOOG / Alphabet Inc. | 0.29 | 10.74 | 50.57 | 11.15 | 2.4011 | 0.0250 | |||
| AVGO / Broadcom Inc. | 0.19 | 10.74 | 46.52 | 34.42 | 2.2089 | 0.4015 | |||
| EQIX / Equinix, Inc. | 0.05 | 10.74 | 46.07 | 8.80 | 2.1874 | -0.0239 | |||
| DLR / Digital Realty Trust, Inc. | 0.26 | 10.74 | 43.90 | 21.51 | 2.0843 | 0.1976 | |||
| SHW / The Sherwin-Williams Company | 0.12 | 10.74 | 43.55 | 9.68 | 2.0678 | -0.0057 | |||
| V / Visa Inc. | 0.12 | 10.74 | 42.12 | 11.50 | 1.9998 | 0.0271 | |||
| IBM / International Business Machines Corporation | 0.15 | 10.74 | 37.63 | 13.65 | 1.7865 | 0.0575 | |||
| LLY / Eli Lilly and Company | 0.05 | 10.73 | 34.83 | -11.27 | 1.6538 | -0.3963 | |||
| JPM / JPMorgan Chase & Co. | 0.12 | 10.74 | 31.84 | 10.47 | 1.5119 | 0.0066 | |||
| MA / Mastercard Incorporated | 0.05 | 10.74 | 29.81 | 12.52 | 1.4154 | 0.0319 | |||
| NOW / ServiceNow, Inc. | 0.03 | 10.74 | 29.46 | 20.43 | 1.3985 | 0.1212 | |||
| XYL / Xylem Inc. | 0.20 | 10.74 | 25.16 | 6.64 | 1.1946 | -0.0375 | |||
| MCD / McDonald's Corporation | 0.08 | 10.74 | 24.89 | 12.72 | 1.1816 | 0.0287 | |||
| NFLX / Netflix, Inc. | 0.02 | 10.75 | 24.77 | 36.35 | 1.1760 | 0.2274 | |||
| GOOGL / Alphabet Inc. | 0.13 | 10.72 | 22.43 | 11.68 | 1.0652 | 0.0161 | |||
| US0669225197 / BlackRock Cash Funds: Institutional, SL Agency Shares | 21.83 | 35.15 | 21.84 | 35.13 | 1.0370 | 0.1930 | |||
| JNJ / Johnson & Johnson | 0.12 | 10.67 | 19.32 | 4.09 | 0.9174 | -0.0520 | |||
| CRM / Salesforce, Inc. | 0.07 | 10.73 | 18.95 | -1.34 | 0.8999 | -0.1033 | |||
| CSCO / Cisco Systems, Inc. | 0.29 | 10.80 | 18.24 | 8.96 | 0.8658 | -0.0082 | |||
| AWK / American Water Works Company, Inc. | 0.12 | 10.81 | 17.83 | 16.52 | 0.8468 | 0.0475 | |||
| EIX / Edison International | 0.32 | 10.67 | 17.66 | 13.13 | 0.8386 | 0.0233 | |||
| SPGI / S&P Global Inc. | 0.03 | 10.73 | 17.11 | 6.40 | 0.8124 | -0.0274 | |||
| 0R1Z / Oracle Corporation | 0.10 | 10.70 | 16.18 | 10.35 | 0.7682 | 0.0025 | |||
| PLD / Prologis, Inc. | 0.14 | 10.67 | 15.43 | -3.01 | 0.7326 | -0.0982 | |||
| HD / The Home Depot, Inc. | 0.04 | 10.71 | 14.67 | 2.81 | 0.6964 | -0.0486 | |||
| ABBV / AbbVie Inc. | 0.07 | 10.74 | 13.84 | -1.40 | 0.6570 | -0.0759 | |||
| INTU / Intuit Inc. | 0.02 | 10.79 | 13.81 | 36.00 | 0.6555 | 0.1254 | |||
| ADI / Analog Devices, Inc. | 0.06 | 10.80 | 13.38 | 3.06 | 0.6351 | -0.0427 | |||
| FSLR / First Solar, Inc. | 0.08 | 10.74 | 13.21 | 28.55 | 0.6273 | 0.0906 | |||
| ZTS / Zoetis Inc. | 0.08 | 10.74 | 13.20 | 11.66 | 0.6268 | 0.0094 | |||
| AXON / Axon Enterprise, Inc. | 0.02 | 10.61 | 12.98 | 57.06 | 0.6162 | 0.1847 | |||
| TXN / Texas Instruments Incorporated | 0.07 | 10.78 | 12.58 | 3.35 | 0.5973 | -0.0384 | |||
| AMD / Advanced Micro Devices, Inc. | 0.11 | 10.67 | 12.37 | 22.71 | 0.5873 | 0.0609 | |||
| UNH / UnitedHealth Group Incorporated | 0.04 | 10.73 | 11.95 | -29.62 | 0.5672 | -0.3191 | |||
| AFL / Aflac Incorporated | 0.11 | 10.72 | 11.81 | 4.73 | 0.5607 | -0.0282 | |||
| MRK / Merck & Co., Inc. | 0.15 | 10.77 | 11.54 | -7.74 | 0.5481 | -0.1052 | |||
| BLK / BlackRock, Inc. | 0.01 | 10.82 | 10.60 | 11.05 | 0.5034 | 0.0048 | |||
| MCO / Moody's Corporation | 0.02 | 10.76 | 10.42 | 5.35 | 0.4949 | -0.0218 | |||
| SCHW / The Charles Schwab Corporation | 0.11 | 10.72 | 9.83 | 22.99 | 0.4666 | 0.0493 | |||
| AVB / AvalonBay Communities, Inc. | 0.05 | 10.71 | 9.58 | 1.20 | 0.4547 | -0.0394 | |||
| CME / CME Group Inc. | 0.03 | 10.72 | 9.52 | 26.10 | 0.4522 | 0.0577 | |||
| MSI / Motorola Solutions, Inc. | 0.02 | 10.64 | 9.46 | 4.39 | 0.4492 | -0.0241 | |||
| ADBE / Adobe Inc. | 0.02 | 10.63 | 9.37 | 4.71 | 0.4448 | -0.0224 | |||
| IDXX / IDEXX Laboratories, Inc. | 0.02 | 10.88 | 9.29 | 30.23 | 0.4410 | 0.0685 | |||
| FFIV / F5, Inc. | 0.03 | 10.89 | 9.03 | 8.22 | 0.4287 | -0.0070 | |||
| AXP / American Express Company | 0.03 | 10.93 | 8.99 | 8.39 | 0.4270 | -0.0063 | |||
| PGR / The Progressive Corporation | 0.03 | 10.82 | 8.98 | 11.97 | 0.4264 | 0.0075 | |||
| RIVN / Rivian Automotive, Inc. | 0.62 | 10.90 | 8.96 | 36.09 | 0.4257 | 0.0817 | |||
| CB / Chubb Limited | 0.03 | 10.63 | 8.87 | 15.17 | 0.4211 | 0.0189 | |||
| TMO / Thermo Fisher Scientific Inc. | 0.02 | 10.65 | 8.64 | -15.74 | 0.4101 | -0.1252 | |||
| VICI / VICI Properties Inc. | 0.27 | 10.73 | 8.61 | 8.08 | 0.4090 | -0.0073 | |||
| DIS / The Walt Disney Company | 0.08 | 10.67 | 8.60 | 9.93 | 0.4082 | -0.0002 | |||
| BXP / Boston Properties, Inc. | 0.12 | 10.76 | 8.31 | 5.15 | 0.3945 | -0.0182 | |||
| ISRG / Intuitive Surgical, Inc. | 0.01 | 10.77 | 8.28 | 6.76 | 0.3931 | -0.0119 | |||
| AME / AMETEK, Inc. | 0.05 | 10.94 | 8.07 | 4.75 | 0.3830 | -0.0191 | |||
| MELI / MercadoLibre, Inc. | 0.00 | 10.33 | 7.64 | 33.28 | 0.3628 | 0.0634 | |||
| CTAS / Cintas Corporation | 0.03 | 10.55 | 7.54 | 20.67 | 0.3579 | 0.0317 | |||
| ACN / Accenture plc | 0.02 | 10.62 | 7.47 | 0.57 | 0.3547 | -0.0332 | |||
| MMC / Marsh & McLennan Companies, Inc. | 0.03 | 10.64 | 7.44 | 8.69 | 0.3535 | -0.0042 | |||
| SYK / Stryker Corporation | 0.02 | 10.69 | 7.34 | 9.66 | 0.3486 | -0.0010 | |||
| PFE / Pfizer Inc. | 0.30 | 10.99 | 7.14 | -1.35 | 0.3392 | -0.0390 | |||
| ADP / Automatic Data Processing, Inc. | 0.02 | 10.72 | 7.02 | 14.36 | 0.3334 | 0.0127 | |||
| BMY / Bristol-Myers Squibb Company | 0.14 | 10.67 | 6.94 | -10.38 | 0.3295 | -0.0749 | |||
| RPRX / Royalty Pharma plc | 0.21 | 10.64 | 6.88 | 8.13 | 0.3266 | -0.0056 | |||
| ICE / Intercontinental Exchange, Inc. | 0.04 | 10.67 | 6.81 | 14.87 | 0.3235 | 0.0138 | |||
| IEX / IDEX Corporation | 0.04 | 10.99 | 6.38 | 3.32 | 0.3029 | -0.0195 | |||
| MNST / Monster Beverage Corporation | 0.09 | 10.68 | 6.02 | 29.52 | 0.2861 | 0.0431 | |||
| PAYX / Paychex, Inc. | 0.04 | 10.77 | 5.89 | 15.32 | 0.2795 | 0.0129 | |||
| DHR / Danaher Corporation | 0.03 | 10.60 | 5.68 | 1.10 | 0.2697 | -0.0237 | |||
| BK / The Bank of New York Mellon Corporation | 0.06 | 10.63 | 5.59 | 10.21 | 0.2655 | 0.0005 | |||
| PANW / Palo Alto Networks, Inc. | 0.03 | 10.69 | 5.50 | 11.85 | 0.2614 | 0.0043 | |||
| VRTX / Vertex Pharmaceuticals Incorporated | 0.01 | 10.66 | 5.49 | 1.95 | 0.2608 | -0.0206 | |||
| VLTO / Veralto Corporation | 0.05 | 10.71 | 5.49 | 12.13 | 0.2607 | 0.0050 | |||
| SBUX / Starbucks Corporation | 0.06 | 10.81 | 5.44 | -19.68 | 0.2584 | -0.0954 | |||
| FI / Fiserv, Inc. | 0.03 | 10.45 | 5.42 | -23.72 | 0.2576 | -0.1138 | |||
| FAST / Fastenal Company | 0.13 | 122.17 | 5.40 | 21.28 | 0.2563 | 0.0239 | |||
| DOC / Healthpeak Properties, Inc. | 0.31 | 10.56 | 5.36 | -5.93 | 0.2545 | -0.0430 | |||
| ACGL / Arch Capital Group Ltd. | 0.06 | 11.04 | 5.34 | 13.58 | 0.2538 | 0.0080 | |||
| GRMN / Garmin Ltd. | 0.03 | 10.75 | 5.29 | -1.80 | 0.2511 | -0.0302 | |||
| MRVL / Marvell Technology, Inc. | 0.09 | 11.04 | 5.24 | -27.22 | 0.2487 | -0.1271 | |||
| AJG / Arthur J. Gallagher & Co. | 0.01 | 10.93 | 5.19 | 14.11 | 0.2466 | 0.0089 | |||
| PSA / Public Storage | 0.02 | 10.97 | 5.19 | 12.71 | 0.2463 | 0.0060 | |||
| AMT / American Tower Corporation | 0.02 | 10.74 | 5.17 | 15.62 | 0.2453 | 0.0119 | |||
| INTC / Intel Corporation | 0.26 | 10.64 | 5.05 | -8.84 | 0.2399 | -0.0496 | |||
| GGG / Graco Inc. | 0.06 | 10.65 | 4.98 | 7.58 | 0.2367 | -0.0053 | |||
| BFB / Brown-Forman Corp. - Class B | 0.15 | 10.98 | 4.97 | 11.77 | 0.2358 | 0.0037 | |||
| KLAC / KLA Corporation | 0.01 | 10.74 | 4.89 | 18.24 | 0.2324 | 0.0162 | |||
| BRO / Brown & Brown, Inc. | 0.04 | 10.69 | 4.74 | 5.41 | 0.2249 | -0.0097 | |||
| FTV / Fortive Corporation | 0.07 | 10.64 | 4.66 | -2.37 | 0.2212 | -0.0280 | |||
| WFC / Wells Fargo & Company | 0.06 | 10.58 | 4.63 | 5.57 | 0.2196 | -0.0092 | |||
| AMGN / Amgen Inc. | 0.02 | 11.11 | 4.62 | 3.94 | 0.2194 | -0.0128 | |||
| ADSK / Autodesk, Inc. | 0.02 | 11.11 | 4.52 | 19.98 | 0.2147 | 0.0179 | |||
| VRSK / Verisk Analytics, Inc. | 0.01 | 10.71 | 4.32 | 17.14 | 0.2051 | 0.0125 | |||
| EW / Edwards Lifesciences Corporation | 0.05 | 10.69 | 4.25 | 20.88 | 0.2018 | 0.0182 | |||
| UNP / Union Pacific Corporation | 0.02 | 10.74 | 4.20 | -0.50 | 0.1995 | -0.0210 | |||
| ROL / Rollins, Inc. | 0.07 | 10.72 | 4.20 | 21.00 | 0.1992 | 0.0181 | |||
| MKL / Markel Group Inc. | 0.00 | 10.74 | 4.09 | 11.22 | 0.1940 | 0.0021 | |||
| CMCSA / Comcast Corporation | 0.12 | 10.65 | 4.03 | 6.61 | 0.1915 | -0.0061 | |||
| YUM / Yum! Brands, Inc. | 0.03 | 10.60 | 3.98 | 1.82 | 0.1890 | -0.0152 | |||
| MTD / Mettler-Toledo International Inc. | 0.00 | 10.95 | 3.91 | 0.75 | 0.1857 | -0.0171 | |||
| AFG / American Financial Group, Inc. | 0.03 | 10.76 | 3.88 | 8.76 | 0.1840 | -0.0021 | |||
| ROK / Rockwell Automation, Inc. | 0.01 | 10.47 | 3.82 | 21.40 | 0.1813 | 0.0170 | |||
| ALL / The Allstate Corporation | 0.02 | 10.68 | 3.75 | 16.63 | 0.1778 | 0.0101 | |||
| ARE / Alexandria Real Estate Equities, Inc. | 0.05 | 10.61 | 3.56 | -24.09 | 0.1689 | -0.0758 | |||
| ROP / Roper Technologies, Inc. | 0.01 | 10.37 | 3.48 | 7.66 | 0.1655 | -0.0035 | |||
| ALNY / Alnylam Pharmaceuticals, Inc. | 0.01 | 10.65 | 3.48 | 36.62 | 0.1651 | 0.0321 | |||
| MET / MetLife, Inc. | 0.04 | 10.79 | 3.29 | 1.01 | 0.1560 | -0.0138 | |||
| ABNB / Airbnb, Inc. | 0.03 | 10.81 | 3.27 | 2.93 | 0.1554 | -0.0107 | |||
| ODFL / Old Dominion Freight Line, Inc. | 0.02 | 10.83 | 3.23 | 0.59 | 0.1533 | -0.0143 | |||
| ANET / Arista Networks Inc | 0.04 | 10.79 | 3.17 | 3.16 | 0.1503 | -0.0099 | |||
| FTNT / Fortinet, Inc. | 0.03 | 10.71 | 3.15 | 4.34 | 0.1497 | -0.0081 | |||
| CINF / Cincinnati Financial Corporation | 0.02 | 10.77 | 3.10 | 13.03 | 0.1470 | 0.0040 | |||
| SPG / Simon Property Group, Inc. | 0.02 | 10.84 | 3.08 | -2.84 | 0.1460 | -0.0193 | |||
| WTW / Willis Towers Watson Public Limited Company | 0.01 | 11.04 | 3.05 | 3.49 | 0.1450 | -0.0091 | |||
| TECH / Bio-Techne Corporation | 0.06 | 10.70 | 3.03 | -13.24 | 0.1440 | -0.0385 | |||
| PYPL / PayPal Holdings, Inc. | 0.04 | 10.92 | 2.93 | 9.69 | 0.1393 | -0.0003 | |||
| TRMB / Trimble Inc. | 0.04 | 10.94 | 2.93 | 9.87 | 0.1390 | -0.0002 | |||
| IR / Ingersoll Rand Inc. | 0.04 | 10.86 | 2.89 | 6.75 | 0.1374 | -0.0042 | |||
| CPRT / Copart, Inc. | 0.06 | 10.88 | 2.86 | 4.16 | 0.1356 | -0.0076 | |||
| KKR / KKR & Co. Inc. | 0.02 | 10.84 | 2.85 | -0.70 | 0.1353 | -0.0146 | |||
| CSGP / CoStar Group, Inc. | 0.04 | 10.86 | 2.85 | 6.95 | 0.1351 | -0.0038 | |||
| CHTR / Charter Communications, Inc. | 0.01 | 11.10 | 2.84 | 21.09 | 0.1347 | 0.0123 | |||
| NDAQ / Nasdaq, Inc. | 0.03 | 11.03 | 2.83 | 12.06 | 0.1342 | 0.0025 | |||
| VRSN / VeriSign, Inc. | 0.01 | 10.71 | 2.76 | 26.80 | 0.1310 | 0.0174 | |||
| CHD / Church & Dwight Co., Inc. | 0.03 | 10.85 | 2.71 | -1.99 | 0.1286 | -0.0157 | |||
| REGN / Regeneron Pharmaceuticals, Inc. | 0.01 | 11.10 | 2.67 | -22.05 | 0.1268 | -0.0521 | |||
| CBOE / Cboe Global Markets, Inc. | 0.01 | 10.34 | 2.64 | 19.95 | 0.1254 | 0.0104 | |||
| WST / West Pharmaceutical Services, Inc. | 0.01 | 10.33 | 2.56 | 0.16 | 0.1214 | -0.0120 | |||
| SEIC / SEI Investments Company | 0.03 | 11.15 | 2.53 | 18.38 | 0.1199 | 0.0085 | |||
| WELL / Welltower Inc. | 0.02 | 10.92 | 2.46 | 11.48 | 0.1167 | 0.0016 | |||
| VEEV / Veeva Systems Inc. | 0.01 | 11.05 | 2.44 | 38.62 | 0.1157 | 0.0239 | |||
| ESS / Essex Property Trust, Inc. | 0.01 | 11.15 | 2.41 | 1.26 | 0.1142 | -0.0098 | |||
| ACM / AECOM | 0.02 | 11.06 | 2.40 | 21.95 | 0.1140 | 0.0112 | |||
| US0669224778 / BlackRock Cash Funds: Treasury, SL Agency Shares | 2.38 | 7.32 | 2.38 | 7.29 | 0.1132 | -0.0028 | |||
| CMG / Chipotle Mexican Grill, Inc. | 0.05 | 11.03 | 2.33 | 3.00 | 0.1108 | -0.0075 | |||
| PKI / Revvity Inc. | 0.03 | 10.81 | 2.27 | -10.64 | 0.1077 | -0.0249 | |||
| EQR / Equity Residential | 0.03 | 11.04 | 2.26 | 5.02 | 0.1073 | -0.0051 | |||
| EFX / Equifax Inc. | 0.01 | 10.87 | 2.16 | 19.46 | 0.1023 | 0.0081 | |||
| HLT / Hilton Worldwide Holdings Inc. | 0.01 | 10.36 | 2.06 | 3.51 | 0.0980 | -0.0062 | |||
| NTRS / Northern Trust Corporation | 0.02 | 10.13 | 2.06 | 6.62 | 0.0979 | -0.0031 | |||
| FDS / FactSet Research Systems Inc. | 0.00 | 9.26 | 2.02 | 8.48 | 0.0960 | -0.0014 | |||
| ULTA / Ulta Beauty, Inc. | 0.00 | 11.24 | 1.92 | 43.22 | 0.0913 | 0.0211 | |||
| FLT / Corpay, Inc. | 0.01 | 11.31 | 1.89 | -1.41 | 0.0899 | -0.0104 | |||
| TROW / T. Rowe Price Group, Inc. | 0.02 | 15.52 | 1.86 | 2.26 | 0.0883 | -0.0067 | |||
| ERIE / Erie Indemnity Company | 0.01 | 11.67 | 1.85 | -6.49 | 0.0876 | -0.0154 | |||
| MTB / M&T Bank Corporation | 0.01 | 11.36 | 1.81 | 6.15 | 0.0861 | -0.0032 | |||
| HIG / The Hartford Insurance Group, Inc. | 0.01 | 9.95 | 1.81 | 20.71 | 0.0858 | 0.0076 | |||
| O / Realty Income Corporation | 0.03 | 11.48 | 1.79 | 10.73 | 0.0848 | 0.0005 | |||
| DXCM / DexCom, Inc. | 0.02 | 11.37 | 1.72 | 8.18 | 0.0817 | -0.0014 | |||
| FWONK / Formula One Group | 0.02 | 10.21 | 1.69 | 10.33 | 0.0801 | 0.0002 | |||
| EXR / Extra Space Storage Inc. | 0.01 | 10.31 | 1.65 | 9.28 | 0.0783 | -0.0005 | |||
| AON / Aon plc | 0.00 | 9.13 | 1.64 | -0.73 | 0.0779 | -0.0084 | |||
| WDAY / Workday, Inc. | 0.01 | 11.30 | 1.54 | 4.71 | 0.0729 | -0.0037 | |||
| COO / The Cooper Companies, Inc. | 0.02 | 11.32 | 1.47 | -15.89 | 0.0699 | -0.0215 | |||
| UBER / Uber Technologies, Inc. | 0.02 | 11.62 | 1.30 | 23.60 | 0.0620 | 0.0068 | |||
| ANSS / ANSYS, Inc. | 0.00 | 11.45 | 1.18 | 10.64 | 0.0558 | 0.0003 | |||
| PODD / Insulet Corporation | 0.00 | 8.43 | 1.18 | 29.41 | 0.0558 | 0.0084 | |||
| FOX / Fox Corporation | 0.02 | 10.21 | 1.08 | 2.48 | 0.0510 | -0.0037 | |||
| ILMN / Illumina, Inc. | 0.01 | 10.22 | 1.06 | 2.21 | 0.0505 | -0.0039 | |||
| TTD / The Trade Desk, Inc. | 0.01 | 10.14 | 1.03 | 17.87 | 0.0489 | 0.0032 | |||
| BMRN / BioMarin Pharmaceutical Inc. | 0.02 | 10.03 | 0.99 | -10.21 | 0.0472 | -0.0106 | |||
| FIS / Fidelity National Information Services, Inc. | 0.01 | 10.12 | 0.99 | 23.22 | 0.0469 | 0.0051 | |||
| AMP / Ameriprise Financial, Inc. | 0.00 | 10.40 | 0.97 | 4.63 | 0.0462 | -0.0024 | |||
| COIN / Coinbase Global, Inc. | 0.00 | 10.09 | 0.97 | 25.88 | 0.0460 | 0.0058 | |||
| BIIB / Biogen Inc. | 0.01 | 9.73 | 0.97 | 1.36 | 0.0459 | -0.0039 | |||
| GPN / Global Payments Inc. | 0.01 | 9.91 | 0.96 | -21.06 | 0.0454 | -0.0179 | |||
| TYL / Tyler Technologies, Inc. | 0.00 | 10.73 | 0.92 | 5.01 | 0.0438 | -0.0021 | |||
| ZM / Zoom Communications Inc. | 0.01 | 9.89 | 0.87 | 21.12 | 0.0411 | 0.0038 | |||
| NBIX / Neurocrine Biosciences, Inc. | 0.01 | 10.08 | 0.81 | 14.16 | 0.0383 | 0.0014 | |||
| BAH / Booz Allen Hamilton Holding Corporation | 0.01 | 9.79 | 0.79 | 9.93 | 0.0374 | -0.0000 | |||
| FOXA / Fox Corporation | 0.01 | 13.21 | 0.74 | 7.99 | 0.0353 | -0.0007 | |||
| USB / U.S. Bancorp | 0.02 | 10.22 | 0.68 | 2.58 | 0.0321 | -0.0024 | |||
| TTWO / Take-Two Interactive Software, Inc. | 0.00 | 12.68 | 0.67 | 20.25 | 0.0319 | 0.0027 | |||
| WAB / Westinghouse Air Brake Technologies Corporation | 0.00 | 10.12 | 0.66 | 20.22 | 0.0314 | 0.0027 | |||
| SNOW / Snowflake Inc. | 0.00 | 10.31 | 0.66 | 28.16 | 0.0313 | 0.0044 | |||
| WAT / Waters Corporation | 0.00 | 11.71 | 0.60 | 3.45 | 0.0285 | -0.0018 | |||
| WPC / W. P. Carey Inc. | 0.01 | 6.68 | 0.59 | 4.45 | 0.0279 | -0.0015 | |||
| IQV / IQVIA Holdings Inc. | 0.00 | 9.44 | 0.59 | -18.64 | 0.0278 | -0.0098 | |||
| TW / Tradeweb Markets Inc. | 0.00 | 9.96 | 0.57 | 17.38 | 0.0273 | 0.0017 | |||
| BIO / Bio-Rad Laboratories, Inc. | 0.00 | 11.43 | 0.53 | -4.68 | 0.0252 | -0.0039 | |||
| HSY / The Hershey Company | 0.00 | 10.60 | 0.50 | 2.87 | 0.0239 | -0.0016 | |||
| URI / United Rentals, Inc. | 0.00 | 9.60 | 0.49 | 20.95 | 0.0230 | 0.0021 | |||
| ALGN / Align Technology, Inc. | 0.00 | 9.88 | 0.48 | 6.17 | 0.0229 | -0.0008 | |||
| PINS / Pinterest, Inc. | 0.02 | 10.07 | 0.47 | -7.31 | 0.0223 | -0.0042 | |||
| STZ / Constellation Brands, Inc. | 0.00 | 10.97 | 0.43 | 12.79 | 0.0206 | 0.0005 | |||
| IT / Gartner, Inc. | 0.00 | 12.61 | 0.43 | -1.37 | 0.0205 | -0.0024 | |||
| SMCI / Super Micro Computer, Inc. | 0.01 | 10.01 | 0.42 | 6.30 | 0.0201 | -0.0007 | |||
| EBAY / eBay Inc. | 0.01 | 10.33 | 0.42 | 24.56 | 0.0200 | 0.0024 | |||
| RJF / Raymond James Financial, Inc. | 0.00 | 9.38 | 0.41 | 4.05 | 0.0195 | -0.0011 | |||
| OKTA / Okta, Inc. | 0.00 | 9.21 | 0.37 | 24.83 | 0.0174 | 0.0020 | |||
| Z / Zillow Group, Inc. | 0.00 | 10.20 | 0.30 | -3.49 | 0.0145 | -0.0020 | |||
| NASDAQ 100 E MINI JUN25 / DE (N/A) | 0.29 | 0.0136 | 0.0136 | ||||||
| NASDAQ 100 E MINI JUN25 / DE (N/A) | 0.29 | 0.0136 | 0.0136 | ||||||
| NASDAQ 100 E MINI JUN25 / DE (N/A) | 0.29 | 0.0136 | 0.0136 | ||||||
| PAYC / Paycom Software, Inc. | 0.00 | 2.29 | 0.27 | 20.91 | 0.0126 | 0.0011 | |||
| JKHY / Jack Henry & Associates, Inc. | 0.00 | 9.16 | 0.26 | 14.10 | 0.0123 | 0.0004 | |||
| SSNC / SS&C Technologies Holdings, Inc. | 0.00 | 10.63 | 0.25 | 0.40 | 0.0120 | -0.0011 | |||
| EXAS / Exact Sciences Corporation | 0.00 | 9.33 | 0.24 | 30.22 | 0.0113 | 0.0017 | |||
| SNAP / Snap Inc. | 0.03 | 9.97 | 0.23 | -11.58 | 0.0109 | -0.0026 | |||
| WYNN / Wynn Resorts, Limited | 0.00 | 10.60 | 0.23 | 11.88 | 0.0108 | 0.0002 | |||
| NLY / Annaly Capital Management, Inc. | 0.01 | 10.28 | 0.21 | -4.61 | 0.0098 | -0.0015 | |||
| XAV HEALTH CARE JUN25 / DE (N/A) | -0.06 | -0.0030 | -0.0030 | ||||||
| XAV HEALTH CARE JUN25 / DE (N/A) | -0.06 | -0.0030 | -0.0030 |