Mga Batayang Estadistika
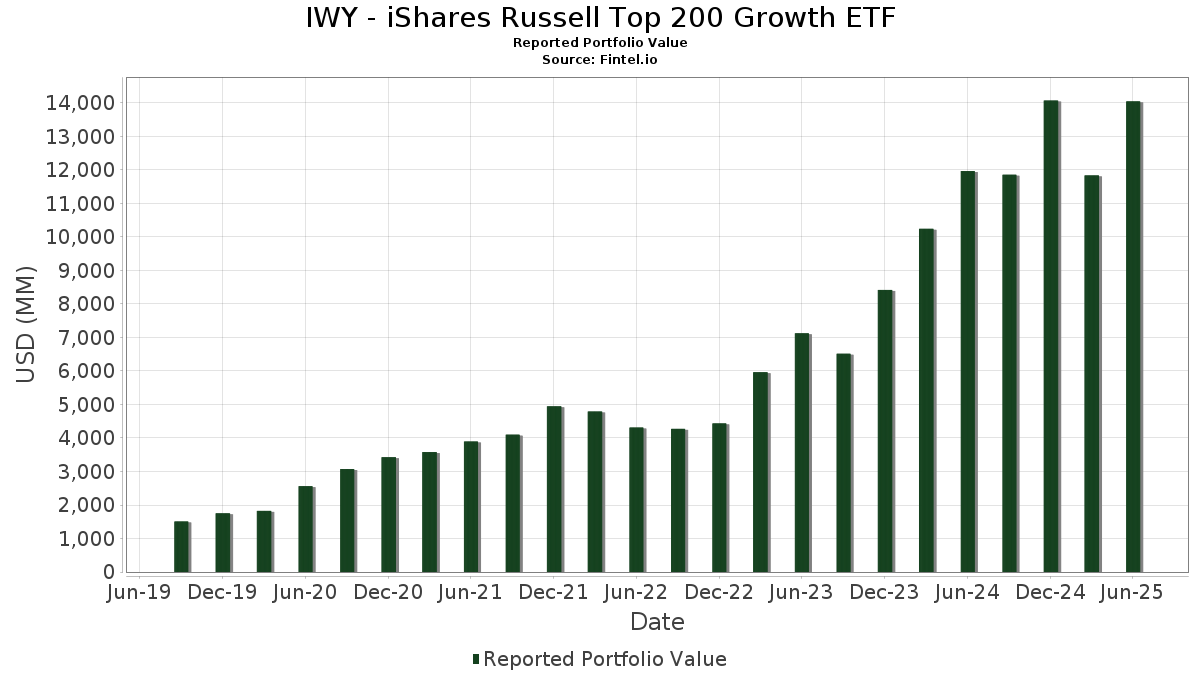
| Nilai Portofolio | $ 14,047,880,807 |
| Posisi Saat Ini | 113 |
Kepemilikan Terbaru, Kinerja, AUM (dari 13F, 13D)
IWY - iShares Russell Top 200 Growth ETF telah mengungkapkan total kepemilikan 113 dalam pengajuan SEC terbaru mereka. Nilai portofolio terbaru dihitung sebesar $ 14,047,880,807 USD. Aset yang Dikelola (AUM) sebenarnya adalah nilai ini ditambah kas (yang tidak diungkapkan). Aset-aset utama IWY - iShares Russell Top 200 Growth ETF adalah NVIDIA Corporation (US:NVDA) , Microsoft Corporation (US:MSFT) , Apple Inc. (US:AAPL) , Amazon.com, Inc. (US:AMZN) , and Meta Platforms, Inc. (US:META) . Posisi baru IWY - iShares Russell Top 200 Growth ETF meliputi: Palantir Technologies Inc. (US:PLTR) , GE Vernova Inc. (US:GEV) , AppLovin Corporation (US:APP) , Nu Holdings Ltd. (DE:M1Z) , and Walmart Inc. (US:WMT) .
Peningkatan Tertinggi Kuartal Ini
Kami menggunakan perubahan dalam alokasi portofolio karena ini adalah metrik yang paling bermakna. Perubahan dapat disebabkan oleh perdagangan atau perubahan harga saham.
| Keamanan | Saham (MM) |
Nilai (Juta Dolar AS) |
Portfolio % | ΔPorsyento ng Portfolio |
|---|---|---|---|---|
| 10.85 | 1,714.73 | 12.2755 | 3.0207 | |
| 3.43 | 1,705.70 | 12.2109 | 2.0746 | |
| 2.35 | 646.81 | 4.6304 | 1.4798 | |
| 1.30 | 177.70 | 1.2721 | 1.2721 | |
| 0.63 | 161.52 | 1.1563 | 0.9247 | |
| 0.93 | 685.02 | 4.9040 | 0.6482 | |
| 0.16 | 86.33 | 0.6180 | 0.6180 | |
| 1.06 | 196.24 | 1.4048 | 0.6019 | |
| 72.53 | 72.53 | 0.5192 | 0.5192 | |
| 72.53 | 72.53 | 0.5192 | 0.5192 |
Penurunan Tertinggi Kuartal Ini
Kami menggunakan perubahan dalam alokasi portofolio karena ini adalah metrik yang paling bermakna. Perubahan dapat disebabkan oleh perdagangan atau perubahan harga saham.
| Keamanan | Saham (MM) |
Nilai (Juta Dolar AS) |
Portfolio % | ΔPorsyento ng Portfolio |
|---|---|---|---|---|
| 6.92 | 1,418.96 | 10.1581 | -1.6018 | |
| 3.51 | 769.34 | 5.5076 | -1.3032 | |
| 1.90 | 334.37 | 2.3937 | -1.0901 | |
| 1.54 | 274.05 | 1.9619 | -0.9438 | |
| 0.06 | 17.02 | 0.1218 | -0.9312 | |
| 0.11 | 14.79 | 0.1059 | -0.7096 | |
| 0.02 | 4.68 | 0.0335 | -0.6638 | |
| 0.15 | 23.88 | 0.1710 | -0.6347 | |
| 0.48 | 372.68 | 2.6680 | -0.5364 | |
| 1.02 | 360.88 | 2.5835 | -0.4438 |
Pengajuan 13F dan Dana
Formulir ini diajukan pada 2025-08-26 untuk periode pelaporan 2025-06-30. Klik ikon tautan untuk melihat riwayat transaksi selengkapnya.
Tingkatkan ke versi premium untuk membuka data premium dan ekspor ke Excel. ![]() .
.
| Keamanan | Ketik | Harga Saham Rata-rata | Saham (MM) |
ΔSaham (%) |
ΔSaham (%) |
Nilai ($MM) |
Portpolyo (%) |
ΔPortofolio (%) |
|
|---|---|---|---|---|---|---|---|---|---|
| NVDA / NVIDIA Corporation | 10.85 | 8.07 | 1,714.73 | 57.54 | 12.2755 | 3.0207 | |||
| MSFT / Microsoft Corporation | 3.43 | 7.98 | 1,705.70 | 43.08 | 12.2109 | 2.0746 | |||
| AAPL / Apple Inc. | 6.92 | 11.08 | 1,418.96 | 2.60 | 10.1581 | -1.6018 | |||
| AMZN / Amazon.com, Inc. | 3.51 | -16.71 | 769.34 | -3.95 | 5.5076 | -1.3032 | |||
| META / Meta Platforms, Inc. | 0.93 | 6.87 | 685.02 | 36.86 | 4.9040 | 0.6482 | |||
| AVGO / Broadcom Inc. | 2.35 | 6.03 | 646.81 | 74.56 | 4.6304 | 1.4798 | |||
| TSLA / Tesla, Inc. | 1.52 | -1.21 | 483.66 | 21.09 | 3.4624 | 0.0662 | |||
| LLY / Eli Lilly and Company | 0.48 | 4.78 | 372.68 | -1.11 | 2.6680 | -0.5364 | |||
| V / Visa Inc. | 1.02 | 0.05 | 360.88 | 1.36 | 2.5835 | -0.4438 | |||
| NFLX / Netflix, Inc. | 0.25 | 0.37 | 338.68 | 44.14 | 2.4246 | 0.4267 | |||
| GOOGL / Alphabet Inc. | 1.90 | -28.39 | 334.37 | -18.39 | 2.3937 | -1.0901 | |||
| GOOG / Alphabet Inc. | 1.54 | -29.37 | 274.05 | -19.81 | 1.9619 | -0.9438 | |||
| MA / Mastercard Incorporated | 0.49 | 1.10 | 272.82 | 3.65 | 1.9531 | -0.2849 | |||
| COST / Costco Wholesale Corporation | 0.26 | 1.46 | 262.21 | 6.19 | 1.8771 | -0.2224 | |||
| ORCL / Oracle Corporation | 0.99 | 4.98 | 216.04 | 64.16 | 1.5466 | 0.4276 | |||
| ABBV / AbbVie Inc. | 1.06 | 134.56 | 196.24 | 107.81 | 1.4048 | 0.6019 | |||
| PLTR / Palantir Technologies Inc. | 1.30 | 177.70 | 1.2721 | 1.2721 | |||||
| HD / The Home Depot, Inc. | 0.45 | -2.86 | 166.02 | -2.82 | 1.1885 | -0.2640 | |||
| GE / General Electric Company | 0.63 | 361.17 | 161.52 | 493.06 | 1.1563 | 0.9247 | |||
| INTU / Intuit Inc. | 0.16 | 1.33 | 128.33 | 29.99 | 0.9187 | 0.0793 | |||
| NOW / ServiceNow, Inc. | 0.12 | 2.01 | 126.80 | 31.72 | 0.9077 | 0.0892 | |||
| ISRG / Intuitive Surgical, Inc. | 0.21 | 2.37 | 115.73 | 12.33 | 0.8285 | -0.0476 | |||
| UBER / Uber Technologies, Inc. | 1.20 | 0.38 | 112.10 | 28.54 | 0.8025 | 0.0610 | |||
| BKNG / Booking Holdings Inc. | 0.02 | -0.40 | 105.56 | 25.16 | 0.7557 | 0.0386 | |||
| ADBE / Adobe Inc. | 0.25 | -0.91 | 98.26 | -0.05 | 0.7034 | -0.1325 | |||
| GEV / GE Vernova Inc. | 0.16 | 86.33 | 0.6180 | 0.6180 | |||||
| KO / The Coca-Cola Company | 1.13 | -13.43 | 80.23 | -14.48 | 0.5743 | -0.2234 | |||
| PANW / Palo Alto Networks, Inc. | 0.39 | 2.86 | 80.22 | 23.36 | 0.5743 | 0.0214 | |||
| AMD / Advanced Micro Devices, Inc. | 0.56 | -10.18 | 79.77 | 24.05 | 0.5711 | 0.0243 | |||
| LRCX / Lam Research Corporation | 0.76 | 0.74 | 74.27 | 34.89 | 0.5317 | 0.0635 | |||
| CRWD / CrowdStrike Holdings, Inc. | 0.15 | 7.46 | 74.23 | 55.23 | 0.5314 | 0.1248 | |||
| BLACKROCK CASH FUNDS / STIV (000000000) | 72.53 | 72.53 | 0.5192 | 0.5192 | |||||
| BLACKROCK CASH FUNDS / STIV (000000000) | 72.53 | 72.53 | 0.5192 | 0.5192 | |||||
| KLAC / KLA Corporation | 0.08 | 1.52 | 71.24 | 33.77 | 0.5100 | 0.0572 | |||
| APH / Amphenol Corporation | 0.72 | 77.72 | 71.06 | 167.58 | 0.5087 | 0.2829 | |||
| SPF / Spotify Technology S.A. | 0.09 | 6.00 | 70.44 | 47.88 | 0.5043 | 0.0992 | |||
| ADP / Automatic Data Processing, Inc. | 0.23 | 0.33 | 69.53 | 1.27 | 0.4977 | -0.0860 | |||
| VRTX / Vertex Pharmaceuticals Incorporated | 0.15 | 101.25 | 68.32 | 84.81 | 0.4891 | 0.1748 | |||
| AMGN / Amgen Inc. | 0.24 | -3.77 | 66.11 | -13.76 | 0.4733 | -0.1785 | |||
| BX / Blackstone Inc. | 0.44 | 2.76 | 65.33 | 9.96 | 0.4677 | -0.0375 | |||
| ANET / Arista Networks Inc | 0.62 | 1.52 | 63.07 | 34.06 | 0.4515 | 0.0515 | |||
| AMT / American Tower Corporation | 0.28 | 1.52 | 61.72 | 3.12 | 0.4418 | -0.0671 | |||
| 2IS / Trane Technologies plc | 0.13 | 193.09 | 58.19 | 280.52 | 0.4166 | 0.2865 | |||
| DASH / DoorDash, Inc. | 0.21 | 17.62 | 52.78 | 58.65 | 0.3778 | 0.0950 | |||
| MCK / McKesson Corporation | 0.07 | 114.89 | 50.66 | 133.98 | 0.3626 | 0.1786 | |||
| WM / Waste Management, Inc. | 0.22 | -6.57 | 50.52 | -7.66 | 0.3616 | -0.1035 | |||
| CDNS / Cadence Design Systems, Inc. | 0.16 | 1.53 | 50.13 | 23.01 | 0.3589 | 0.0124 | |||
| APP / AppLovin Corporation | 0.14 | 49.81 | 0.3566 | 0.3566 | |||||
| MCO / Moody's Corporation | 0.09 | -0.15 | 46.53 | 7.54 | 0.3331 | -0.0348 | |||
| TXN / Texas Instruments Incorporated | 0.22 | 242.63 | 46.07 | 295.89 | 0.3298 | 0.2309 | |||
| CTAS / Cintas Corporation | 0.21 | 6.01 | 45.73 | 14.95 | 0.3273 | -0.0109 | |||
| CMG / Chipotle Mexican Grill, Inc. | 0.80 | -0.64 | 44.95 | 11.12 | 0.3218 | -0.0222 | |||
| SHW / The Sherwin-Williams Company | 0.13 | 0.15 | 43.32 | -1.52 | 0.3101 | -0.0639 | |||
| ORLY / O'Reilly Automotive, Inc. | 0.47 | 1,386.89 | 42.13 | -6.45 | 0.3016 | -0.0813 | |||
| SNOW / Snowflake Inc. | 0.19 | 1.52 | 41.70 | 55.43 | 0.2985 | 0.0704 | |||
| SNPS / Synopsys, Inc. | 0.08 | -11.12 | 41.43 | 6.25 | 0.2966 | -0.0350 | |||
| AON / Aon plc | 0.12 | 41.29 | 0.2956 | 0.2956 | |||||
| TJX / The TJX Companies, Inc. | 0.33 | -15.25 | 41.21 | -14.07 | 0.2950 | -0.1128 | |||
| FTNT / Fortinet, Inc. | 0.38 | 25.42 | 40.14 | 37.75 | 0.2874 | 0.0396 | |||
| ADSK / Autodesk, Inc. | 0.13 | 0.03 | 39.36 | 18.28 | 0.2818 | -0.0012 | |||
| AXP / American Express Company | 0.11 | -12.35 | 34.28 | 3.91 | 0.2454 | -0.0351 | |||
| ABNB / Airbnb, Inc. | 0.25 | 0.84 | 33.58 | 11.71 | 0.2404 | -0.0152 | |||
| ZTS / Zoetis Inc. | 0.21 | -3.34 | 33.13 | -8.45 | 0.2372 | -0.0705 | |||
| WDAY / Workday, Inc. | 0.13 | 3.20 | 30.82 | 6.06 | 0.2206 | -0.0264 | |||
| MAR / Marriott International, Inc. | 0.10 | -8.57 | 28.48 | 3.32 | 0.2039 | -0.0264 | |||
| M1Z / Nu Holdings Ltd. | 1.91 | 26.14 | 0.1871 | 0.1871 | |||||
| MNST / Monster Beverage Corporation | 0.42 | 25.28 | 26.08 | 34.10 | 0.1867 | 0.0213 | |||
| WMT / Walmart Inc. | 0.26 | 25.37 | 0.1816 | 0.1816 | |||||
| AMAT / Applied Materials, Inc. | 0.14 | -68.80 | 25.16 | -60.64 | 0.1801 | -0.3635 | |||
| APO / Apollo Global Management, Inc. | 0.17 | -25.59 | 24.31 | -22.91 | 0.1740 | -0.0941 | |||
| CPRT / Copart, Inc. | 0.49 | 2.86 | 24.12 | -10.81 | 0.1727 | -0.0573 | |||
| QCOM / QUALCOMM Incorporated | 0.15 | -75.69 | 23.88 | -74.79 | 0.1710 | -0.6347 | |||
| GILD / Gilead Sciences, Inc. | 0.20 | 22.18 | 0.1588 | 0.1588 | |||||
| SYK / Stryker Corporation | 0.05 | -16.41 | 20.90 | -11.16 | 0.1496 | -0.0504 | |||
| CL / Colgate-Palmolive Company | 0.23 | -13.48 | 20.67 | -16.06 | 0.1480 | -0.0614 | |||
| TEAM / Atlassian Corporation | 0.10 | 1.52 | 19.58 | -2.84 | 0.1402 | -0.0312 | |||
| MSI / Motorola Solutions, Inc. | 0.04 | -9.18 | 17.61 | -12.78 | 0.1261 | -0.0456 | |||
| CRM / Salesforce, Inc. | 0.06 | -86.48 | 17.02 | -86.26 | 0.1218 | -0.9312 | |||
| C / Citigroup Inc. | 0.20 | 16.80 | 0.1203 | 0.1203 | |||||
| BSX / Boston Scientific Corporation | 0.15 | 16.31 | 0.1168 | 0.1168 | |||||
| LMT / Lockheed Martin Corporation | 0.03 | -12.58 | 16.07 | -9.37 | 0.1150 | -0.0357 | |||
| FI / Fiserv, Inc. | 0.09 | -14.11 | 15.68 | -32.94 | 0.1123 | -0.0866 | |||
| BAC / Bank of America Corporation | 0.33 | 15.39 | 0.1102 | 0.1102 | |||||
| PEP / PepsiCo, Inc. | 0.11 | -82.49 | 14.79 | -84.58 | 0.1059 | -0.7096 | |||
| ITW / Illinois Tool Works Inc. | 0.06 | -11.29 | 14.15 | -11.56 | 0.1013 | -0.0348 | |||
| KKR / KKR & Co. Inc. | 0.10 | -11.54 | 13.42 | 1.80 | 0.0961 | -0.0160 | |||
| CAT / Caterpillar Inc. | 0.03 | -15.62 | 13.20 | -0.67 | 0.0945 | -0.0185 | |||
| BA / The Boeing Company | 0.06 | -15.18 | 12.82 | 4.21 | 0.0918 | -0.0128 | |||
| BMY / Bristol-Myers Squibb Company | 0.23 | 10.83 | 0.0775 | 0.0775 | |||||
| BLACKROCK GLOBAL / STIV (000000000) | 10.46 | 10.46 | 0.0749 | 0.0749 | |||||
| ECL / Ecolab Inc. | 0.04 | -71.36 | 9.83 | -69.56 | 0.0704 | -0.2042 | |||
| KMB / Kimberly-Clark Corporation | 0.07 | -10.80 | 9.21 | -19.14 | 0.0659 | -0.0309 | |||
| TDG / TransDigm Group Incorporated | 0.01 | -10.83 | 8.77 | -1.97 | 0.0628 | -0.0133 | |||
| HCA / HCA Healthcare, Inc. | 0.02 | -17.21 | 8.46 | -8.22 | 0.0605 | -0.0178 | |||
| SBUX / Starbucks Corporation | 0.09 | -82.63 | 8.23 | -83.78 | 0.0589 | -0.3723 | |||
| SCHW / The Charles Schwab Corporation | 0.09 | -8.65 | 8.12 | 6.46 | 0.0581 | -0.0067 | |||
| MMM / 3M Company | 0.05 | -13.00 | 7.88 | -9.81 | 0.0564 | -0.0179 | |||
| MMC / Marsh & McLennan Companies, Inc. | 0.03 | -12.08 | 7.63 | -21.23 | 0.0547 | -0.0278 | |||
| MCD / McDonald's Corporation | 0.02 | -11.05 | 7.05 | -16.80 | 0.0505 | -0.0216 | |||
| GS / The Goldman Sachs Group, Inc. | 0.01 | -79.52 | 6.92 | -73.46 | 0.0495 | -0.1721 | |||
| UNP / Union Pacific Corporation | 0.03 | -83.65 | 6.48 | -84.08 | 0.0464 | -0.2998 | |||
| AZO / AutoZone, Inc. | 0.00 | -82.83 | 5.79 | -83.28 | 0.0415 | -0.2532 | |||
| PGR / The Progressive Corporation | 0.02 | -93.95 | 4.68 | -94.29 | 0.0335 | -0.6638 | |||
| BAM / Brookfield Asset Management Ltd. | 0.08 | 4.35 | 0.0312 | 0.0312 | |||||
| CI / The Cigna Group | 0.01 | -11.84 | 4.20 | -11.42 | 0.0300 | -0.0102 | |||
| PSA / Public Storage | 0.01 | -12.21 | 3.64 | -13.93 | 0.0261 | -0.0099 | |||
| MSTR / Strategy Inc | 0.01 | 3.34 | 0.0239 | 0.0239 | |||||
| DELL / Dell Technologies Inc. | 0.03 | 1.53 | 3.18 | 36.55 | 0.0228 | 0.0030 | |||
| AJG / Arthur J. Gallagher & Co. | 0.01 | 2.95 | 0.0211 | 0.0211 | |||||
| MRVL / Marvell Technology, Inc. | 0.04 | -10.67 | 2.79 | 12.29 | 0.0199 | -0.0012 | |||
| WMB / The Williams Companies, Inc. | 0.04 | 2.42 | 0.0173 | 0.0173 | |||||
| E-MINI RUSS 1000 G / DE (000000000) | 0.95 | 0.0068 | 0.0068 | ||||||
| IBKR / Interactive Brokers Group, Inc. | 0.01 | 0.75 | 0.0054 | 0.0054 |