Mga Batayang Estadistika
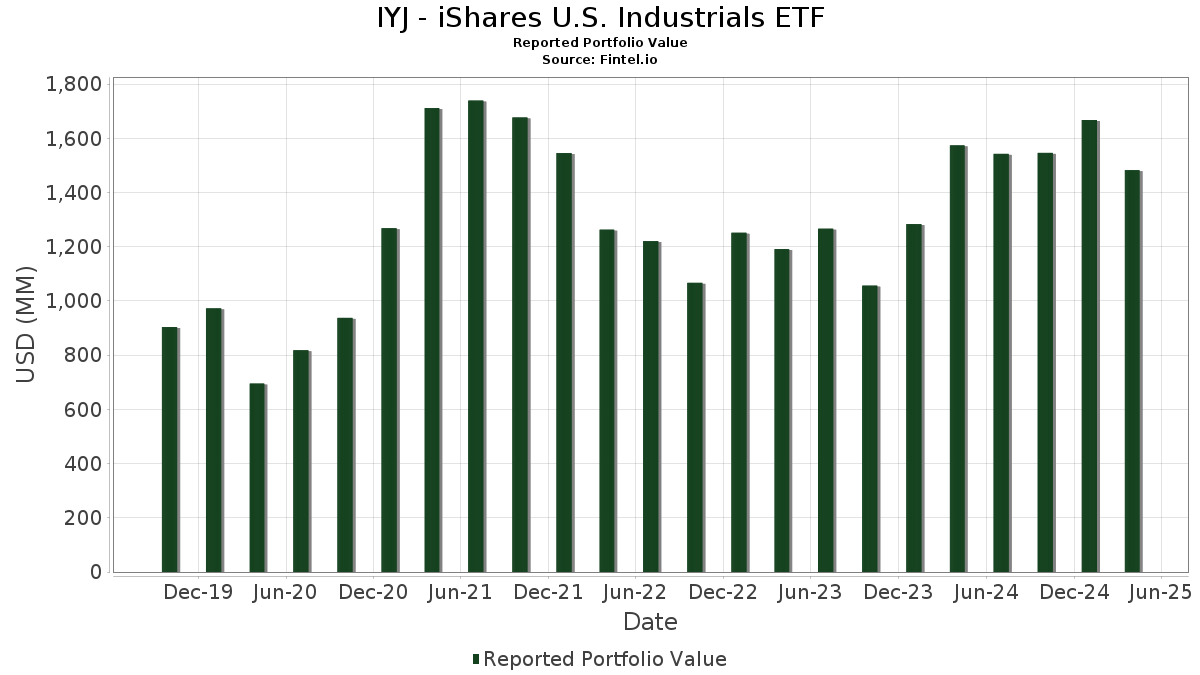
| Nilai Portofolio | $ 1,482,372,074 |
| Posisi Saat Ini | 194 |
Kepemilikan Terbaru, Kinerja, AUM (dari 13F, 13D)
IYJ - iShares U.S. Industrials ETF telah mengungkapkan total kepemilikan 194 dalam pengajuan SEC terbaru mereka. Nilai portofolio terbaru dihitung sebesar $ 1,482,372,074 USD. Aset yang Dikelola (AUM) sebenarnya adalah nilai ini ditambah kas (yang tidak diungkapkan). Aset-aset utama IYJ - iShares U.S. Industrials ETF adalah Visa Inc. (US:V) , Mastercard Incorporated (US:MA) , General Electric Company (US:GE) , Accenture plc (US:ACN) , and RTX Corporation (US:RTX) .
Peningkatan Tertinggi Kuartal Ini
Kami menggunakan perubahan dalam alokasi portofolio karena ini adalah metrik yang paling bermakna. Perubahan dapat disebabkan oleh perdagangan atau perubahan harga saham.
| Keamanan | Saham (MM) |
Nilai (Juta Dolar AS) |
Portfolio % | ΔPorsyento ng Portfolio |
|---|---|---|---|---|
| 0.39 | 135.63 | 9.1773 | 1.5030 | |
| 0.19 | 101.70 | 6.8815 | 0.4270 | |
| 0.17 | 31.19 | 2.1106 | 0.3311 | |
| 0.24 | 49.36 | 3.3400 | 0.2177 | |
| 0.05 | 19.74 | 1.3359 | 0.1658 | |
| 0.05 | 22.92 | 1.5511 | 0.1598 | |
| 0.06 | 16.91 | 1.1439 | 0.1441 | |
| 5.07 | 5.07 | 0.3433 | 0.1439 | |
| 0.30 | 38.16 | 2.5823 | 0.1389 | |
| 0.08 | 16.65 | 1.1268 | 0.1387 |
Penurunan Tertinggi Kuartal Ini
Kami menggunakan perubahan dalam alokasi portofolio karena ini adalah metrik yang paling bermakna. Perubahan dapat disebabkan oleh perdagangan atau perubahan harga saham.
| Keamanan | Saham (MM) |
Nilai (Juta Dolar AS) |
Portfolio % | ΔPorsyento ng Portfolio |
|---|---|---|---|---|
| 0.14 | 42.71 | 2.8902 | -0.5518 | |
| 0.11 | 33.97 | 2.2984 | -0.2897 | |
| 0.13 | 33.59 | 2.2726 | -0.2657 | |
| 0.23 | 15.02 | 1.0164 | -0.2492 | |
| 0.13 | 7.39 | 0.4999 | -0.2188 | |
| 0.05 | 10.60 | 0.7174 | -0.1369 | |
| 0.13 | 23.78 | 1.6092 | -0.1342 | |
| 0.13 | 13.66 | 0.9246 | -0.1334 | |
| 0.14 | 29.94 | 2.0257 | -0.1284 | |
| 0.17 | 15.81 | 1.0696 | -0.1169 |
Pengajuan 13F dan Dana
Formulir ini diajukan pada 2025-06-23 untuk periode pelaporan 2025-04-30. Klik ikon tautan untuk melihat riwayat transaksi selengkapnya.
Tingkatkan ke versi premium untuk membuka data premium dan ekspor ke Excel. ![]() .
.
| Keamanan | Ketik | Harga Saham Rata-rata | Saham (MM) |
ΔSaham (%) |
ΔSaham (%) |
Nilai ($MM) |
Portpolyo (%) |
ΔPortofolio (%) |
|
|---|---|---|---|---|---|---|---|---|---|
| V / Visa Inc. | 0.39 | 5.04 | 135.63 | 6.18 | 9.1773 | 1.5030 | |||
| MA / Mastercard Incorporated | 0.19 | -4.06 | 101.70 | -5.34 | 6.8815 | 0.4270 | |||
| GE / General Electric Company | 0.24 | -4.06 | 49.36 | -5.02 | 3.3400 | 0.2177 | |||
| ACN / Accenture plc | 0.14 | -4.06 | 42.71 | -25.45 | 2.8902 | -0.5518 | |||
| RTX / RTX Corporation | 0.30 | -4.06 | 38.16 | -6.16 | 2.5823 | 0.1389 | |||
| CAT / Caterpillar Inc. | 0.11 | -5.30 | 33.97 | -21.15 | 2.2984 | -0.2897 | |||
| AXP / American Express Company | 0.13 | -5.27 | 33.59 | -20.50 | 2.2726 | -0.2657 | |||
| HON / Honeywell International Inc. | 0.15 | -4.06 | 31.21 | -9.73 | 2.1120 | 0.0346 | |||
| BA / The Boeing Company | 0.17 | 1.45 | 31.19 | 5.31 | 2.1106 | 0.3311 | |||
| UNP / Union Pacific Corporation | 0.14 | -4.06 | 29.94 | -16.50 | 2.0257 | -0.1284 | |||
| ADP / Automatic Data Processing, Inc. | 0.09 | -4.06 | 28.12 | -4.82 | 1.9026 | 0.1277 | |||
| ETN / Eaton Corporation plc | 0.09 | -4.06 | 26.43 | -13.49 | 1.7886 | -0.0471 | |||
| DE / Deere & Company | 0.06 | -5.20 | 26.29 | -7.78 | 1.7786 | 0.0661 | |||
| FI / Fiserv, Inc. | 0.13 | -4.07 | 23.78 | -18.04 | 1.6092 | -0.1342 | |||
| GEV / GE Vernova Inc. | 0.06 | -4.07 | 22.98 | -4.60 | 1.5552 | 0.1077 | |||
| LMT / Lockheed Martin Corporation | 0.05 | -4.08 | 22.92 | -1.01 | 1.5511 | 0.1598 | |||
| TT / Trane Technologies plc | 0.05 | -4.07 | 19.74 | 1.37 | 1.3359 | 0.1658 | |||
| SHW / The Sherwin-Williams Company | 0.05 | -4.07 | 18.83 | -5.47 | 1.2742 | 0.0774 | |||
| PH / Parker-Hannifin Corporation | 0.03 | -4.06 | 17.61 | -17.90 | 1.1916 | -0.0971 | |||
| TDG / TransDigm Group Incorporated | 0.01 | -4.06 | 17.50 | 0.18 | 1.1843 | 0.1346 | |||
| MMM / 3M Company | 0.12 | -4.06 | 17.19 | -12.44 | 1.1630 | -0.0163 | |||
| GD / General Dynamics Corporation | 0.06 | -4.06 | 16.91 | 1.59 | 1.1439 | 0.1441 | |||
| CTAS / Cintas Corporation | 0.08 | -4.06 | 16.65 | 1.26 | 1.1268 | 0.1387 | |||
| ITW / Illinois Tool Works Inc. | 0.07 | -4.07 | 15.98 | -11.20 | 1.0810 | 0.0002 | |||
| UPS / United Parcel Service, Inc. | 0.17 | -4.06 | 15.81 | -19.96 | 1.0696 | -0.1169 | |||
| COF / Capital One Financial Corporation | 0.09 | -4.06 | 15.53 | -15.10 | 1.0506 | -0.0482 | |||
| NOC / Northrop Grumman Corporation | 0.03 | -5.06 | 15.11 | -5.21 | 1.0225 | 0.0647 | |||
| PYPL / PayPal Holdings, Inc. | 0.23 | -4.06 | 15.02 | -28.69 | 1.0164 | -0.2492 | |||
| CRH / CRH plc | 0.16 | -4.06 | 14.91 | -7.56 | 1.0091 | 0.0398 | |||
| EMR / Emerson Electric Co. | 0.13 | -4.07 | 13.66 | -22.40 | 0.9246 | -0.1334 | |||
| HWM / Howmet Aerospace Inc. | 0.09 | -4.06 | 12.77 | 5.04 | 0.8643 | 0.1337 | |||
| JCI / Johnson Controls International plc | 0.15 | -5.19 | 12.59 | 1.98 | 0.8518 | 0.1101 | |||
| CSX / CSX Corporation | 0.44 | -4.07 | 12.31 | -18.08 | 0.8329 | -0.0698 | |||
| CARR / Carrier Global Corporation | 0.19 | -4.06 | 11.94 | -8.23 | 0.8076 | 0.0262 | |||
| NSC / Norfolk Southern Corporation | 0.05 | -4.06 | 11.52 | -15.80 | 0.7795 | -0.0425 | |||
| PAYX / Paychex, Inc. | 0.07 | -4.06 | 10.76 | -4.41 | 0.7283 | 0.0518 | |||
| FICO / Fair Isaac Corporation | 0.01 | -4.18 | 10.72 | 1.77 | 0.7255 | 0.0925 | |||
| FDX / FedEx Corporation | 0.05 | -6.10 | 10.60 | -25.44 | 0.7174 | -0.1369 | |||
| PCAR / PACCAR Inc | 0.12 | -4.07 | 10.55 | -21.95 | 0.7142 | -0.0983 | |||
| GWW / W.W. Grainger, Inc. | 0.01 | -4.02 | 10.14 | -7.49 | 0.6863 | 0.0276 | |||
| AXON / Axon Enterprise, Inc. | 0.02 | -3.05 | 10.12 | -8.83 | 0.6848 | 0.0179 | |||
| PWR / Quanta Services, Inc. | 0.03 | -4.05 | 9.67 | -8.70 | 0.6544 | 0.0179 | |||
| FIS / Fidelity National Information Services, Inc. | 0.12 | -5.33 | 9.67 | -8.34 | 0.6543 | 0.0205 | |||
| VRSK / Verisk Analytics, Inc. | 0.03 | -4.07 | 9.50 | -1.06 | 0.6428 | 0.0659 | |||
| LHX / L3Harris Technologies, Inc. | 0.04 | -4.06 | 9.48 | -0.44 | 0.6413 | 0.0694 | |||
| URI / United Rentals, Inc. | 0.01 | -4.05 | 9.40 | -20.08 | 0.6364 | -0.0706 | |||
| CMI / Cummins Inc. | 0.03 | -4.08 | 9.13 | -20.88 | 0.6178 | -0.0755 | |||
| AME / AMETEK, Inc. | 0.05 | -4.06 | 8.91 | -11.85 | 0.6026 | -0.0043 | |||
| OTIS / Otis Worldwide Corporation | 0.09 | -4.06 | 8.74 | -3.20 | 0.5914 | 0.0489 | |||
| VMC / Vulcan Materials Company | 0.03 | -4.04 | 7.90 | -8.19 | 0.5344 | 0.0176 | |||
| FERG / Ferguson Enterprises Inc. | 0.05 | -5.13 | 7.72 | -11.14 | 0.5224 | 0.0004 | |||
| XYZ / Block, Inc. | 0.13 | -4.07 | 7.39 | -38.24 | 0.4999 | -0.2188 | |||
| MLM / Martin Marietta Materials, Inc. | 0.01 | -4.09 | 7.30 | -7.64 | 0.4943 | 0.0191 | |||
| EFX / Equifax Inc. | 0.03 | -4.07 | 7.27 | -9.17 | 0.4918 | 0.0110 | |||
| WAB / Westinghouse Air Brake Technologies Corporation | 0.04 | -4.05 | 7.16 | -14.76 | 0.4847 | -0.0201 | |||
| IR / Ingersoll Rand Inc. | 0.09 | -4.07 | 6.92 | -22.86 | 0.4685 | -0.0707 | |||
| ODFL / Old Dominion Freight Line, Inc. | 0.04 | -4.06 | 6.74 | -20.76 | 0.4563 | -0.0551 | |||
| XYL / Xylem Inc. | 0.05 | -4.06 | 6.63 | -6.75 | 0.4484 | 0.0215 | |||
| ROK / Rockwell Automation, Inc. | 0.03 | -5.35 | 6.37 | -15.81 | 0.4310 | -0.0235 | |||
| DD / DuPont de Nemours, Inc. | 0.10 | -4.06 | 6.28 | -17.56 | 0.4248 | -0.0327 | |||
| KEYS / Keysight Technologies, Inc. | 0.04 | -4.06 | 5.76 | -21.80 | 0.3899 | -0.0527 | |||
| PPG / PPG Industries, Inc. | 0.05 | -4.08 | 5.72 | -9.49 | 0.3873 | 0.0073 | |||
| FTV / Fortive Corporation | 0.08 | -4.06 | 5.50 | -17.78 | 0.3720 | -0.0298 | |||
| VLTO / Veralto Corporation | 0.06 | -4.06 | 5.39 | -11.00 | 0.3645 | 0.0008 | |||
| DOV / Dover Corporation | 0.03 | -4.20 | 5.32 | -19.74 | 0.3602 | -0.0383 | |||
| US0669225197 / BlackRock Cash Funds: Institutional, SL Agency Shares | 5.07 | 52.92 | 5.07 | 52.89 | 0.3433 | 0.1439 | |||
| MTD / Mettler-Toledo International Inc. | 0.00 | -5.46 | 5.06 | -25.83 | 0.3426 | -0.0675 | |||
| FLT / Corpay, Inc. | 0.02 | -4.06 | 4.99 | -17.96 | 0.3379 | -0.0278 | |||
| SW / Smurfit Westrock Plc | 0.12 | -4.07 | 4.94 | -24.07 | 0.3343 | -0.0566 | |||
| TDY / Teledyne Technologies Incorporated | 0.01 | -4.13 | 4.91 | -12.63 | 0.3320 | -0.0054 | |||
| DOW / Dow Inc. | 0.16 | -4.06 | 4.90 | -24.85 | 0.3314 | -0.0601 | |||
| AMCR / Amcor plc | 0.53 | 54.13 | 4.84 | 45.91 | 0.3273 | 0.1281 | |||
| SYF / Synchrony Financial | 0.09 | -4.06 | 4.59 | -27.76 | 0.3108 | -0.0712 | |||
| HUBB / Hubbell Incorporated | 0.01 | -4.13 | 4.42 | -17.70 | 0.2993 | -0.0236 | |||
| GPN / Global Payments Inc. | 0.06 | -4.07 | 4.42 | -35.14 | 0.2989 | -0.1102 | |||
| EME / EMCOR Group, Inc. | 0.01 | -4.03 | 4.15 | -14.17 | 0.2807 | -0.0097 | |||
| LII / Lennox International Inc. | 0.01 | -4.11 | 3.98 | -11.49 | 0.2696 | -0.0009 | |||
| CSL / Carlisle Companies Incorporated | 0.01 | -4.09 | 3.89 | -6.55 | 0.2634 | 0.0131 | |||
| PKG / Packaging Corporation of America | 0.02 | -4.09 | 3.74 | -16.29 | 0.2532 | -0.0154 | |||
| HEIA / Heico Corp. - Class A | 0.02 | -4.18 | 3.71 | 1.15 | 0.2511 | 0.0307 | |||
| SNA / Snap-on Incorporated | 0.01 | -4.04 | 3.69 | -15.20 | 0.2500 | -0.0118 | |||
| TRU / TransUnion | 0.04 | -4.12 | 3.66 | -19.86 | 0.2477 | -0.0267 | |||
| WSO / Watsco, Inc. | 0.01 | -3.79 | 3.62 | -7.56 | 0.2449 | 0.0097 | |||
| BLL / Ball Corp. | 0.07 | -4.06 | 3.49 | -10.55 | 0.2359 | 0.0018 | |||
| EXPD / Expeditors International of Washington, Inc. | 0.03 | -5.37 | 3.48 | -8.44 | 0.2356 | 0.0072 | |||
| J / Jacobs Solutions Inc. | 0.03 | -4.04 | 3.47 | -15.24 | 0.2349 | -0.0111 | |||
| BAH / Booz Allen Hamilton Holding Corporation | 0.03 | -4.05 | 3.44 | -10.74 | 0.2329 | 0.0012 | |||
| TRMB / Trimble Inc. | 0.06 | -4.11 | 3.44 | -20.51 | 0.2329 | -0.0273 | |||
| PNR / Pentair plc | 0.04 | -3.80 | 3.42 | -15.81 | 0.2313 | -0.0127 | |||
| FIX / Comfort Systems USA, Inc. | 0.01 | -4.22 | 3.18 | -12.82 | 0.2150 | -0.0040 | |||
| GGG / Graco Inc. | 0.04 | -4.29 | 3.10 | -7.19 | 0.2098 | 0.0091 | |||
| RPM / RPM International Inc. | 0.03 | -4.12 | 3.09 | -19.15 | 0.2088 | -0.0205 | |||
| BLDR / Builders FirstSource, Inc. | 0.03 | -5.17 | 3.08 | -32.18 | 0.2085 | -0.0645 | |||
| IEX / IDEX Corporation | 0.02 | -4.13 | 3.00 | -25.65 | 0.2028 | -0.0394 | |||
| CW / Curtiss-Wright Corporation | 0.01 | -4.29 | 2.99 | -4.84 | 0.2024 | 0.0135 | |||
| TXT / Textron Inc. | 0.04 | -4.28 | 2.99 | -11.96 | 0.2022 | -0.0017 | |||
| MAS / Masco Corporation | 0.05 | -4.06 | 2.97 | -26.66 | 0.2011 | -0.0423 | |||
| ACM / AECOM | 0.03 | -5.06 | 2.97 | -11.19 | 0.2010 | 0.0001 | |||
| AFRM / Affirm Holdings, Inc. | 0.06 | -4.05 | 2.93 | -21.83 | 0.1985 | -0.0269 | |||
| ZBRA / Zebra Technologies Corporation | 0.01 | -4.13 | 2.91 | -38.78 | 0.1970 | -0.0887 | |||
| JKHY / Jack Henry & Associates, Inc. | 0.02 | -4.28 | 2.86 | -4.63 | 0.1936 | 0.0133 | |||
| OC / Owens Corning | 0.02 | -5.18 | 2.82 | -25.30 | 0.1911 | -0.0360 | |||
| ALLE / Allegion plc | 0.02 | -3.92 | 2.78 | 0.76 | 0.1880 | 0.0223 | |||
| XPO / XPO, Inc. | 0.03 | -3.82 | 2.76 | -23.67 | 0.1866 | -0.0304 | |||
| ITT / ITT Inc. | 0.02 | -4.31 | 2.57 | -13.19 | 0.1737 | -0.0039 | |||
| CCK / Crown Holdings, Inc. | 0.03 | -4.28 | 2.56 | 4.96 | 0.1733 | 0.0267 | |||
| HEI / HEICO Corporation | 0.01 | -3.38 | 2.52 | 1.41 | 0.1707 | 0.0212 | |||
| WWD / Woodward, Inc. | 0.01 | -4.01 | 2.51 | -2.82 | 0.1700 | 0.0147 | |||
| NDSN / Nordson Corporation | 0.01 | -4.05 | 2.45 | -17.39 | 0.1656 | -0.0124 | |||
| JBHT / J.B. Hunt Transport Services, Inc. | 0.02 | -4.03 | 2.41 | -26.82 | 0.1629 | -0.0347 | |||
| CHRW / C.H. Robinson Worldwide, Inc. | 0.03 | -4.15 | 2.36 | -14.05 | 0.1595 | -0.0053 | |||
| CNH / CNH Industrial N.V. | 0.20 | -4.42 | 2.30 | -14.17 | 0.1554 | -0.0053 | |||
| CNM / Core & Main, Inc. | 0.04 | -5.17 | 2.27 | -11.48 | 0.1539 | -0.0005 | |||
| BWXT / BWX Technologies, Inc. | 0.02 | -4.43 | 2.26 | -7.64 | 0.1530 | 0.0059 | |||
| ATR / AptarGroup, Inc. | 0.02 | -4.37 | 2.25 | -8.76 | 0.1522 | 0.0041 | |||
| LECO / Lincoln Electric Holdings, Inc. | 0.01 | -4.41 | 2.21 | -15.29 | 0.1496 | -0.0072 | |||
| SWK / Stanley Black & Decker, Inc. | 0.03 | -4.28 | 2.10 | -34.77 | 0.1419 | -0.0513 | |||
| NVT / nVent Electric plc | 0.04 | -3.75 | 2.06 | -18.82 | 0.1396 | -0.0131 | |||
| HII / Huntington Ingalls Industries, Inc. | 0.01 | -4.22 | 2.04 | 11.84 | 0.1381 | 0.0285 | |||
| BLD / TopBuild Corp. | 0.01 | -6.12 | 1.98 | -19.01 | 0.1341 | -0.0129 | |||
| APG / APi Group Corporation | 0.05 | -3.37 | 1.98 | -4.21 | 0.1339 | 0.0098 | |||
| G / Genpact Limited | 0.04 | -5.87 | 1.96 | -2.82 | 0.1328 | 0.0114 | |||
| PCTY / Paylocity Holding Corporation | 0.01 | -4.07 | 1.91 | -10.34 | 0.1291 | 0.0013 | |||
| TTEK / Tetra Tech, Inc. | 0.06 | -4.39 | 1.89 | -19.00 | 0.1279 | -0.0122 | |||
| AOS / A. O. Smith Corporation | 0.03 | -4.18 | 1.83 | -3.39 | 0.1236 | 0.0100 | |||
| MTZ / MasTec, Inc. | 0.01 | -4.54 | 1.81 | -16.25 | 0.1228 | -0.0074 | |||
| ALSN / Allison Transmission Holdings, Inc. | 0.02 | -4.15 | 1.81 | -24.80 | 0.1225 | -0.0221 | |||
| WMS / Advanced Drainage Systems, Inc. | 0.02 | -4.24 | 1.81 | -10.09 | 0.1223 | 0.0015 | |||
| US0669224778 / BlackRock Cash Funds: Treasury, SL Agency Shares | 1.80 | -30.30 | 1.80 | -30.29 | 0.1221 | -0.0334 | |||
| DCI / Donaldson Company, Inc. | 0.03 | -4.14 | 1.80 | -11.50 | 0.1218 | -0.0004 | |||
| CR / Crane Company | 0.01 | -4.24 | 1.80 | -9.52 | 0.1216 | 0.0023 | |||
| EXP / Eagle Materials Inc. | 0.01 | -3.34 | 1.73 | -14.76 | 0.1169 | -0.0049 | |||
| GPK / Graphic Packaging Holding Company | 0.07 | -3.37 | 1.72 | -10.86 | 0.1166 | 0.0005 | |||
| AYI / Acuity Inc. | 0.01 | -4.49 | 1.70 | -29.99 | 0.1153 | -0.0310 | |||
| AXTA / Axalta Coating Systems Ltd. | 0.05 | -4.24 | 1.62 | -13.42 | 0.1096 | -0.0028 | |||
| MIDD / The Middleby Corporation | 0.01 | -4.93 | 1.61 | -25.95 | 0.1089 | -0.0216 | |||
| US7587501039 / Regal-Beloit Corp. | 0.02 | -4.37 | 1.60 | -36.25 | 0.1081 | -0.0424 | |||
| AZEK / The AZEK Company Inc. | 0.03 | -6.11 | 1.59 | -9.13 | 0.1078 | 0.0024 | |||
| TTC / The Toro Company | 0.02 | -5.37 | 1.57 | -22.42 | 0.1064 | -0.0153 | |||
| WCC / WESCO International, Inc. | 0.01 | -3.37 | 1.57 | -14.87 | 0.1062 | -0.0046 | |||
| ESAB / ESAB Corporation | 0.01 | -4.24 | 1.55 | -7.13 | 0.1050 | 0.0046 | |||
| ATI / ATI Inc. | 0.03 | -4.57 | 1.53 | -9.12 | 0.1032 | 0.0024 | |||
| GNRC / Generac Holdings Inc. | 0.01 | -5.99 | 1.51 | -28.01 | 0.1020 | -0.0238 | |||
| FBHS / Fortune Brands Home & Security Inc | 0.03 | -4.19 | 1.51 | -28.08 | 0.1020 | -0.0239 | |||
| SSD / Simpson Manufacturing Co., Inc. | 0.01 | -4.24 | 1.49 | -12.43 | 0.1007 | -0.0014 | |||
| SAIA / Saia, Inc. | 0.01 | -4.24 | 1.47 | -51.34 | 0.0995 | -0.0820 | |||
| AWI / Armstrong World Industries, Inc. | 0.01 | -3.41 | 1.44 | -7.23 | 0.0973 | 0.0042 | |||
| TREX / Trex Company, Inc. | 0.02 | -3.38 | 1.41 | -23.32 | 0.0957 | -0.0151 | |||
| AAON / AAON, Inc. | 0.02 | -3.36 | 1.41 | -24.21 | 0.0953 | -0.0164 | |||
| KNX / Knight-Swift Transportation Holdings Inc. | 0.04 | -4.48 | 1.39 | -34.46 | 0.0943 | -0.0335 | |||
| FLS / Flowserve Corporation | 0.03 | -4.55 | 1.35 | -31.09 | 0.0914 | -0.0263 | |||
| VMI / Valmont Industries, Inc. | 0.00 | -4.40 | 1.33 | -15.50 | 0.0900 | -0.0046 | |||
| FCN / FTI Consulting, Inc. | 0.01 | -4.59 | 1.33 | -18.81 | 0.0900 | -0.0084 | |||
| MSA / MSA Safety Incorporated | 0.01 | -4.66 | 1.32 | -8.88 | 0.0896 | 0.0023 | |||
| R / Ryder System, Inc. | 0.01 | -3.41 | 1.31 | -16.56 | 0.0887 | -0.0057 | |||
| MHK / Mohawk Industries, Inc. | 0.01 | -3.35 | 1.28 | -15.94 | 0.0864 | -0.0049 | |||
| WEX / WEX Inc. | 0.01 | 2.55 | 1.26 | -27.33 | 0.0850 | -0.0188 | |||
| KEX / Kirby Corporation | 0.01 | -6.37 | 1.25 | -17.31 | 0.0844 | -0.0062 | |||
| OSK / Oshkosh Corporation | 0.01 | -4.36 | 1.25 | -31.14 | 0.0844 | -0.0245 | |||
| LPX / Louisiana-Pacific Corporation | 0.01 | -3.40 | 1.24 | -28.70 | 0.0837 | -0.0206 | |||
| AGCO / AGCO Corporation | 0.01 | -4.42 | 1.21 | -22.36 | 0.0816 | -0.0117 | |||
| FOUR / Shift4 Payments, Inc. | 0.01 | -3.35 | 1.15 | -34.04 | 0.0779 | -0.0270 | |||
| AL / Air Lease Corporation | 0.02 | -4.68 | 1.11 | -3.56 | 0.0753 | 0.0060 | |||
| VNT / Vontier Corporation | 0.03 | -3.38 | 1.09 | -20.29 | 0.0739 | -0.0084 | |||
| LSTR / Landstar System, Inc. | 0.01 | -4.59 | 1.08 | -22.25 | 0.0728 | -0.0104 | |||
| CGNX / Cognex Corporation | 0.04 | -4.81 | 1.07 | -34.92 | 0.0722 | -0.0262 | |||
| MKSI / MKS Inc. | 0.02 | -4.51 | 1.07 | -40.91 | 0.0722 | -0.0362 | |||
| BILL / BILL Holdings, Inc. | 0.02 | -3.38 | 1.05 | -54.50 | 0.0712 | -0.0677 | |||
| WSC / WillScot Holdings Corporation | 0.04 | -3.37 | 1.03 | -34.54 | 0.0697 | -0.0248 | |||
| GTES / Gates Industrial Corporation plc | 0.05 | -3.38 | 1.03 | -11.64 | 0.0694 | -0.0003 | |||
| RHI / Robert Half Inc. | 0.02 | -3.38 | 1.02 | -33.96 | 0.0693 | -0.0238 | |||
| LFUS / Littelfuse, Inc. | 0.01 | -3.31 | 1.02 | -26.10 | 0.0692 | -0.0139 | |||
| SLGN / Silgan Holdings Inc. | 0.02 | -3.38 | 0.98 | -9.25 | 0.0664 | 0.0014 | |||
| GXO / GXO Logistics, Inc. | 0.03 | -4.96 | 0.97 | -24.22 | 0.0654 | -0.0112 | |||
| SPR / Spirit AeroSystems Holdings, Inc. | 0.03 | -3.36 | 0.96 | 2.35 | 0.0650 | 0.0086 | |||
| EEFT / Euronet Worldwide, Inc. | 0.01 | -6.15 | 0.93 | -5.57 | 0.0631 | 0.0038 | |||
| SON / Sonoco Products Company | 0.02 | -4.84 | 0.91 | -18.12 | 0.0618 | -0.0052 | |||
| SEE / Sealed Air Corporation | 0.03 | 0.00 | 0.86 | -20.94 | 0.0580 | -0.0071 | |||
| MSM / MSC Industrial Direct Co., Inc. | 0.01 | -5.13 | 0.80 | -9.81 | 0.0542 | 0.0009 | |||
| LOAR / Loar Holdings Inc. | 0.01 | 11.50 | 0.75 | 32.63 | 0.0509 | 0.0169 | |||
| AMTM / Amentum Holdings, Inc. | 0.03 | 10.37 | 0.74 | 14.88 | 0.0502 | 0.0114 | |||
| ST / Sensata Technologies Holding plc | 0.03 | -3.38 | 0.73 | -23.90 | 0.0494 | -0.0082 | |||
| BC / Brunswick Corporation | 0.02 | -3.40 | 0.69 | -34.06 | 0.0468 | -0.0162 | |||
| ADT / ADT Inc. | 0.09 | 8.74 | 0.68 | 13.48 | 0.0462 | 0.0101 | |||
| SARO / StandardAero, Inc. | 0.02 | 46.00 | 0.65 | 47.15 | 0.0437 | 0.0173 | |||
| WU / The Western Union Company | 0.06 | -1.52 | 0.64 | -5.43 | 0.0436 | 0.0027 | |||
| CXT / Crane NXT, Co. | 0.01 | -5.63 | 0.52 | -30.81 | 0.0353 | -0.0100 | |||
| ECG / Everus Construction Group, Inc. | 0.01 | -3.37 | 0.47 | -43.51 | 0.0318 | -0.0182 | |||
| MAN / ManpowerGroup Inc. | 0.01 | -6.53 | 0.45 | -33.14 | 0.0307 | -0.0101 | |||
| HAYW / Hayward Holdings, Inc. | 0.03 | -3.36 | 0.43 | -14.57 | 0.0294 | -0.0011 | |||
| SNDR / Schneider National, Inc. | 0.01 | -3.39 | 0.23 | -30.09 | 0.0156 | -0.0042 | |||
| VSTS / Vestis Corporation | 0.03 | -16.43 | 0.23 | -47.70 | 0.0154 | -0.0107 | |||
| XAI EMINI INDUSTR JUN25 / DE (N/A) | 0.06 | 0.0040 | 0.0040 | ||||||
| XAK TECHNOLOGY JUN25 / DE (N/A) | 0.03 | 0.0019 | 0.0019 |