Mga Batayang Estadistika
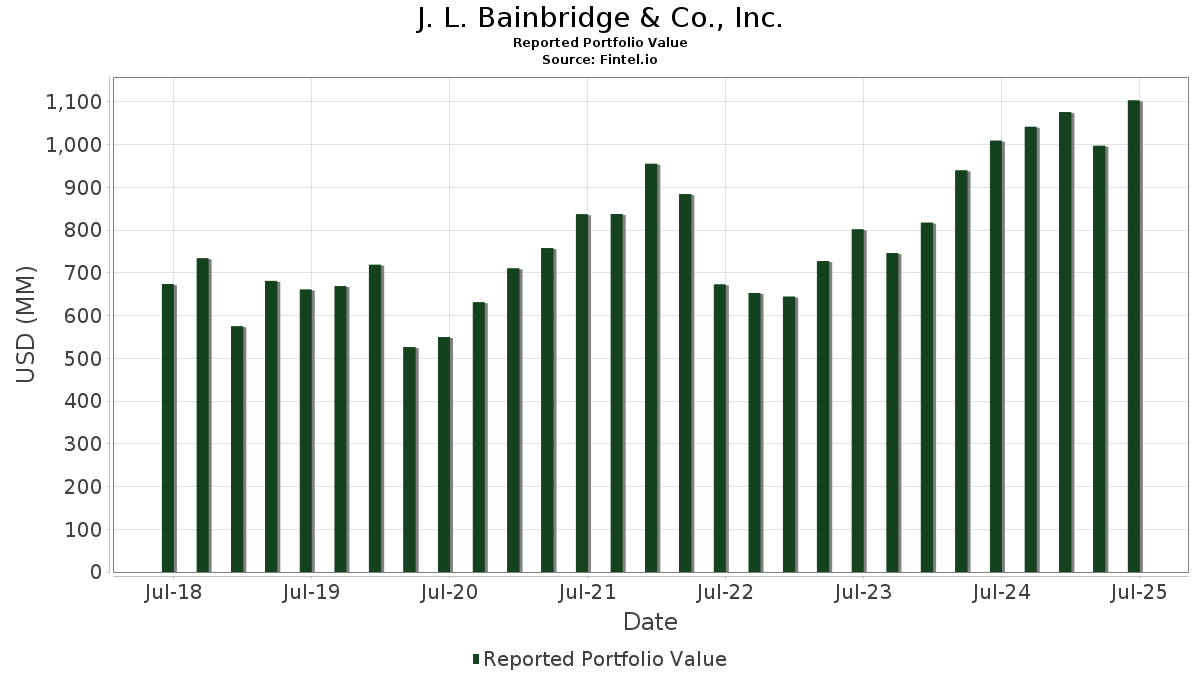
| Nilai Portofolio | $ 1,103,309,238 |
| Posisi Saat Ini | 105 |
Kepemilikan Terbaru, Kinerja, AUM (dari 13F, 13D)
J. L. Bainbridge & Co., Inc. telah mengungkapkan total kepemilikan 105 dalam pengajuan SEC terbaru mereka. Nilai portofolio terbaru dihitung sebesar $ 1,103,309,238 USD. Aset yang Dikelola (AUM) sebenarnya adalah nilai ini ditambah kas (yang tidak diungkapkan). Aset-aset utama J. L. Bainbridge & Co., Inc. adalah Microsoft Corporation (US:MSFT) , Apple Inc. (US:AAPL) , The Goldman Sachs Group, Inc. (US:GS) , Eaton Corporation plc (US:ETN) , and Amazon.com, Inc. (US:AMZN) . Posisi baru J. L. Bainbridge & Co., Inc. meliputi: iShares Trust - iShares Large Cap Max Buffer Mar ETF (US:MMAX) , Zebra Technologies Corporation (US:ZBRA) , GE Vernova Inc. (US:GEV) , iShares Gold Trust (US:IAU) , and Sun Life Financial Inc. (US:SLF) .
Peningkatan Tertinggi Kuartal Ini
Kami menggunakan perubahan dalam alokasi portofolio karena ini adalah metrik yang paling bermakna. Perubahan dapat disebabkan oleh perdagangan atau perubahan harga saham.
| Keamanan | Saham (MM) |
Nilai (Juta Dolar AS) |
Portfolio % | ΔPorsyento ng Portfolio |
|---|---|---|---|---|
| 0.32 | 159.90 | 14.4495 | 2.1384 | |
| 0.95 | 26.09 | 2.3575 | 1.9785 | |
| 0.09 | 64.04 | 5.7867 | 0.8829 | |
| 0.16 | 57.48 | 5.1939 | 0.7388 | |
| 0.07 | 50.84 | 4.5941 | 0.6619 | |
| 0.16 | 36.43 | 3.2919 | 0.5831 | |
| 0.11 | 28.75 | 2.5981 | 0.4588 | |
| 0.15 | 3.91 | 0.3546 | 0.3546 | |
| 0.21 | 26.54 | 2.3987 | 0.2345 | |
| 0.24 | 52.40 | 4.7349 | 0.1649 |
Penurunan Tertinggi Kuartal Ini
Kami menggunakan perubahan dalam alokasi portofolio karena ini adalah metrik yang paling bermakna. Perubahan dapat disebabkan oleh perdagangan atau perubahan harga saham.
| Keamanan | Saham (MM) |
Nilai (Juta Dolar AS) |
Portfolio % | ΔPorsyento ng Portfolio |
|---|---|---|---|---|
| 0.01 | 1.31 | 0.1183 | -2.1287 | |
| 0.50 | 102.29 | 9.2438 | -1.9762 | |
| 0.25 | 43.57 | 3.9372 | -1.0494 | |
| 0.05 | 23.97 | 2.1664 | -0.5280 | |
| 0.12 | 38.66 | 3.4939 | -0.3751 | |
| 0.12 | 15.37 | 1.3885 | -0.3200 | |
| 0.04 | 6.61 | 0.5970 | -0.3151 | |
| 0.21 | 33.35 | 3.0139 | -0.2543 | |
| 0.60 | 29.34 | 2.6511 | -0.2072 | |
| 0.07 | 18.12 | 1.6377 | -0.1348 |
Pengajuan 13F dan Dana
Formulir ini diajukan pada 2025-08-12 untuk periode pelaporan 2025-06-30. Klik ikon tautan untuk melihat riwayat transaksi selengkapnya.
Tingkatkan ke versi premium untuk membuka data premium dan ekspor ke Excel. ![]() .
.
| Keamanan | Ketik | Harga Saham Rata-rata | Saham (MM) |
ΔSaham (%) |
ΔSaham (%) |
Nilai ($MM) |
Portpolyo (%) |
ΔPortofolio (%) |
|
|---|---|---|---|---|---|---|---|---|---|
| MSFT / Microsoft Corporation | 0.32 | -1.72 | 159.90 | 30.23 | 14.4495 | 2.1384 | |||
| AAPL / Apple Inc. | 0.50 | -1.03 | 102.29 | -8.59 | 9.2438 | -1.9762 | |||
| GS / The Goldman Sachs Group, Inc. | 0.09 | 1.06 | 64.04 | 30.93 | 5.7867 | 0.8829 | |||
| ETN / Eaton Corporation plc | 0.16 | -1.50 | 57.48 | 29.35 | 5.1939 | 0.7388 | |||
| AMZN / Amazon.com, Inc. | 0.24 | -0.30 | 52.40 | 14.96 | 4.7349 | 0.1649 | |||
| META / Meta Platforms, Inc. | 0.07 | 1.23 | 50.84 | 29.63 | 4.5941 | 0.6619 | |||
| GOOGL / Alphabet Inc. | 0.27 | -1.18 | 47.46 | 12.62 | 4.2889 | 0.0633 | |||
| FI / Fiserv, Inc. | 0.25 | 12.21 | 43.57 | -12.39 | 3.9372 | -1.0494 | |||
| CI / The Cigna Group | 0.12 | -0.28 | 38.66 | 0.20 | 3.4939 | -0.3751 | |||
| GOOG / Alphabet Inc. | 0.22 | -1.24 | 38.20 | 12.13 | 3.4524 | 0.0362 | |||
| DAL / Delta Air Lines, Inc. | 0.77 | -1.31 | 37.76 | 11.32 | 3.4120 | 0.0112 | |||
| TSM / Taiwan Semiconductor Manufacturing Company Limited - Depositary Receipt (Common Stock) | 0.16 | -1.17 | 36.43 | 34.84 | 3.2919 | 0.5831 | |||
| SMAX / iShares Trust - iShares Large Cap Max Buffer Sep ETF | 1.38 | 3.99 | 35.94 | 8.15 | 3.2478 | -0.0845 | |||
| QCOM / QUALCOMM Incorporated | 0.21 | -1.31 | 33.35 | 2.32 | 3.0139 | -0.2543 | |||
| GM / General Motors Company | 0.60 | -1.65 | 29.34 | 2.92 | 2.6511 | -0.2072 | |||
| AXP / American Express Company | 0.09 | -2.54 | 29.33 | 15.54 | 2.6508 | 0.1053 | |||
| GE / General Electric Company | 0.11 | 4.78 | 28.75 | 34.75 | 2.5981 | 0.4588 | |||
| BX / Blackstone Inc. | 0.18 | 0.61 | 27.06 | 7.66 | 2.4454 | -0.0748 | |||
| DIS / The Walt Disney Company | 0.21 | -2.12 | 26.54 | 22.98 | 2.3987 | 0.2345 | |||
| MAXJ / iShares Trust - iShares Large Cap Max Buffer Jun ETF | 0.95 | 546.99 | 26.09 | 590.16 | 2.3575 | 1.9785 | |||
| BRK.B / Berkshire Hathaway Inc. | 0.05 | -2.19 | 23.97 | -10.79 | 2.1664 | -0.5280 | |||
| CRM / Salesforce, Inc. | 0.07 | 0.89 | 18.12 | 2.52 | 1.6377 | -0.1348 | |||
| BIIB / Biogen Inc. | 0.12 | -1.75 | 15.37 | -9.82 | 1.3885 | -0.3200 | |||
| NEE / NextEra Energy, Inc. | 0.12 | -1.64 | 8.52 | -3.69 | 0.7695 | -0.1169 | |||
| CI / The Cigna Group | Call | 0.02 | 0.00 | 6.61 | 0.47 | 0.5975 | -0.0623 | ||
| BDX / Becton, Dickinson and Company | 0.04 | -3.43 | 6.61 | -27.37 | 0.5970 | -0.3151 | |||
| GE / General Electric Company | Call | 0.02 | 0.00 | 5.15 | 28.58 | 0.4652 | 0.0638 | ||
| USB / U.S. Bancorp | 0.10 | 0.00 | 4.39 | 7.18 | 0.3964 | -0.0140 | |||
| MMAX / iShares Trust - iShares Large Cap Max Buffer Mar ETF | 0.15 | 3.91 | 0.3546 | 0.3546 | |||||
| NVDA / NVIDIA Corporation | 0.02 | 26.14 | 3.06 | 83.93 | 0.2762 | 0.1095 | |||
| VTI / Vanguard Index Funds - Vanguard Total Stock Market ETF | 0.01 | 0.00 | 2.62 | 10.60 | 0.2366 | -0.0008 | |||
| GM / General Motors Company | Call | 0.05 | 0.00 | 2.46 | 4.64 | 0.2223 | -0.0134 | ||
| QQQ / Invesco QQQ Trust, Series 1 | 0.00 | 0.66 | 2.28 | 18.43 | 0.2062 | 0.0129 | |||
| BLK / BlackRock, Inc. | 0.00 | 0.00 | 1.91 | 10.85 | 0.1728 | -0.0002 | |||
| PG / The Procter & Gamble Company | 0.01 | -2.06 | 1.45 | -8.48 | 0.1308 | -0.0277 | |||
| SCHW / The Charles Schwab Corporation | 0.02 | -7.65 | 1.43 | 7.66 | 0.1295 | -0.0040 | |||
| TSLA / Tesla, Inc. | 0.00 | 72.13 | 1.38 | 111.20 | 0.1248 | 0.0594 | |||
| JNJ / Johnson & Johnson | 0.01 | -93.66 | 1.31 | -94.16 | 0.1183 | -2.1287 | |||
| AVGO / Broadcom Inc. | 0.00 | 0.00 | 1.20 | 64.61 | 0.1085 | 0.0354 | |||
| SPY / SPDR S&P 500 ETF | 0.00 | 1.02 | 1.04 | 11.56 | 0.0942 | 0.0005 | |||
| DAL / Delta Air Lines, Inc. | Call | 0.02 | 0.00 | 0.98 | 12.73 | 0.0889 | 0.0015 | ||
| HD / The Home Depot, Inc. | 0.00 | -1.50 | 0.94 | -1.48 | 0.0846 | -0.0107 | |||
| TCBK / TriCo Bancshares | 0.02 | 0.00 | 0.93 | 1.31 | 0.0842 | -0.0080 | |||
| WMT / Walmart Inc. | 0.01 | -1.90 | 0.92 | 9.26 | 0.0832 | -0.0013 | |||
| JPM / JPMorgan Chase & Co. | 0.00 | -0.06 | 0.91 | 18.05 | 0.0822 | 0.0050 | |||
| VGT / Vanguard World Fund - Vanguard Information Technology ETF | 0.00 | 0.29 | 0.68 | 22.52 | 0.0615 | 0.0058 | |||
| NFLX / Netflix, Inc. | 0.00 | -4.56 | 0.67 | 36.94 | 0.0607 | 0.0116 | |||
| COST / Costco Wholesale Corporation | 0.00 | 7.25 | 0.66 | 12.27 | 0.0596 | 0.0007 | |||
| PM / Philip Morris International Inc. | 0.00 | 0.48 | 0.62 | 15.36 | 0.0557 | 0.0021 | |||
| T / AT&T Inc. | 0.02 | 1.70 | 0.62 | 4.06 | 0.0556 | -0.0037 | |||
| CVX / Chevron Corporation | 0.00 | 1.90 | 0.61 | -12.78 | 0.0555 | -0.0151 | |||
| XOM / Exxon Mobil Corporation | 0.01 | 0.46 | 0.61 | -8.96 | 0.0552 | -0.0121 | |||
| MCD / McDonald's Corporation | 0.00 | -0.10 | 0.60 | -6.51 | 0.0545 | -0.0102 | |||
| FNDA / Schwab Strategic Trust - Schwab Fundamental U.S. Small Company ETF | 0.02 | 0.00 | 0.51 | 4.71 | 0.0462 | -0.0028 | |||
| FNDX / Schwab Strategic Trust - Schwab Fundamental U.S. Large Company ETF | 0.02 | -6.53 | 0.51 | -2.87 | 0.0460 | -0.0065 | |||
| IVV / iShares Trust - iShares Core S&P 500 ETF | 0.00 | 0.00 | 0.48 | 10.53 | 0.0437 | -0.0002 | |||
| SCHX / Schwab Strategic Trust - Schwab U.S. Large-Cap ETF | 0.02 | -8.56 | 0.46 | 1.32 | 0.0416 | -0.0040 | |||
| BAC / Bank of America Corporation | 0.01 | -0.11 | 0.46 | 13.15 | 0.0413 | 0.0008 | |||
| SCHA / Schwab Strategic Trust - Schwab U.S. Small-Cap ETF | 0.02 | 0.03 | 0.43 | 8.23 | 0.0392 | -0.0011 | |||
| SO / The Southern Company | 0.00 | 1.59 | 0.42 | 1.47 | 0.0375 | -0.0035 | |||
| LLY / Eli Lilly and Company | 0.00 | 0.19 | 0.41 | -5.56 | 0.0369 | -0.0064 | |||
| IJH / iShares Trust - iShares Core S&P Mid-Cap ETF | 0.01 | 0.00 | 0.41 | 6.27 | 0.0368 | -0.0016 | |||
| KO / The Coca-Cola Company | 0.01 | -3.03 | 0.40 | -4.05 | 0.0364 | -0.0058 | |||
| TIP / iShares Trust - iShares TIPS Bond ETF | 0.00 | 0.17 | 0.39 | -0.77 | 0.0348 | -0.0041 | |||
| IBIT / iShares Bitcoin Trust ETF | 0.01 | 1.71 | 0.36 | 33.46 | 0.0328 | 0.0054 | |||
| ABBV / AbbVie Inc. | 0.00 | 1.54 | 0.36 | -9.90 | 0.0321 | -0.0075 | |||
| IBDQ / iShares Trust - iShares iBonds Dec 2025 Term Corporate ETF | 0.01 | 0.00 | 0.35 | 0.28 | 0.0320 | -0.0035 | |||
| COP / ConocoPhillips | 0.00 | 0.00 | 0.35 | -14.73 | 0.0320 | -0.0095 | |||
| ZBRA / Zebra Technologies Corporation | 0.00 | 0.34 | 0.0305 | 0.0305 | |||||
| GEV / GE Vernova Inc. | 0.00 | 0.33 | 0.0299 | 0.0299 | |||||
| RY / Royal Bank of Canada | 0.00 | 0.00 | 0.33 | 16.73 | 0.0297 | 0.0015 | |||
| PLTR / Palantir Technologies Inc. | 0.00 | -5.78 | 0.32 | 52.40 | 0.0288 | 0.0079 | |||
| V / Visa Inc. | 0.00 | -1.56 | 0.31 | -0.32 | 0.0283 | -0.0032 | |||
| OTIS / Otis Worldwide Corporation | 0.00 | 0.88 | 0.31 | -3.46 | 0.0278 | -0.0041 | |||
| SBUX / Starbucks Corporation | 0.00 | -0.18 | 0.30 | -6.77 | 0.0274 | -0.0052 | |||
| IGSB / iShares Trust - iShares 1-5 Year Investment Grade Corporate Bond ETF | 0.01 | 0.00 | 0.30 | 0.67 | 0.0271 | -0.0028 | |||
| EMR / Emerson Electric Co. | 0.00 | 0.00 | 0.30 | 21.63 | 0.0270 | 0.0024 | |||
| IBM / International Business Machines Corporation | 0.00 | 0.00 | 0.30 | 18.47 | 0.0267 | 0.0017 | |||
| ORCL / Oracle Corporation | 0.00 | 0.30 | 0.0267 | 0.0267 | |||||
| VZ / Verizon Communications Inc. | 0.01 | -3.48 | 0.29 | -7.72 | 0.0259 | -0.0053 | |||
| JEPI / J.P. Morgan Exchange-Traded Fund Trust - JPMorgan Equity Premium Income ETF | 0.00 | -6.13 | 0.28 | -6.60 | 0.0256 | -0.0048 | |||
| MO / Altria Group, Inc. | 0.00 | 0.39 | 0.27 | -2.16 | 0.0247 | -0.0032 | |||
| HIG / The Hartford Insurance Group, Inc. | 0.00 | 2.75 | 0.26 | 5.26 | 0.0236 | -0.0013 | |||
| FNDF / Schwab Strategic Trust - Schwab Fundamental International Equity ETF | 0.01 | 0.00 | 0.26 | 10.78 | 0.0232 | -0.0000 | |||
| LMT / Lockheed Martin Corporation | 0.00 | 2.79 | 0.26 | 6.67 | 0.0231 | -0.0010 | |||
| NSC / Norfolk Southern Corporation | 0.00 | 0.00 | 0.26 | 8.05 | 0.0231 | -0.0006 | |||
| AMLP / ALPS ETF Trust - Alerian MLP ETF | 0.01 | 0.00 | 0.25 | -6.04 | 0.0225 | -0.0040 | |||
| CSCO / Cisco Systems, Inc. | 0.00 | -1.33 | 0.25 | 11.26 | 0.0223 | -0.0000 | |||
| SMH / VanEck ETF Trust - VanEck Semiconductor ETF | 0.00 | 0.24 | 0.0221 | 0.0221 | |||||
| XYL / Xylem Inc. | 0.00 | 3.06 | 0.24 | 11.16 | 0.0217 | 0.0001 | |||
| ITT / ITT Inc. | 0.00 | 0.24 | 0.0216 | 0.0216 | |||||
| IAU / iShares Gold Trust | 0.00 | 0.24 | 0.0217 | 0.0217 | |||||
| IBDS / iShares Trust - iShares iBonds Dec 2027 Term Corporate ETF | 0.01 | 0.00 | 0.23 | 0.45 | 0.0204 | -0.0022 | |||
| IBDR / iShares Trust - iShares iBonds Dec 2026 Term Corporate ETF | 0.01 | 0.00 | 0.22 | 0.45 | 0.0203 | -0.0022 | |||
| DHS / WisdomTree Trust - WisdomTree U.S. High Dividend Fund | 0.00 | 0.00 | 0.22 | -3.07 | 0.0200 | -0.0029 | |||
| IWM / iShares Trust - iShares Russell 2000 ETF | 0.00 | 0.00 | 0.22 | 8.42 | 0.0198 | -0.0005 | |||
| HON / Honeywell International Inc. | 0.00 | -18.11 | 0.21 | -10.13 | 0.0193 | -0.0045 | |||
| IJR / iShares Trust - iShares Core S&P Small-Cap ETF | 0.00 | 0.00 | 0.21 | 4.43 | 0.0192 | -0.0012 | |||
| SLF / Sun Life Financial Inc. | 0.00 | 0.21 | 0.0190 | 0.0190 | |||||
| VMBS / Vanguard Scottsdale Funds - Vanguard Mortgage-Backed Securities ETF | 0.00 | 0.00 | 0.21 | 0.00 | 0.0186 | -0.0020 | |||
| ESBA / Empire State Realty OP, L.P. - Limited Partnership | 0.02 | 0.00 | 0.19 | 1.60 | 0.0172 | -0.0016 | |||
| RYAM / Rayonier Advanced Materials Inc. | 0.05 | 0.00 | 0.17 | -33.20 | 0.0157 | -0.0103 | |||
| JPC / Nuveen Preferred & Income Opportunities Fund | 0.02 | 0.00 | 0.15 | 0.66 | 0.0138 | -0.0014 | |||
| PLUG / Plug Power Inc. | 0.01 | 0.02 | 0.0016 | 0.0016 | |||||
| ATOS / Atossa Therapeutics, Inc. | 0.01 | 0.00 | 0.01 | 28.57 | 0.0008 | 0.0001 | |||
| WCC / WESCO International, Inc. | 0.00 | -100.00 | 0.00 | 0.0000 | |||||
| OKE / ONEOK, Inc. | 0.00 | -100.00 | 0.00 | 0.0000 | |||||
| PEP / PepsiCo, Inc. | 0.00 | -100.00 | 0.00 | 0.0000 | |||||
| URI / United Rentals, Inc. | 0.00 | -100.00 | 0.00 | 0.0000 | |||||
| COKE / Coca-Cola Consolidated, Inc. | 0.00 | -100.00 | 0.00 | 0.0000 |