Mga Batayang Estadistika
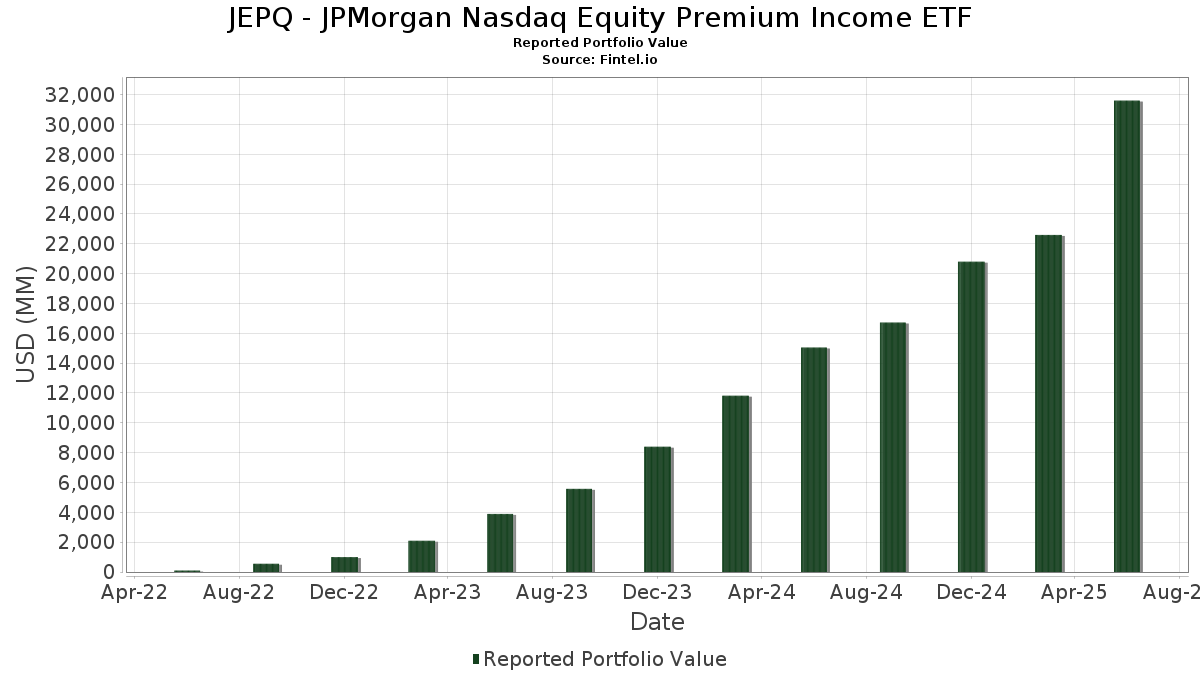
| Nilai Portofolio | $ 31,598,709,403 |
| Posisi Saat Ini | 122 |
Kepemilikan Terbaru, Kinerja, AUM (dari 13F, 13D)
JEPQ - JPMorgan Nasdaq Equity Premium Income ETF telah mengungkapkan total kepemilikan 122 dalam pengajuan SEC terbaru mereka. Nilai portofolio terbaru dihitung sebesar $ 31,598,709,403 USD. Aset yang Dikelola (AUM) sebenarnya adalah nilai ini ditambah kas (yang tidak diungkapkan). Aset-aset utama JEPQ - JPMorgan Nasdaq Equity Premium Income ETF adalah NVIDIA Corporation (US:NVDA) , Microsoft Corporation (US:MSFT) , Apple Inc. (US:AAPL) , Amazon.com, Inc. (US:AMZN) , and Broadcom Inc. (US:AVGO) . Posisi baru JEPQ - JPMorgan Nasdaq Equity Premium Income ETF meliputi: Shopify Inc. (US:SHOP) , .
Peningkatan Tertinggi Kuartal Ini
Kami menggunakan perubahan dalam alokasi portofolio karena ini adalah metrik yang paling bermakna. Perubahan dapat disebabkan oleh perdagangan atau perubahan harga saham.
| Keamanan | Saham (MM) |
Nilai (Juta Dolar AS) |
Portfolio % | ΔPorsyento ng Portfolio |
|---|---|---|---|---|
| 14.12 | 2,231.22 | 8.0188 | 1.7740 | |
| 4.14 | 1,142.29 | 4.1053 | 1.2609 | |
| 304.04 | 1.0927 | 1.0927 | ||
| 304.04 | 1.0927 | 1.0927 | ||
| 4.23 | 2,102.15 | 7.5550 | 1.0885 | |
| 290.07 | 1.0425 | 1.0425 | ||
| 290.07 | 1.0425 | 1.0425 | ||
| 289.05 | 1.0388 | 1.0388 | ||
| 289.05 | 1.0388 | 1.0388 | ||
| 285.86 | 1.0274 | 1.0274 |
Penurunan Tertinggi Kuartal Ini
Kami menggunakan perubahan dalam alokasi portofolio karena ini adalah metrik yang paling bermakna. Perubahan dapat disebabkan oleh perdagangan atau perubahan harga saham.
| Keamanan | Saham (MM) |
Nilai (Juta Dolar AS) |
Portfolio % | ΔPorsyento ng Portfolio |
|---|---|---|---|---|
| 8.37 | 1,716.95 | 6.1706 | -1.4611 | |
| 321.79 | 321.79 | 1.1565 | -1.3184 | |
| 1.25 | 296.85 | 1.0668 | -0.2887 | |
| 0.46 | 206.59 | 0.7425 | -0.1854 | |
| 1.24 | 164.19 | 0.5901 | -0.1704 | |
| 0.23 | 121.47 | 0.4365 | -0.1598 | |
| 0.14 | 44.28 | 0.1591 | -0.1402 | |
| 6.19 | 220.75 | 0.7934 | -0.1372 | |
| 0.45 | 450.38 | 1.6186 | -0.1350 | |
| 0.66 | 123.09 | 0.4424 | -0.1238 |
Pengajuan 13F dan Dana
Formulir ini diajukan pada 2025-08-26 untuk periode pelaporan 2025-06-30. Klik ikon tautan untuk melihat riwayat transaksi selengkapnya.
Tingkatkan ke versi premium untuk membuka data premium dan ekspor ke Excel. ![]() .
.
| Keamanan | Ketik | Harga Saham Rata-rata | Saham (MM) |
ΔSaham (%) |
ΔSaham (%) |
Nilai ($MM) |
Portpolyo (%) |
ΔPortofolio (%) |
|
|---|---|---|---|---|---|---|---|---|---|
| NVDA / NVIDIA Corporation | 14.12 | 7.81 | 2,231.22 | 57.16 | 8.0188 | 1.7740 | |||
| MSFT / Microsoft Corporation | 4.23 | 7.92 | 2,102.15 | 43.00 | 7.5550 | 1.0885 | |||
| AAPL / Apple Inc. | 8.37 | 7.14 | 1,716.95 | -1.04 | 6.1706 | -1.4611 | |||
| AMZN / Amazon.com, Inc. | 6.23 | 7.38 | 1,365.98 | 23.82 | 4.9092 | 0.0567 | |||
| AVGO / Broadcom Inc. | 4.14 | 7.30 | 1,142.29 | 76.65 | 4.1053 | 1.2609 | |||
| GOOG / Alphabet Inc. | 5.99 | 5.89 | 1,062.42 | 20.24 | 3.8183 | -0.0685 | |||
| META / Meta Platforms, Inc. | 1.35 | 7.14 | 998.45 | 37.20 | 3.5884 | 0.3872 | |||
| NFLX / Netflix, Inc. | 0.65 | 7.10 | 872.97 | 53.80 | 3.1374 | 0.6406 | |||
| TSLA / Tesla, Inc. | 1.93 | 7.93 | 612.79 | 32.30 | 2.2023 | 0.1648 | |||
| COST / Costco Wholesale Corporation | 0.45 | 7.93 | 450.38 | 12.97 | 1.6186 | -0.1350 | |||
| INTU / Intuit Inc. | 0.51 | 7.78 | 399.00 | 38.26 | 1.4340 | 0.1646 | |||
| AMD / Advanced Micro Devices, Inc. | 2.49 | 7.90 | 352.68 | 49.02 | 1.2675 | 0.2265 | |||
| BKNG / Booking Holdings Inc. | 0.06 | 0.33 | 344.50 | 26.08 | 1.2381 | 0.0362 | |||
| ISRG / Intuitive Surgical, Inc. | 0.60 | 6.95 | 327.10 | 17.34 | 1.1756 | -0.0506 | |||
| MGMXX / JPMorgan Trust II - JPMorgan U.S. Government Money Market Fund IM | 321.79 | -42.81 | 321.79 | -42.81 | 1.1565 | -1.3184 | |||
| US06747W8495 / Barclays Bank plc into Metlife, Inc. | 304.04 | 1.0927 | 1.0927 | ||||||
| US06747W8495 / Barclays Bank plc into Metlife, Inc. | 304.04 | 1.0927 | 1.0927 | ||||||
| CSCO / Cisco Systems, Inc. | 4.34 | 7.89 | 301.40 | 21.30 | 1.0832 | -0.0098 | |||
| PLTR / Palantir Technologies Inc. | 2.19 | 7.94 | 298.87 | 74.35 | 1.0741 | 0.3201 | |||
| TMUS / T-Mobile US, Inc. | 1.25 | 7.82 | 296.85 | -3.68 | 1.0668 | -0.2887 | |||
| US06747W8495 / Barclays Bank plc into Metlife, Inc. | 290.07 | 1.0425 | 1.0425 | ||||||
| US06747W8495 / Barclays Bank plc into Metlife, Inc. | 290.07 | 1.0425 | 1.0425 | ||||||
| BNP Paribas, ELN, 61.07%, 7/18/2025, (linked to Nasdaq-100 Index) / SN (US0969324476) | 289.05 | 1.0388 | 1.0388 | ||||||
| BNP Paribas, ELN, 61.07%, 7/18/2025, (linked to Nasdaq-100 Index) / SN (US0969324476) | 289.05 | 1.0388 | 1.0388 | ||||||
| BofA Finance LLC, ELN, 61.49%, 7/21/2025, (linked to Nasdaq-100 Index) / SN (US09710Q5835) | 285.86 | 1.0274 | 1.0274 | ||||||
| BofA Finance LLC, ELN, 61.49%, 7/21/2025, (linked to Nasdaq-100 Index) / SN (US09710Q5835) | 285.86 | 1.0274 | 1.0274 | ||||||
| Morgan Stanley Finance LLC, ELN, 59.82%, 7/17/2025, (linked to Nasdaq-100 Index) / SN (US61777X4806) | 283.93 | 1.0204 | 1.0204 | ||||||
| Morgan Stanley Finance LLC, ELN, 59.82%, 7/17/2025, (linked to Nasdaq-100 Index) / SN (US61777X4806) | 283.93 | 1.0204 | 1.0204 | ||||||
| US17329T1613 / Citigroup Global Markets Holdings, Inc. into Bristol Myers Squibb Co. | 283.32 | 1.0182 | 1.0182 | ||||||
| US17329T1613 / Citigroup Global Markets Holdings, Inc. into Bristol Myers Squibb Co. | 283.32 | 1.0182 | 1.0182 | ||||||
| BNP Paribas, ELN, 55.60%, 8/1/2025, (linked to Nasdaq-100 Index) / SN (US0969324138) | 282.30 | 1.0146 | 1.0146 | ||||||
| BNP Paribas, ELN, 55.60%, 8/1/2025, (linked to Nasdaq-100 Index) / SN (US0969324138) | 282.30 | 1.0146 | 1.0146 | ||||||
| Societe Generale SA, ELN, 63.69%, 7/10/2025, (linked to Nasdaq-100 Index) / SN (US83371E5289) | 281.71 | 1.0124 | 1.0124 | ||||||
| Morgan Stanley Finance LLC, ELN, 62.64%, 7/24/2025, (linked to Nasdaq-100 Index) / SN (US61777X5480) | 277.35 | 0.9968 | 0.9968 | ||||||
| Morgan Stanley Finance LLC, ELN, 62.64%, 7/24/2025, (linked to Nasdaq-100 Index) / SN (US61777X5480) | 277.35 | 0.9968 | 0.9968 | ||||||
| US83370G5999 / Societe Generale SA, ELN, (linked to Nasdaq 100 Index) | 274.12 | 0.9852 | 0.9852 | ||||||
| US83370G5999 / Societe Generale SA, ELN, (linked to Nasdaq 100 Index) | 274.12 | 0.9852 | 0.9852 | ||||||
| BNP Paribas, ELN, 60.52%, 7/31/2025, (linked to Nasdaq-100 Index) / SN (US0969324393) | 272.97 | 0.9810 | 0.9810 | ||||||
| BNP Paribas, ELN, 60.52%, 7/31/2025, (linked to Nasdaq-100 Index) / SN (US0969324393) | 272.97 | 0.9810 | 0.9810 | ||||||
| RYBD34 / Royal Bank of Canada - Depositary Receipt (Common Stock) | 271.71 | 0.9765 | 0.9765 | ||||||
| RYBD34 / Royal Bank of Canada - Depositary Receipt (Common Stock) | 271.71 | 0.9765 | 0.9765 | ||||||
| TD.PFA / The Toronto-Dominion Bank - Preferred Security | 269.76 | 0.9695 | 0.9695 | ||||||
| TD.PFA / The Toronto-Dominion Bank - Preferred Security | 269.76 | 0.9695 | 0.9695 | ||||||
| US06747W8495 / Barclays Bank plc into Metlife, Inc. | 263.29 | 0.9462 | 0.9462 | ||||||
| US06747W8495 / Barclays Bank plc into Metlife, Inc. | 263.29 | 0.9462 | 0.9462 | ||||||
| PANW / Palo Alto Networks, Inc. | 1.28 | 6.87 | 261.28 | 28.17 | 0.9390 | 0.0423 | |||
| Societe Generale SA, ELN, 63.08%, 7/8/2025, (linked to Nasdaq-100 Index) / SN (US83371E5024) | 258.10 | 0.9276 | 0.9276 | ||||||
| Societe Generale SA, ELN, 63.08%, 7/8/2025, (linked to Nasdaq-100 Index) / SN (US83371E5024) | 258.10 | 0.9276 | 0.9276 | ||||||
| ADI / Analog Devices, Inc. | 1.07 | 7.82 | 255.33 | 27.25 | 0.9176 | 0.0350 | |||
| HON / Honeywell International Inc. | 1.09 | 2.27 | 253.93 | 12.47 | 0.9126 | -0.0805 | |||
| LIN / Linde plc | 0.53 | 8.12 | 250.48 | 8.95 | 0.9002 | -0.1111 | |||
| LRCX / Lam Research Corporation | 2.54 | 7.88 | 247.23 | 44.45 | 0.8885 | 0.1357 | |||
| TXN / Texas Instruments Incorporated | 1.08 | 7.98 | 225.24 | 24.76 | 0.8095 | 0.0153 | |||
| MU / Micron Technology, Inc. | 1.83 | 7.88 | 225.21 | 53.02 | 0.8094 | 0.1620 | |||
| CMCSA / Comcast Corporation | 6.19 | 7.89 | 220.75 | 4.35 | 0.7934 | -0.1372 | |||
| MELI / MercadoLibre, Inc. | 0.08 | 9.16 | 211.09 | 46.24 | 0.7586 | 0.1237 | |||
| VRTX / Vertex Pharmaceuticals Incorporated | 0.46 | 6.66 | 206.59 | -2.06 | 0.7425 | -0.1854 | |||
| SNPS / Synopsys, Inc. | 0.40 | 7.78 | 202.62 | 28.84 | 0.7282 | 0.0365 | |||
| QCOM / QUALCOMM Incorporated | 1.24 | 5.44 | 197.81 | 9.31 | 0.7109 | -0.0851 | |||
| ADBE / Adobe Inc. | 0.49 | 4.38 | 189.34 | 5.30 | 0.6805 | -0.1105 | |||
| CRWD / CrowdStrike Holdings, Inc. | 0.37 | 7.51 | 188.41 | 55.30 | 0.6771 | 0.1435 | |||
| MDLZ / Mondelez International, Inc. | 2.77 | 7.92 | 186.63 | 7.27 | 0.6707 | -0.0945 | |||
| ORLY / O'Reilly Automotive, Inc. | 1.90 | 1,520.13 | 171.01 | 1.93 | 0.6146 | -0.1234 | |||
| PEP / PepsiCo, Inc. | 1.24 | 7.85 | 164.19 | -5.03 | 0.5901 | -0.1704 | |||
| VNX / NXP Semiconductors N.V. | 0.74 | 7.87 | 160.80 | 24.01 | 0.5779 | 0.0075 | |||
| CSX / CSX Corporation | 4.81 | 14.72 | 156.96 | 27.20 | 0.5641 | 0.0213 | |||
| ASML / ASML Holding N.V. - Depositary Receipt (Common Stock) | 0.19 | 7.79 | 151.70 | 30.36 | 0.5452 | 0.0333 | |||
| MRVL / Marvell Technology, Inc. | 1.75 | 7.81 | 135.79 | 35.53 | 0.4880 | 0.0473 | |||
| APP / AppLovin Corporation | 0.39 | 5.98 | 135.19 | 40.03 | 0.4859 | 0.0612 | |||
| SHOP / Shopify Inc. | 1.15 | 132.08 | 0.4747 | 0.4747 | |||||
| CPRT / Copart, Inc. | 2.66 | 14.65 | 130.72 | -0.58 | 0.4698 | -0.1086 | |||
| MAR / Marriott International, Inc. | 0.47 | 7.65 | 129.48 | 23.47 | 0.4653 | 0.0041 | |||
| MNST / Monster Beverage Corporation | 2.03 | 7.93 | 126.85 | 15.53 | 0.4559 | -0.0271 | |||
| ORCL / Oracle Corporation | 0.57 | 7.97 | 124.44 | 68.85 | 0.4472 | 0.1230 | |||
| KO / The Coca-Cola Company | 1.76 | 7.88 | 124.26 | 6.57 | 0.4466 | -0.0663 | |||
| ABBV / AbbVie Inc. | 0.66 | 7.94 | 123.09 | -4.37 | 0.4424 | -0.1238 | |||
| REGN / Regeneron Pharmaceuticals, Inc. | 0.23 | 8.23 | 121.47 | -10.41 | 0.4365 | -0.1598 | |||
| AMAT / Applied Materials, Inc. | 0.64 | 7.77 | 116.89 | 35.96 | 0.4201 | 0.0419 | |||
| VRSK / Verisk Analytics, Inc. | 0.37 | 7.53 | 115.54 | 12.55 | 0.4152 | -0.0363 | |||
| STX / Seagate Technology Holdings plc | 0.78 | 8.43 | 112.78 | 84.22 | 0.4053 | 0.1360 | |||
| 3EC / Eaton Corporation plc | 0.31 | 8.22 | 109.88 | 42.13 | 0.3949 | 0.0548 | |||
| NOW / ServiceNow, Inc. | 0.10 | 2.49 | 106.14 | 32.35 | 0.3815 | 0.0287 | |||
| DASH / DoorDash, Inc. | 0.43 | 8.05 | 105.44 | 45.72 | 0.3790 | 0.0607 | |||
| AMGN / Amgen Inc. | 0.37 | 8.27 | 102.22 | -2.97 | 0.3674 | -0.0960 | |||
| SO / The Southern Company | 1.04 | 8.00 | 95.85 | 7.86 | 0.3445 | -0.0464 | |||
| SBUX / Starbucks Corporation | 1.02 | 7.90 | 93.53 | 0.79 | 0.3362 | -0.0720 | |||
| CMG / Chipotle Mexican Grill, Inc. | 1.66 | 7.91 | 93.45 | 20.67 | 0.3359 | -0.0048 | |||
| XEL / Xcel Energy Inc. | 1.35 | 7.90 | 91.94 | 3.80 | 0.3304 | -0.0592 | |||
| TTWO / Take-Two Interactive Software, Inc. | 0.37 | -20.13 | 89.14 | -6.41 | 0.3204 | -0.0986 | |||
| LOW / Lowe's Companies, Inc. | 0.40 | 7.94 | 88.27 | 2.68 | 0.3173 | -0.0609 | |||
| MA / Mastercard Incorporated | 0.16 | 8.75 | 88.06 | 11.49 | 0.3165 | -0.0309 | |||
| DE / Deere & Company | 0.16 | 7.28 | 83.85 | 16.22 | 0.3013 | -0.0160 | |||
| NEE / NextEra Energy, Inc. | 1.13 | 7.90 | 78.71 | 5.66 | 0.2829 | -0.0448 | |||
| INTC / Intel Corporation | 3.47 | 7.90 | 77.67 | 6.42 | 0.2791 | -0.0419 | |||
| UBER / Uber Technologies, Inc. | 0.81 | -6.17 | 75.95 | 20.16 | 0.2730 | -0.0051 | |||
| CHTR / Charter Communications, Inc. | 0.18 | 8.78 | 72.67 | 20.67 | 0.2612 | -0.0037 | |||
| DXCM / DexCom, Inc. | 0.82 | 7.91 | 71.42 | 37.93 | 0.2567 | 0.0289 | |||
| HUBS / HubSpot, Inc. | 0.12 | 6.70 | 69.18 | 3.97 | 0.2486 | -0.0441 | |||
| FANG / Diamondback Energy, Inc. | 0.50 | 30.99 | 69.05 | 12.57 | 0.2482 | -0.0216 | |||
| CTSH / Cognizant Technology Solutions Corporation | 0.81 | 8.05 | 63.12 | 10.21 | 0.2268 | -0.0251 | |||
| BMY / Bristol-Myers Squibb Company | 1.28 | 7.84 | 59.31 | -18.15 | 0.2131 | -0.1056 | |||
| PYPL / PayPal Holdings, Inc. | 0.76 | 7.92 | 56.85 | 22.93 | 0.2043 | 0.0009 | |||
| CPAY / Corpay, Inc. | 0.17 | 7.74 | 56.15 | 2.52 | 0.2018 | -0.0391 | |||
| MSTR / Strategy Inc | 0.13 | 8.81 | 53.70 | 52.58 | 0.1930 | 0.0382 | |||
| ROST / Ross Stores, Inc. | 0.38 | 8.04 | 48.53 | 7.87 | 0.1744 | -0.0235 | |||
| WDAY / Workday, Inc. | 0.20 | 8.38 | 47.48 | 11.39 | 0.1706 | -0.0169 | |||
| PLD / Prologis, Inc. | 0.45 | 7.80 | 47.43 | 1.37 | 0.1705 | -0.0354 | |||
| TMO / Thermo Fisher Scientific Inc. | 0.11 | 8.13 | 46.29 | -11.89 | 0.1664 | -0.0647 | |||
| UNH / UnitedHealth Group Incorporated | 0.14 | 9.23 | 44.28 | -34.94 | 0.1591 | -0.1402 | |||
| BIIB / Biogen Inc. | 0.34 | 7.69 | 42.29 | -1.16 | 0.1520 | -0.0362 | |||
| KHC / The Kraft Heinz Company | 1.48 | 7.82 | 38.14 | -8.51 | 0.1371 | -0.0463 | |||
| TER / Teradyne, Inc. | 0.41 | 7.94 | 36.57 | 17.51 | 0.1314 | -0.0055 | |||
| TTD / The Trade Desk, Inc. | 0.49 | 7.88 | 35.02 | 41.93 | 0.1259 | 0.0173 | |||
| PDD / PDD Holdings Inc. - Depositary Receipt (Common Stock) | 0.29 | 7.57 | 30.16 | -4.88 | 0.1084 | -0.0311 | |||
| ABNB / Airbnb, Inc. | 0.23 | 7.90 | 30.05 | 19.53 | 0.1080 | -0.0026 | |||
| CEG / Constellation Energy Corporation | 0.09 | 7.38 | 28.09 | 71.89 | 0.1009 | 0.0291 | |||
| DDOG / Datadog, Inc. | 0.19 | 8.41 | 25.79 | 46.78 | 0.0927 | 0.0154 | |||
| ANSS / ANSYS, Inc. | 0.07 | 10.32 | 22.84 | 22.40 | 0.0821 | 0.0000 | |||
| TEAM / Atlassian Corporation | 0.11 | 7.90 | 22.81 | 3.27 | 0.0820 | -0.0152 | |||
| STZ / Constellation Brands, Inc. | 0.14 | 7.61 | 22.46 | -4.61 | 0.0807 | -0.0229 | |||
| UPS / United Parcel Service, Inc. | 0.21 | -22.15 | 21.61 | -28.56 | 0.0777 | -0.0554 | |||
| LULU / lululemon athletica inc. | 0.05 | 11.17 | 10.91 | -6.69 | 0.0392 | -0.0122 |