Mga Batayang Estadistika
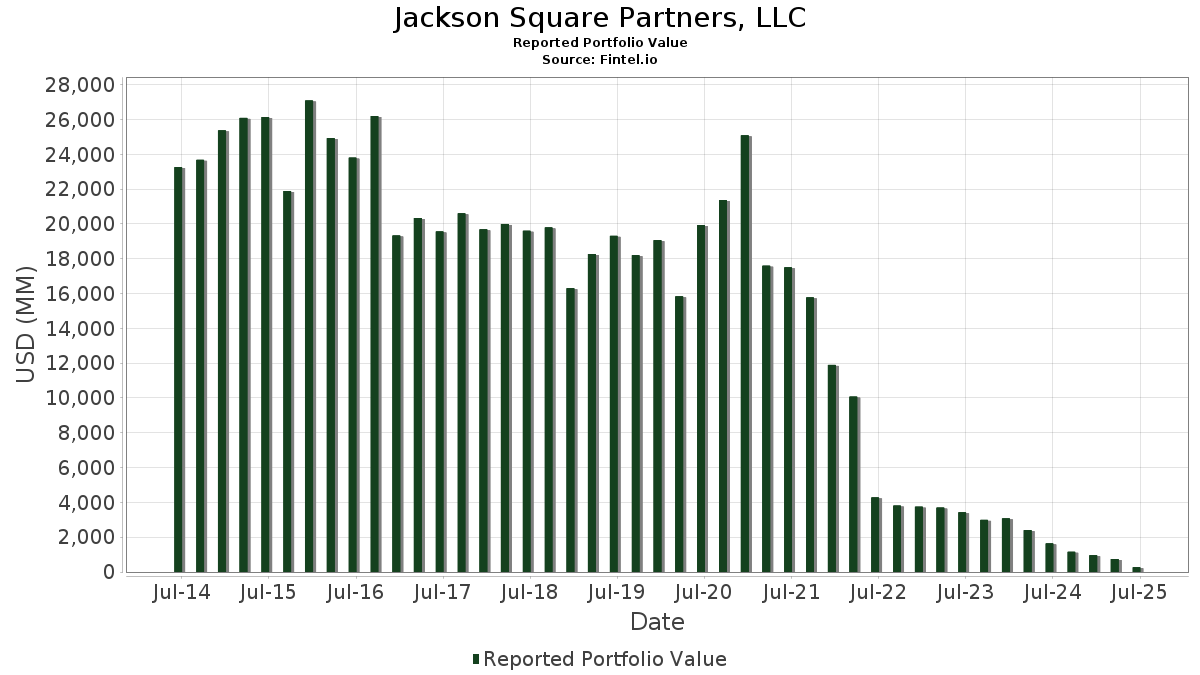
| Nilai Portofolio | $ 270,383,225 |
| Posisi Saat Ini | 54 |
Kepemilikan Terbaru, Kinerja, AUM (dari 13F, 13D)
Jackson Square Partners, LLC telah mengungkapkan total kepemilikan 54 dalam pengajuan SEC terbaru mereka. Nilai portofolio terbaru dihitung sebesar $ 270,383,225 USD. Aset yang Dikelola (AUM) sebenarnya adalah nilai ini ditambah kas (yang tidak diungkapkan). Aset-aset utama Jackson Square Partners, LLC adalah Microsoft Corporation (US:MSFT) , NVIDIA Corporation (US:NVDA) , Amazon.com, Inc. (US:AMZN) , Vertiv Holdings Co (US:VRT) , and Alphabet Inc. (US:GOOGL) . Posisi baru Jackson Square Partners, LLC meliputi: Neogen Corporation (US:NEOG) , . Industri unggulan Jackson Square Partners, LLC adalah "Apparel And Accessory Stores" (sic 56) , "Electric, Gas, And Sanitary Services " (sic 49) , and "Personal Services" (sic 72) .
Peningkatan Tertinggi Kuartal Ini
Kami menggunakan perubahan dalam alokasi portofolio karena ini adalah metrik yang paling bermakna. Perubahan dapat disebabkan oleh perdagangan atau perubahan harga saham.
| Keamanan | Saham (MM) |
Nilai (Juta Dolar AS) |
Portfolio % | ΔPorsyento ng Portfolio |
|---|---|---|---|---|
| 0.13 | 20.91 | 7.7325 | 5.5165 | |
| 0.04 | 21.68 | 8.0174 | 5.2961 | |
| 0.07 | 14.68 | 5.4301 | 3.4628 | |
| 0.06 | 10.51 | 3.8869 | 2.4620 | |
| 0.08 | 10.90 | 4.0330 | 1.8760 | |
| 0.03 | 6.56 | 2.4273 | 1.6019 | |
| 0.01 | 7.77 | 2.8753 | 1.4463 | |
| 0.01 | 5.72 | 2.1145 | 1.4305 | |
| 0.02 | 6.97 | 2.5761 | 1.4014 | |
| 0.01 | 5.80 | 2.1450 | 1.2815 |
Penurunan Tertinggi Kuartal Ini
Kami menggunakan perubahan dalam alokasi portofolio karena ini adalah metrik yang paling bermakna. Perubahan dapat disebabkan oleh perdagangan atau perubahan harga saham.
| Keamanan | Saham (MM) |
Nilai (Juta Dolar AS) |
Portfolio % | ΔPorsyento ng Portfolio |
|---|---|---|---|---|
| 0.01 | 2.77 | 1.0258 | -2.4612 | |
| 0.06 | 4.47 | 1.6521 | -2.3677 | |
| 0.04 | 2.45 | 0.9074 | -1.8689 | |
| 0.01 | 2.91 | 1.0773 | -1.8616 | |
| 0.04 | 3.63 | 1.3440 | -1.7443 | |
| 0.01 | 2.93 | 1.0826 | -1.6449 | |
| 0.02 | 2.95 | 1.0901 | -1.6404 | |
| 0.06 | 2.95 | 1.0898 | -1.6218 | |
| 0.02 | 5.05 | 1.8669 | -1.6085 | |
| 0.05 | 3.33 | 1.2334 | -1.5858 |
Pengajuan 13D/G
Ini adalah daftar pengajuan 13D dan 13G yang dibuat dalam setahun terakhir (jika ada). Klik ikon tautan untuk melihat riwayat transaksi lengkap. Baris berwarna hijau menunjukkan posisi baru. Baris berwarna merah menunjukkan posisi yang sudah ditutup.
| Tanggal File | Formulir | Keamanan | Sebelumnya Saham |
Saat ini Saham |
ΔPersentase Saham | % Kepemilikan |
% ΔKepemilikan | |
|---|---|---|---|---|---|---|---|---|
| 2025-02-04 | LC / LendingClub Corporation | 9,723,943 | 2,840,376 | -70.79 | 2.53 | -71.48 |
Pengajuan 13F dan Dana
Formulir ini diajukan pada 2025-08-07 untuk periode pelaporan 2025-06-30. Klik ikon tautan untuk melihat riwayat transaksi selengkapnya.
Tingkatkan ke versi premium untuk membuka data premium dan ekspor ke Excel. ![]() .
.
| Keamanan | Ketik | Harga Saham Rata-rata | Saham (MM) |
ΔSaham (%) |
ΔSaham (%) |
Nilai ($MM) |
Portpolyo (%) |
ΔPortofolio (%) |
|
|---|---|---|---|---|---|---|---|---|---|
| MSFT / Microsoft Corporation | 0.04 | -19.15 | 21.68 | 7.14 | 8.0174 | 5.2961 | |||
| NVDA / NVIDIA Corporation | 0.13 | -12.96 | 20.91 | 26.89 | 7.7325 | 5.5165 | |||
| AMZN / Amazon.com, Inc. | 0.07 | -12.96 | 14.68 | 0.38 | 5.4301 | 3.4628 | |||
| VRT / Vertiv Holdings Co | 0.08 | -61.77 | 10.90 | -32.01 | 4.0330 | 1.8760 | |||
| GOOGL / Alphabet Inc. | 0.06 | -12.96 | 10.51 | -0.80 | 3.8869 | 2.4620 | |||
| SBAC / SBA Communications Corporation | 0.04 | -70.68 | 9.48 | -68.71 | 3.5048 | -0.5681 | |||
| MA / Mastercard Incorporated | 0.01 | -28.63 | 7.77 | -26.83 | 2.8753 | 1.4463 | |||
| V / Visa Inc. | 0.02 | -21.29 | 6.97 | -20.25 | 2.5761 | 1.4014 | |||
| BA / The Boeing Company | 0.03 | -12.96 | 6.56 | 6.94 | 2.4273 | 1.6019 | |||
| SPGI / S&P Global Inc. | 0.01 | -12.96 | 5.80 | -9.67 | 2.1450 | 1.2815 | |||
| CME / CME Group Inc. | 0.02 | -35.23 | 5.78 | -32.71 | 2.1384 | 0.9829 | |||
| NOW / ServiceNow, Inc. | 0.01 | -12.95 | 5.72 | 12.43 | 2.1145 | 1.4305 | |||
| CP / Canadian Pacific Kansas City Limited | 0.07 | -18.60 | 5.25 | -8.10 | 1.9431 | 1.1743 | |||
| CLH / Clean Harbors, Inc. | 0.02 | -83.35 | 5.05 | -80.47 | 1.8669 | -1.6085 | |||
| ASML / ASML Holding N.V. - Depositary Receipt (Common Stock) | 0.01 | -12.95 | 4.94 | 5.26 | 1.8284 | 1.1969 | |||
| STVN / Stevanato Group S.p.A. | 0.19 | -83.36 | 4.71 | -80.10 | 1.7408 | -1.4392 | |||
| WM / Waste Management, Inc. | 0.02 | -35.49 | 4.70 | -36.25 | 1.7386 | 0.7471 | |||
| ENTG / Entegris, Inc. | 0.06 | -69.83 | 4.69 | -72.19 | 1.7342 | -0.5334 | |||
| WH / Wyndham Hotels & Resorts, Inc. | 0.06 | -83.34 | 4.47 | -85.06 | 1.6521 | -2.3677 | |||
| ALGN / Align Technology, Inc. | 0.02 | -83.15 | 4.32 | -79.92 | 1.5990 | -1.2960 | |||
| HXL / Hexcel Corporation | 0.08 | -75.15 | 4.24 | -74.36 | 1.5689 | -0.6563 | |||
| WDAY / Workday, Inc. | 0.02 | -12.96 | 3.99 | -10.53 | 1.4765 | 0.8763 | |||
| ISRG / Intuitive Surgical, Inc. | 0.01 | -12.95 | 3.94 | -4.51 | 1.4575 | 0.9026 | |||
| SNPS / Synopsys, Inc. | 0.01 | 27.52 | 3.90 | 52.46 | 1.4426 | 1.0985 | |||
| LC / LendingClub Corporation | 0.32 | -83.35 | 3.88 | -80.59 | 1.4340 | -1.2520 | |||
| AMD / Advanced Micro Devices, Inc. | 0.03 | -12.96 | 3.69 | 20.21 | 1.3664 | 0.9531 | |||
| MKTX / MarketAxess Holdings Inc. | 0.02 | -83.35 | 3.63 | -82.81 | 1.3443 | -1.4990 | |||
| OKTA / Okta, Inc. | 0.04 | -83.34 | 3.63 | -84.18 | 1.3440 | -1.7443 | |||
| LIN / Linde plc | 0.01 | -12.95 | 3.57 | -12.28 | 1.3212 | 0.7734 | |||
| BILL / BILL Holdings, Inc. | 0.08 | -71.17 | 3.57 | -70.95 | 1.3187 | -0.3316 | |||
| KKR / KKR & Co. Inc. | 0.03 | -12.95 | 3.56 | 0.17 | 1.3172 | 0.8390 | |||
| SITE / SiteOne Landscape Supply, Inc. | 0.03 | -83.34 | 3.56 | -83.41 | 1.3172 | -1.5697 | |||
| WSC / WillScot Holdings Corporation | 0.13 | -74.82 | 3.55 | -75.18 | 1.3128 | -0.6106 | |||
| ESTC / Elastic N.V. | 0.04 | -81.49 | 3.46 | -82.49 | 1.2811 | -1.3786 | |||
| UBER / Uber Technologies, Inc. | 0.04 | -35.34 | 3.40 | -17.23 | 1.2586 | 0.7058 | |||
| AAON / AAON, Inc. | 0.05 | -83.15 | 3.33 | -84.10 | 1.2334 | -1.5858 | |||
| NYT / The New York Times Company | 0.06 | -83.34 | 3.23 | -81.19 | 1.1947 | -1.1153 | |||
| SBUX / Starbucks Corporation | 0.03 | -12.96 | 3.05 | -18.69 | 1.1281 | 0.6236 | |||
| HWM / Howmet Aerospace Inc. | 0.02 | -89.88 | 2.95 | -85.48 | 1.0901 | -1.6404 | |||
| TECH / Bio-Techne Corporation | 0.06 | -83.35 | 2.95 | -85.39 | 1.0898 | -1.6218 | |||
| LLY / Eli Lilly and Company | 0.00 | -12.94 | 2.94 | -17.83 | 1.0860 | 0.6054 | |||
| MEDP / Medpace Holdings, Inc. | 0.01 | -85.99 | 2.93 | -85.57 | 1.0826 | -1.6449 | |||
| MOH / Molina Healthcare, Inc. | 0.01 | -85.26 | 2.91 | -86.67 | 1.0773 | -1.8616 | |||
| DHR / Danaher Corporation | 0.01 | -12.96 | 2.81 | -16.12 | 1.0391 | 0.5886 | |||
| BLD / TopBuild Corp. | 0.01 | -83.34 | 2.81 | -82.31 | 1.0385 | -1.0962 | |||
| KNSL / Kinsale Capital Group, Inc. | 0.01 | -89.24 | 2.77 | -89.30 | 1.0258 | -2.4612 | |||
| IQV / IQVIA Holdings Inc. | 0.02 | 14.58 | 2.59 | 2.45 | 0.9594 | 0.6188 | |||
| SSD / Simpson Manufacturing Co., Inc. | 0.02 | -83.34 | 2.51 | -83.53 | 0.9290 | -1.1216 | |||
| UNH / UnitedHealth Group Incorporated | 0.01 | 2.49 | 0.9197 | 0.9197 | |||||
| RYAN / Ryan Specialty Holdings, Inc. | 0.04 | -87.09 | 2.45 | -88.12 | 0.9074 | -1.8689 | |||
| ACLS / Axcelis Technologies, Inc. | 0.04 | -83.34 | 2.44 | -76.62 | 0.9034 | -0.5018 | |||
| WMG / Warner Music Group Corp. | 0.09 | -83.34 | 2.40 | -85.53 | 0.8861 | -1.3404 | |||
| NEOG / Neogen Corporation | 0.35 | 1.65 | 0.6105 | 0.6105 | |||||
| PACB / Pacific Biosciences of California, Inc. | 0.55 | -83.34 | 0.69 | -82.52 | 0.2537 | -0.2733 | |||
| CPRT / Copart, Inc. | 0.00 | -100.00 | 0.00 | 0.0000 | |||||
| GO / Grocery Outlet Holding Corp. | 0.00 | -100.00 | 0.00 | 0.0000 | |||||
| WAB / Westinghouse Air Brake Technologies Corporation | 0.00 | -100.00 | 0.00 | 0.0000 |