Mga Batayang Estadistika
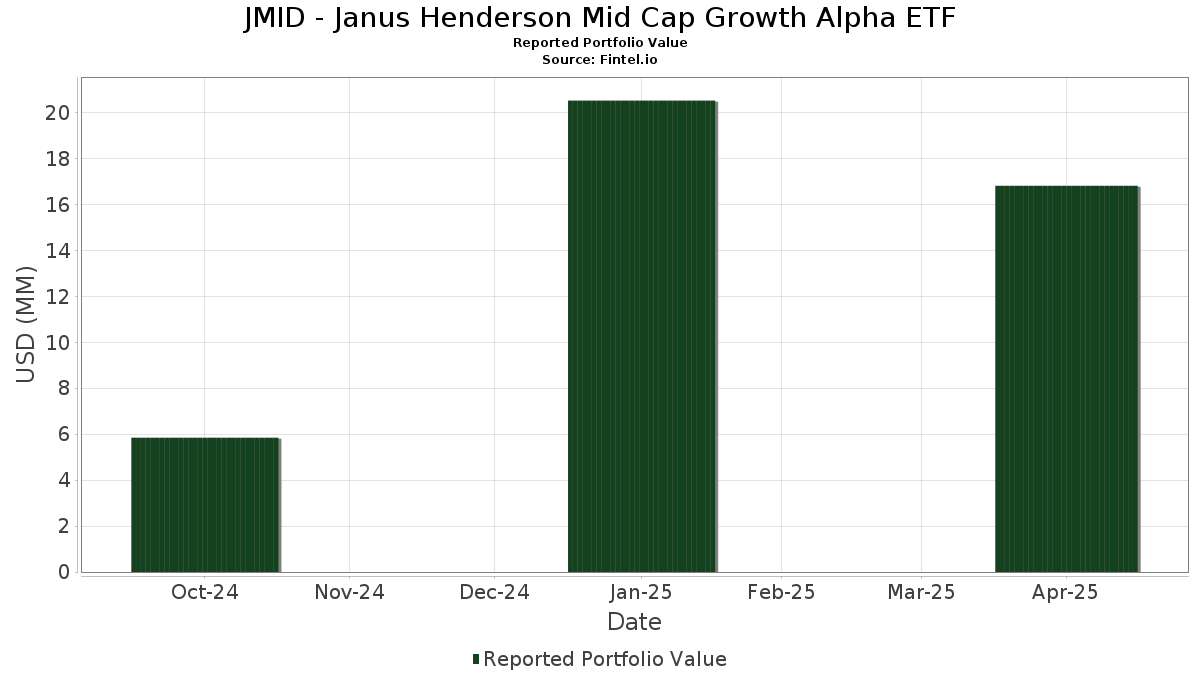
| Nilai Portofolio | $ 16,811,467 |
| Posisi Saat Ini | 81 |
Kepemilikan Terbaru, Kinerja, AUM (dari 13F, 13D)
JMID - Janus Henderson Mid Cap Growth Alpha ETF telah mengungkapkan total kepemilikan 81 dalam pengajuan SEC terbaru mereka. Nilai portofolio terbaru dihitung sebesar $ 16,811,467 USD. Aset yang Dikelola (AUM) sebenarnya adalah nilai ini ditambah kas (yang tidak diungkapkan). Aset-aset utama JMID - Janus Henderson Mid Cap Growth Alpha ETF adalah Palantir Technologies Inc. (US:PLTR) , Ameriprise Financial, Inc. (US:AMP) , AppLovin Corporation (US:APP) , Cheniere Energy, Inc. (US:LNG) , and Corpay, Inc. (US:CPAY) . Posisi baru JMID - Janus Henderson Mid Cap Growth Alpha ETF meliputi: Paychex, Inc. (US:PAYX) , Rollins, Inc. (US:ROL) , Equitable Holdings, Inc. (US:EQH) , Brown & Brown, Inc. (US:BRO) , and The Hershey Company (US:HSY) .
Peningkatan Tertinggi Kuartal Ini
Kami menggunakan perubahan dalam alokasi portofolio karena ini adalah metrik yang paling bermakna. Perubahan dapat disebabkan oleh perdagangan atau perubahan harga saham.
| Keamanan | Saham (MM) |
Nilai (Juta Dolar AS) |
Portfolio % | ΔPorsyento ng Portfolio |
|---|---|---|---|---|
| 0.01 | 1.44 | 8.5961 | 3.7322 | |
| 0.00 | 0.35 | 2.1159 | 2.1159 | |
| 0.01 | 0.35 | 2.0793 | 2.0793 | |
| 0.01 | 0.34 | 2.0032 | 2.0032 | |
| 0.00 | 0.31 | 1.8432 | 1.8432 | |
| 0.00 | 0.30 | 1.8125 | 1.8125 | |
| 0.00 | 0.28 | 1.6509 | 1.6509 | |
| 0.00 | 0.26 | 1.5286 | 1.5286 | |
| 0.03 | 0.25 | 1.4790 | 1.4790 | |
| 0.00 | 0.39 | 2.2970 | 1.4738 |
Penurunan Tertinggi Kuartal Ini
Kami menggunakan perubahan dalam alokasi portofolio karena ini adalah metrik yang paling bermakna. Perubahan dapat disebabkan oleh perdagangan atau perubahan harga saham.
| Keamanan | Saham (MM) |
Nilai (Juta Dolar AS) |
Portfolio % | ΔPorsyento ng Portfolio |
|---|---|---|---|---|
| 0.00 | 0.00 | -2.4670 | ||
| 0.00 | 0.04 | 0.2391 | -2.4305 | |
| 0.00 | 0.00 | -1.7668 | ||
| 0.00 | 0.42 | 2.5324 | -1.7018 | |
| 0.00 | 0.00 | -1.3440 | ||
| 0.00 | 0.01 | 0.0690 | -1.3239 | |
| 0.00 | 0.00 | -1.2686 | ||
| 0.00 | 0.00 | -1.2176 | ||
| 0.00 | 0.11 | 0.6576 | -1.1789 | |
| 0.00 | 0.00 | -1.0727 |
Pengajuan 13F dan Dana
Formulir ini diajukan pada 2025-06-20 untuk periode pelaporan 2025-04-30. Klik ikon tautan untuk melihat riwayat transaksi selengkapnya.
Tingkatkan ke versi premium untuk membuka data premium dan ekspor ke Excel. ![]() .
.
| Keamanan | Ketik | Harga Saham Rata-rata | Saham (MM) |
ΔSaham (%) |
ΔSaham (%) |
Nilai ($MM) |
Portpolyo (%) |
ΔPortofolio (%) |
|
|---|---|---|---|---|---|---|---|---|---|
| PLTR / Palantir Technologies Inc. | 0.01 | 0.60 | 1.44 | 44.39 | 8.5961 | 3.7322 | |||
| AMP / Ameriprise Financial, Inc. | 0.00 | -2.81 | 0.47 | -15.71 | 2.8170 | 0.0844 | |||
| APP / AppLovin Corporation | 0.00 | -32.92 | 0.42 | -51.15 | 2.5324 | -1.7018 | |||
| LNG / Cheniere Energy, Inc. | 0.00 | -5.44 | 0.40 | -2.22 | 2.3702 | 0.3878 | |||
| CPAY / Corpay, Inc. | 0.00 | 166.67 | 0.39 | 129.17 | 2.2970 | 1.4738 | |||
| GDDY / GoDaddy Inc. | 0.00 | -10.63 | 0.36 | -20.80 | 2.1347 | -0.0694 | |||
| PAYX / Paychex, Inc. | 0.00 | 0.35 | 2.1159 | 2.1159 | |||||
| ROL / Rollins, Inc. | 0.01 | 0.35 | 2.0793 | 2.0793 | |||||
| EQH / Equitable Holdings, Inc. | 0.01 | 0.34 | 2.0032 | 2.0032 | |||||
| SPG / Simon Property Group, Inc. | 0.00 | 6.34 | 0.32 | -3.86 | 1.9369 | 0.2924 | |||
| DRI / Darden Restaurants, Inc. | 0.00 | -5.90 | 0.32 | -3.29 | 1.9285 | 0.2987 | |||
| MANH / Manhattan Associates, Inc. | 0.00 | 34.51 | 0.31 | 14.34 | 1.8552 | 0.5298 | |||
| SGI / Somnigroup International Inc. | 0.01 | -6.09 | 0.31 | -9.36 | 1.8539 | 0.1856 | |||
| BRO / Brown & Brown, Inc. | 0.00 | 0.31 | 1.8432 | 1.8432 | |||||
| RMD / ResMed Inc. | 0.00 | 15.73 | 0.31 | 16.23 | 1.8367 | 0.5420 | |||
| NRG / NRG Energy, Inc. | 0.00 | 0.30 | 1.8125 | 1.8125 | |||||
| ALL / The Allstate Corporation | 0.00 | -1.10 | 0.30 | 2.03 | 1.8004 | 0.3580 | |||
| DVA / DaVita Inc. | 0.00 | 7.69 | 0.29 | -13.39 | 1.7378 | 0.0961 | |||
| EME / EMCOR Group, Inc. | 0.00 | 10.32 | 0.29 | -1.38 | 1.7107 | 0.2937 | |||
| MKL / Markel Group Inc. | 0.00 | -3.70 | 0.28 | -4.39 | 1.6916 | 0.2479 | |||
| EXEL / Exelixis, Inc. | 0.01 | 77.69 | 0.28 | 110.45 | 1.6861 | 1.0295 | |||
| ULTA / Ulta Beauty, Inc. | 0.00 | -14.39 | 0.28 | -17.78 | 1.6844 | 0.0094 | |||
| DOCU / DocuSign, Inc. | 0.00 | -13.88 | 0.28 | -27.20 | 1.6758 | -0.2059 | |||
| PEGA / Pegasystems Inc. | 0.00 | 79.93 | 0.28 | 53.04 | 1.6537 | 0.7703 | |||
| HSY / The Hershey Company | 0.00 | 0.28 | 1.6509 | 1.6509 | |||||
| CSL / Carlisle Companies Incorporated | 0.00 | 1,049.18 | 0.27 | 1,056.52 | 1.5862 | 1.4704 | |||
| BAH / Booz Allen Hamilton Holding Corporation | 0.00 | 37.56 | 0.26 | 27.72 | 1.5436 | 0.5580 | |||
| NXST / Nexstar Media Group, Inc. | 0.00 | 0.26 | 1.5286 | 1.5286 | |||||
| WU / The Western Union Company | 0.03 | 0.25 | 1.4790 | 1.4790 | |||||
| HLI / Houlihan Lokey, Inc. | 0.00 | 35.22 | 0.24 | 20.79 | 1.4583 | 0.4701 | |||
| LAZ / Lazard, Inc. | 0.01 | 14.61 | 0.24 | -17.97 | 1.4469 | 0.0048 | |||
| COIN / Coinbase Global, Inc. | 0.00 | -22.78 | 0.24 | -46.28 | 1.4227 | -0.7395 | |||
| AXON / Axon Enterprise, Inc. | 0.00 | 624.53 | 0.24 | 591.18 | 1.4042 | 1.2358 | |||
| VRSK / Verisk Analytics, Inc. | 0.00 | 3,200.00 | 0.22 | 3,633.33 | 1.3415 | 1.3093 | |||
| CNM / Core & Main, Inc. | 0.00 | -23.89 | 0.22 | -28.75 | 1.3300 | -0.2001 | |||
| CROX / Crocs, Inc. | 0.00 | -3.47 | 0.21 | -9.05 | 1.2619 | 0.1309 | |||
| VLTO / Veralto Corporation | 0.00 | 277.85 | 0.21 | 254.24 | 1.2489 | 0.9576 | |||
| PINS / Pinterest, Inc. | 0.01 | 0.20 | 1.1980 | 1.1980 | |||||
| HRB / H&R Block, Inc. | 0.00 | 45.34 | 0.20 | 58.73 | 1.1965 | 0.5801 | |||
| TDC / Teradata Corporation | 0.01 | 66.17 | 0.20 | 11.93 | 1.1799 | 0.3186 | |||
| LOPE / Grand Canyon Education, Inc. | 0.00 | 0.18 | 1.0901 | 1.0901 | |||||
| VRT / Vertiv Holdings Co | 0.00 | 125.69 | 0.18 | 64.55 | 1.0823 | 0.5452 | |||
| OKTA / Okta, Inc. | 0.00 | -53.95 | 0.18 | -45.15 | 1.0794 | -0.5299 | |||
| EXPD / Expeditors International of Washington, Inc. | 0.00 | 0.18 | 1.0676 | 1.0676 | |||||
| LAMR / Lamar Advertising Company | 0.00 | 212.60 | 0.17 | 173.02 | 1.0267 | -0.0662 | |||
| CDW / CDW Corporation | 0.00 | 19.23 | 0.17 | -3.98 | 1.0091 | 0.1512 | |||
| MEDP / Medpace Holdings, Inc. | 0.00 | 43.73 | 0.16 | 27.20 | 0.9488 | 0.3380 | |||
| FIX / Comfort Systems USA, Inc. | 0.00 | -49.81 | 0.16 | -54.34 | 0.9434 | -0.7443 | |||
| UI / Ubiquiti Inc. | 0.00 | -35.77 | 0.15 | -48.15 | 0.9226 | -0.5286 | |||
| VST / Vistra Corp. | 0.00 | 194.86 | 0.15 | 127.69 | 0.8866 | 0.5680 | |||
| LYV / Live Nation Entertainment, Inc. | 0.00 | 0.15 | 0.8687 | 0.8687 | |||||
| DECK / Deckers Outdoor Corporation | 0.00 | 36.03 | 0.14 | -14.88 | 0.8558 | 0.0330 | |||
| HAS / Hasbro, Inc. | 0.00 | 0.14 | 0.8382 | 0.8382 | |||||
| HEIA / Heico Corp. - Class A | 0.00 | 0.13 | 0.7704 | 0.7704 | |||||
| CACC / Credit Acceptance Corporation | 0.00 | 11.93 | 0.12 | 7.27 | 0.7091 | 0.1697 | |||
| WSM / Williams-Sonoma, Inc. | 0.00 | -59.96 | 0.11 | -70.74 | 0.6576 | -1.1789 | |||
| MOH / Molina Healthcare, Inc. | 0.00 | 0.11 | 0.6532 | 0.6532 | |||||
| BLD / TopBuild Corp. | 0.00 | 0.11 | 0.6472 | 0.6472 | |||||
| PPC / Pilgrim's Pride Corporation | 0.00 | 0.10 | 0.6096 | 0.6096 | |||||
| XP / XP Inc. | 0.01 | -51.12 | 0.10 | -42.61 | 0.6067 | -0.2533 | |||
| LECO / Lincoln Electric Holdings, Inc. | 0.00 | 254.42 | 0.09 | 213.79 | 0.5474 | 0.4050 | |||
| KNSL / Kinsale Capital Group, Inc. | 0.00 | -49.76 | 0.09 | -50.82 | 0.5424 | -0.3535 | |||
| SMCI / Super Micro Computer, Inc. | 0.00 | 0.09 | 0.5165 | 0.5165 | |||||
| DUOL / Duolingo, Inc. | 0.00 | 0.09 | 0.5109 | 0.5109 | |||||
| SEE / Sealed Air Corporation | 0.00 | 0.07 | 0.4462 | 0.4462 | |||||
| CELH / Celsius Holdings, Inc. | 0.00 | -41.70 | 0.07 | -18.89 | 0.4398 | -0.0007 | |||
| LNW / Light & Wonder, Inc. | 0.00 | 0.07 | 0.4159 | 0.4159 | |||||
| NTNX / Nutanix, Inc. | 0.00 | 0.07 | 0.4027 | 0.4027 | |||||
| LYFT / Lyft, Inc. | 0.01 | -32.60 | 0.07 | -38.10 | 0.3897 | -0.1262 | |||
| MUSA / Murphy USA Inc. | 0.00 | 0.06 | 0.3835 | 0.3835 | |||||
| GEHC / GE HealthCare Technologies Inc. | 0.00 | 0.06 | 0.3770 | 0.3770 | |||||
| PWR / Quanta Services, Inc. | 0.00 | 0.06 | 0.3456 | 0.3456 | |||||
| APPF / AppFolio, Inc. | 0.00 | 0.05 | 0.3202 | 0.3202 | |||||
| SOFI / SoFi Technologies, Inc. | 0.00 | 0.05 | 0.3015 | 0.3015 | |||||
| PAYC / Paycom Software, Inc. | 0.00 | -28.73 | 0.04 | -22.81 | 0.2646 | -0.0136 | |||
| COR / Cencora, Inc. | 0.00 | -93.64 | 0.04 | -92.69 | 0.2391 | -2.4305 | |||
| DOCS / Doximity, Inc. | 0.00 | 0.03 | 0.1594 | 0.1594 | |||||
| U / Unity Software Inc. | 0.00 | 0.02 | 0.1425 | 0.1425 | |||||
| WMS / Advanced Drainage Systems, Inc. | 0.00 | 0.02 | 0.1326 | 0.1326 | |||||
| Janus Henderson Cash Liquidity Fund LLC / STIV (N/A) | 0.02 | 0.02 | 0.0910 | 0.0910 | |||||
| JBL / Jabil Inc. | 0.00 | -95.51 | 0.01 | -96.14 | 0.0690 | -1.3239 | |||
| ROK / Rockwell Automation, Inc. | 0.00 | -100.00 | 0.00 | -100.00 | -1.2686 | ||||
| RLI / RLI Corp. | 0.00 | -100.00 | 0.00 | -100.00 | -1.0727 | ||||
| PSTG / Pure Storage, Inc. | 0.00 | -100.00 | 0.00 | -100.00 | -0.4007 | ||||
| EG / Everest Group, Ltd. | 0.00 | -100.00 | 0.00 | -100.00 | -1.2176 | ||||
| LII / Lennox International Inc. | 0.00 | -100.00 | 0.00 | -100.00 | -1.7668 | ||||
| ENPH / Enphase Energy, Inc. | 0.00 | -100.00 | 0.00 | -100.00 | -0.5187 | ||||
| NU / Nu Holdings Ltd. | 0.00 | -100.00 | 0.00 | -100.00 | -0.9435 | ||||
| ALAB / Astera Labs, Inc. | 0.00 | -100.00 | 0.00 | -100.00 | -0.2545 | ||||
| EPAM / EPAM Systems, Inc. | 0.00 | -100.00 | 0.00 | -100.00 | -1.3440 | ||||
| ARES / Ares Management Corporation | 0.00 | -100.00 | 0.00 | -100.00 | -2.4670 |