Mga Batayang Estadistika
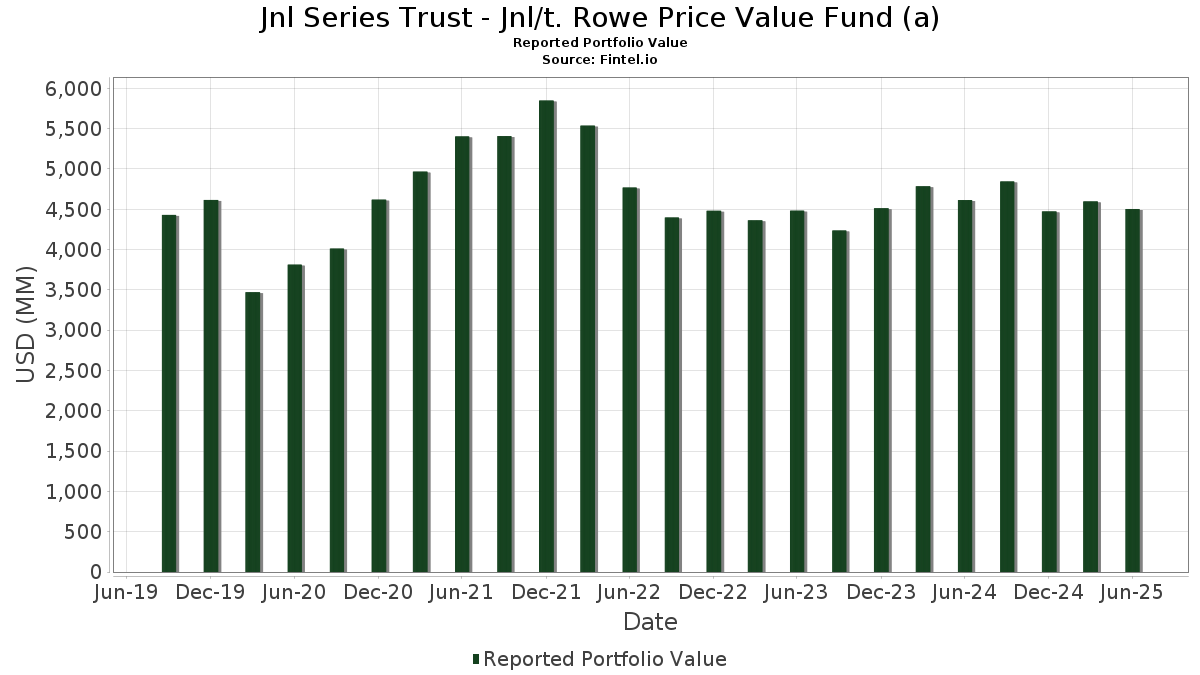
| Nilai Portofolio | $ 4,503,547,600 |
| Posisi Saat Ini | 102 |
Kepemilikan Terbaru, Kinerja, AUM (dari 13F, 13D)
Jnl Series Trust - Jnl/t. Rowe Price Value Fund (a) telah mengungkapkan total kepemilikan 102 dalam pengajuan SEC terbaru mereka. Nilai portofolio terbaru dihitung sebesar $ 4,503,547,600 USD. Aset yang Dikelola (AUM) sebenarnya adalah nilai ini ditambah kas (yang tidak diungkapkan). Aset-aset utama Jnl Series Trust - Jnl/t. Rowe Price Value Fund (a) adalah JPMorgan Chase & Co. (US:JPM) , Berkshire Hathaway Inc. (US:BRK.B) , Keysight Technologies, Inc. (US:KEYS) , Deere & Company (US:DE) , and The Charles Schwab Corporation (US:SCHW) . Posisi baru Jnl Series Trust - Jnl/t. Rowe Price Value Fund (a) meliputi: Alphabet Inc. (US:GOOGL) , Quest Diagnostics Incorporated (US:DGX) , .
Peningkatan Tertinggi Kuartal Ini
Kami menggunakan perubahan dalam alokasi portofolio karena ini adalah metrik yang paling bermakna. Perubahan dapat disebabkan oleh perdagangan atau perubahan harga saham.
| Keamanan | Saham (MM) |
Nilai (Juta Dolar AS) |
Portfolio % | ΔPorsyento ng Portfolio |
|---|---|---|---|---|
| 0.38 | 83.81 | 1.8603 | 1.8603 | |
| 0.30 | 53.54 | 1.1884 | 1.1884 | |
| 0.08 | 38.95 | 0.8645 | 0.8645 | |
| 0.29 | 51.43 | 1.1415 | 0.7343 | |
| 0.61 | 175.61 | 3.8982 | 0.6468 | |
| 0.14 | 25.56 | 0.5674 | 0.5674 | |
| 0.19 | 25.18 | 0.5588 | 0.5588 | |
| 0.42 | 77.41 | 1.7183 | 0.4883 | |
| 0.23 | 62.14 | 1.3794 | 0.4290 | |
| 0.23 | 58.61 | 1.3011 | 0.4287 |
Penurunan Tertinggi Kuartal Ini
Kami menggunakan perubahan dalam alokasi portofolio karena ini adalah metrik yang paling bermakna. Perubahan dapat disebabkan oleh perdagangan atau perubahan harga saham.
| Keamanan | Saham (MM) |
Nilai (Juta Dolar AS) |
Portfolio % | ΔPorsyento ng Portfolio |
|---|---|---|---|---|
| 0.26 | 45.54 | 1.0108 | -1.2452 | |
| 3.51 | 73.36 | 1.6285 | -0.9927 | |
| 0.17 | 52.82 | 1.1726 | -0.9557 | |
| 0.61 | 42.91 | 0.9525 | -0.6143 | |
| 0.26 | 27.92 | 0.6198 | -0.5744 | |
| 0.31 | 150.54 | 3.3417 | -0.5172 | |
| 0.04 | 6.39 | 0.1419 | -0.4628 | |
| 0.04 | 12.05 | 0.2674 | -0.3742 | |
| 0.42 | 37.76 | 0.8381 | -0.3520 | |
| 0.14 | 55.66 | 1.2354 | -0.3488 |
Pengajuan 13F dan Dana
Formulir ini diajukan pada 2025-08-27 untuk periode pelaporan 2025-06-30. Klik ikon tautan untuk melihat riwayat transaksi selengkapnya.
Tingkatkan ke versi premium untuk membuka data premium dan ekspor ke Excel. ![]() .
.
| Keamanan | Ketik | Harga Saham Rata-rata | Saham (MM) |
ΔSaham (%) |
ΔSaham (%) |
Nilai ($MM) |
Portpolyo (%) |
ΔPortofolio (%) |
|
|---|---|---|---|---|---|---|---|---|---|
| JPM / JPMorgan Chase & Co. | 0.61 | -0.57 | 175.61 | 17.52 | 3.8982 | 0.6468 | |||
| BRK.B / Berkshire Hathaway Inc. | 0.31 | -6.94 | 150.54 | -15.12 | 3.3417 | -0.5172 | |||
| KEYS / Keysight Technologies, Inc. | 0.59 | 0.58 | 96.64 | 10.04 | 2.1451 | 0.2344 | |||
| DE / Deere & Company | 0.17 | 0.16 | 86.86 | 8.51 | 1.9280 | 0.1864 | |||
| SCHW / The Charles Schwab Corporation | 0.93 | -0.96 | 84.99 | 15.44 | 1.8866 | 0.2847 | |||
| AMZN / Amazon.com, Inc. | 0.38 | 83.81 | 1.8603 | 1.8603 | |||||
| ALL / The Allstate Corporation | 0.41 | 13.19 | 82.21 | 10.05 | 1.8248 | 0.1994 | |||
| WAB / Westinghouse Air Brake Technologies Corporation | 0.39 | 0.43 | 80.90 | 15.93 | 1.7957 | 0.2775 | |||
| AME / AMETEK, Inc. | 0.44 | -0.49 | 79.43 | 4.61 | 1.7632 | 0.1111 | |||
| TXN / Texas Instruments Incorporated | 0.38 | 7.88 | 79.21 | 24.65 | 1.7583 | 0.3756 | |||
| ICE / Intercontinental Exchange, Inc. | 0.42 | 28.74 | 77.41 | 36.93 | 1.7183 | 0.4883 | |||
| SHW / The Sherwin-Williams Company | 0.22 | 3.50 | 74.08 | 1.78 | 1.6444 | 0.0607 | |||
| KVUE / Kenvue Inc. | 3.51 | -30.23 | 73.36 | -39.10 | 1.6285 | -0.9927 | |||
| PG / The Procter & Gamble Company | 0.45 | 15.79 | 71.05 | 8.25 | 1.5772 | 0.1491 | |||
| NSC / Norfolk Southern Corporation | 0.27 | -0.47 | 69.76 | 7.56 | 1.5485 | 0.1374 | |||
| PH / Parker-Hannifin Corporation | 0.09 | 2.61 | 65.82 | 17.91 | 1.4611 | 0.2465 | |||
| COR / Cencora, Inc. | 0.22 | -25.15 | 64.50 | -19.30 | 1.4318 | -0.3072 | |||
| XEL / Xcel Energy Inc. | 0.95 | -0.70 | 64.45 | -4.47 | 1.4308 | -0.0373 | |||
| COP / ConocoPhillips | 0.71 | 13.81 | 63.84 | -2.75 | 1.4171 | -0.0112 | |||
| TRV / The Travelers Companies, Inc. | 0.23 | 40.62 | 62.14 | 42.26 | 1.3794 | 0.4290 | |||
| MCD / McDonald's Corporation | 0.21 | -16.24 | 61.73 | -21.65 | 1.3702 | -0.3440 | |||
| AZO / AutoZone, Inc. | 0.02 | -0.62 | 61.11 | -3.24 | 1.3565 | -0.0176 | |||
| LIN / Linde plc | 0.13 | -0.05 | 60.99 | 0.71 | 1.3539 | 0.0361 | |||
| BAC / Bank of America Corporation | 1.28 | -4.86 | 60.44 | 7.89 | 1.3417 | 0.1227 | |||
| HD / The Home Depot, Inc. | 0.16 | 12.14 | 60.27 | 12.19 | 1.3378 | 0.1690 | |||
| MDLZ / Mondelez International, Inc. | 0.87 | 6.24 | 58.89 | 5.60 | 1.3072 | 0.0938 | |||
| GE / General Electric Company | 0.23 | 13.68 | 58.61 | 46.19 | 1.3011 | 0.4287 | |||
| RRC / Range Resources Corporation | 1.41 | -5.66 | 57.36 | -3.91 | 1.2732 | -0.0256 | |||
| AXP / American Express Company | 0.18 | -5.45 | 57.21 | 12.09 | 1.2700 | 0.1595 | |||
| GILD / Gilead Sciences, Inc. | 0.51 | 44.53 | 56.53 | 43.01 | 1.2549 | 0.3948 | |||
| UNP / Union Pacific Corporation | 0.24 | 5.51 | 55.92 | 2.76 | 1.2413 | 0.0573 | |||
| THC / Tenet Healthcare Corporation | 0.32 | 0.16 | 55.73 | 31.06 | 1.2372 | 0.3119 | |||
| ELV / Elevance Health, Inc. | 0.14 | -14.52 | 55.66 | -23.56 | 1.2354 | -0.3488 | |||
| IP / International Paper Company | 1.16 | 1.02 | 54.44 | -11.32 | 1.2084 | -0.1273 | |||
| GOOGL / Alphabet Inc. | 0.30 | 53.54 | 1.1884 | 1.1884 | |||||
| AEE / Ameren Corporation | 0.56 | 4.39 | 53.52 | -0.15 | 1.1880 | 0.0218 | |||
| UNH / UnitedHealth Group Incorporated | 0.17 | -9.33 | 52.82 | -46.00 | 1.1726 | -0.9557 | |||
| CVX / Chevron Corporation | 0.37 | 53.74 | 52.80 | 31.59 | 1.1720 | 0.2990 | |||
| GOOG / Alphabet Inc. | 0.29 | 121.87 | 51.43 | 179.27 | 1.1415 | 0.7343 | |||
| SLB / Schlumberger Limited | 1.43 | 16.04 | 48.42 | -6.17 | 1.0749 | -0.0480 | |||
| ADI / Analog Devices, Inc. | 0.20 | -3.62 | 46.95 | 13.76 | 1.0422 | 0.1442 | |||
| FI / Fiserv, Inc. | 0.26 | -43.75 | 45.54 | -56.08 | 1.0108 | -1.2452 | |||
| RSG / Republic Services, Inc. | 0.18 | -1.36 | 44.62 | 0.45 | 0.9905 | 0.0240 | |||
| AZN / AstraZeneca PLC - Depositary Receipt (Common Stock) | 0.61 | -37.33 | 42.91 | -40.41 | 0.9525 | -0.6143 | |||
| PSA / Public Storage | 0.14 | -3.83 | 42.43 | -5.71 | 0.9418 | -0.0373 | |||
| RVTY / Revvity, Inc. | 0.43 | -20.72 | 41.46 | -27.53 | 0.9203 | -0.3244 | |||
| TMUS / T-Mobile US, Inc. | 0.17 | 13.75 | 39.60 | 1.62 | 0.8790 | 0.0312 | |||
| CI / The Cigna Group | 0.12 | -14.68 | 39.49 | -14.27 | 0.8765 | -0.1257 | |||
| VLO / Valero Energy Corporation | 0.29 | 17.67 | 39.43 | 19.76 | 0.8753 | 0.1589 | |||
| US21871X1090 / Corebridge Financial, Inc. | 1.10 | 0.00 | 39.03 | 12.45 | 0.8663 | 0.1112 | |||
| MSFT / Microsoft Corporation | 0.08 | 38.95 | 0.8645 | 0.8645 | |||||
| CL / Colgate-Palmolive Company | 0.42 | -28.84 | 37.76 | -30.97 | 0.8381 | -0.3520 | |||
| ODFL / Old Dominion Freight Line, Inc. | 0.23 | 3.33 | 37.29 | 1.36 | 0.8278 | 0.0273 | |||
| ALC / Alcon Inc. | 0.42 | 38.66 | 37.04 | 28.95 | 0.8223 | 0.1972 | |||
| LHX / L3Harris Technologies, Inc. | 0.15 | -15.80 | 36.62 | 0.90 | 0.8129 | 0.0232 | |||
| KEY / KeyCorp | 2.07 | 0.00 | 36.08 | 8.94 | 0.8010 | 0.0803 | |||
| BDX / Becton, Dickinson and Company | 0.21 | 10.13 | 35.58 | -17.18 | 0.7898 | -0.1450 | |||
| KLAC / KLA Corporation | 0.04 | 0.00 | 34.65 | 31.77 | 0.7691 | 0.1970 | |||
| ROST / Ross Stores, Inc. | 0.26 | -27.63 | 33.02 | -27.75 | 0.7330 | -0.2615 | |||
| CMCSA / Comcast Corporation | 0.91 | 139.15 | 32.60 | 131.30 | 0.7235 | 0.4169 | |||
| WMT / Walmart Inc. | 0.33 | -6.64 | 32.44 | 3.98 | 0.7200 | 0.0413 | |||
| GS / The Goldman Sachs Group, Inc. | 0.04 | 0.00 | 30.76 | 29.56 | 0.6828 | 0.1662 | |||
| NOC / Northrop Grumman Corporation | 0.06 | -0.25 | 30.37 | -2.59 | 0.6743 | -0.0042 | |||
| FTI / TechnipFMC plc | 0.88 | 14.24 | 30.14 | 24.16 | 0.6689 | 0.1408 | |||
| DLTR / Dollar Tree, Inc. | 0.29 | -15.18 | 28.95 | 11.90 | 0.6426 | 0.0797 | |||
| BALL / Ball Corporation | 0.51 | 108.43 | 28.84 | 70.00 | 0.6402 | 0.2854 | |||
| C / Citigroup Inc. | 0.33 | -15.42 | 28.40 | 1.41 | 0.6304 | 0.0211 | |||
| CB / Chubb Limited | 0.10 | 20.28 | 28.18 | 15.39 | 0.6255 | 0.0942 | |||
| WELL / Welltower Inc. | 0.18 | 63.18 | 27.99 | 63.73 | 0.6214 | 0.2494 | |||
| XOM / Exxon Mobil Corporation | 0.26 | -43.88 | 27.92 | -49.13 | 0.6198 | -0.5744 | |||
| CPAY / Corpay, Inc. | 0.08 | 0.00 | 27.84 | -4.85 | 0.6179 | -0.0186 | |||
| ATO / Atmos Energy Corporation | 0.17 | 0.00 | 26.55 | -0.30 | 0.5893 | 0.0099 | |||
| FCX / Freeport-McMoRan Inc. | 0.60 | 0.00 | 26.01 | 14.50 | 0.5774 | 0.0831 | |||
| ESS / Essex Property Trust, Inc. | 0.09 | 40.93 | 25.84 | 30.27 | 0.5736 | 0.1420 | |||
| FERG / Ferguson Enterprises Inc. | 0.12 | -40.27 | 25.62 | -18.82 | 0.5686 | -0.1180 | |||
| DGX / Quest Diagnostics Incorporated | 0.14 | 25.56 | 0.5674 | 0.5674 | |||||
| ABT / Abbott Laboratories | 0.19 | 25.18 | 0.5588 | 0.5588 | |||||
| TSCO / Tractor Supply Company | 0.47 | 0.00 | 24.77 | -4.23 | 0.5497 | -0.0129 | |||
| PINS / Pinterest, Inc. | 0.69 | 6.84 | 24.75 | 23.59 | 0.5493 | 0.1137 | |||
| CME / CME Group Inc. | 0.09 | -1.32 | 24.18 | 2.53 | 0.5368 | 0.0236 | |||
| NLY / Annaly Capital Management, Inc. | 1.25 | -1.31 | 23.49 | -8.55 | 0.5215 | -0.0374 | |||
| PPG / PPG Industries, Inc. | 0.20 | -19.89 | 23.27 | -16.67 | 0.5165 | -0.0910 | |||
| TE Connectivity Public Limited Company / EC (IE000IVNQZ81) | 0.14 | -34.65 | 23.23 | -22.01 | 0.5155 | -0.1324 | |||
| EFX / Equifax Inc. | 0.09 | -6.87 | 23.21 | -0.82 | 0.5153 | 0.0060 | |||
| VICI / VICI Properties Inc. | 0.71 | 0.00 | 23.17 | -0.06 | 0.5142 | 0.0099 | |||
| V / Visa Inc. | 0.06 | -38.34 | 22.92 | -37.53 | 0.5088 | -0.2895 | |||
| AWK / American Water Works Company, Inc. | 0.16 | -9.13 | 22.17 | -14.31 | 0.4920 | -0.0708 | |||
| PSX / Phillips 66 | 0.18 | -9.82 | 21.26 | -12.87 | 0.4720 | -0.0590 | |||
| OC / Owens Corning | 0.14 | 0.00 | 19.40 | -3.71 | 0.4307 | -0.0077 | |||
| COF / Capital One Financial Corporation | 0.08 | 17.79 | 0.3948 | 0.3948 | |||||
| INTC / Intel Corporation | 0.79 | -5.83 | 17.72 | -7.11 | 0.3933 | -0.0217 | |||
| FANG / Diamondback Energy, Inc. | 0.12 | -40.56 | 16.66 | -48.91 | 0.3697 | -0.3397 | |||
| DHR / Danaher Corporation | 0.08 | -25.36 | 16.15 | -28.08 | 0.3586 | -0.1301 | |||
| SO / The Southern Company | 0.17 | 156.62 | 15.86 | 228.55 | 0.3520 | 0.2513 | |||
| ROK / Rockwell Automation, Inc. | 0.04 | -49.41 | 14.49 | -34.96 | 0.3216 | -0.1631 | |||
| CSA / Accenture plc | 0.04 | -57.35 | 12.05 | -59.15 | 0.2674 | -0.3742 | |||
| META / Meta Platforms, Inc. | 0.02 | -55.12 | 11.96 | 144.12 | 0.2654 | 0.1549 | |||
| MET / MetLife, Inc. | 0.14 | -35.46 | 11.51 | -35.35 | 0.2554 | -0.1318 | |||
| PGR / The Progressive Corporation | 0.03 | 0.00 | 7.09 | -5.70 | 0.1575 | -0.0062 | |||
| FNV / Franco-Nevada Corporation | 0.04 | -77.89 | 6.39 | -77.00 | 0.1419 | -0.4628 | |||
| US76105Y1091 / T. Rowe Price Government Reserve Fund | 5.37 | 5,366,658.00 | 5.37 | 0.1191 | 0.1191 | ||||
| 46628D437 / JNL Government Money Market Fund | 3.06 | 57.47 | 3.06 | 57.47 | 0.0678 | 0.0256 |