Mga Batayang Estadistika
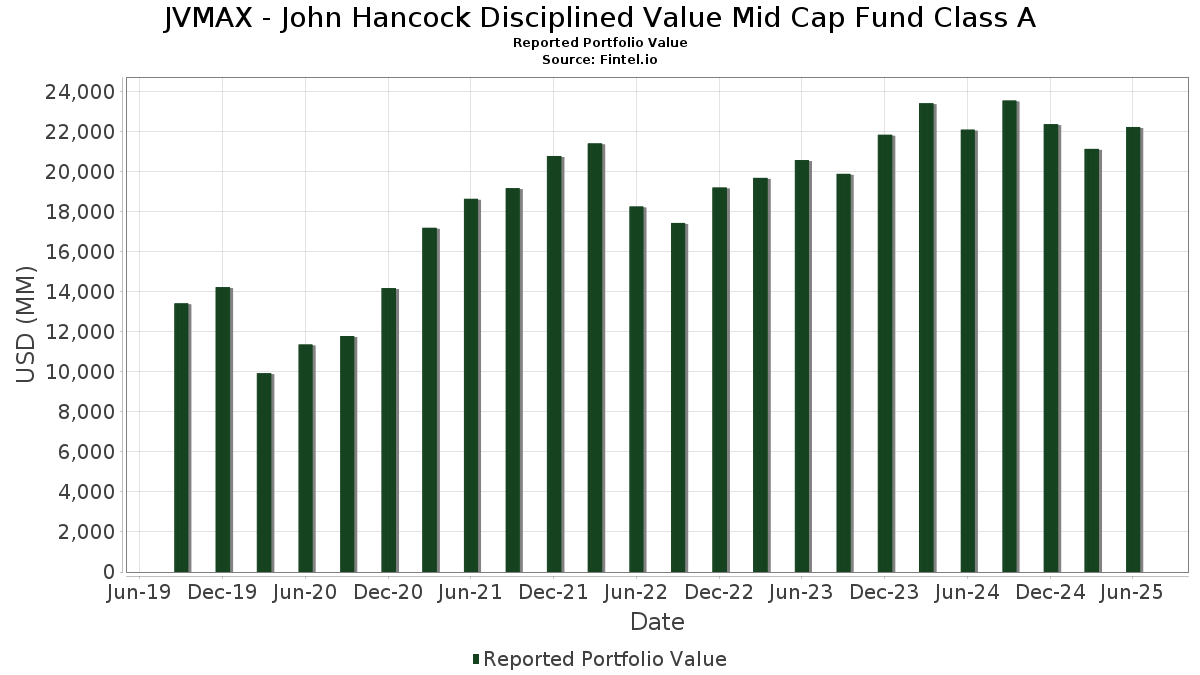
| Nilai Portofolio | $ 22,222,201,460 |
| Posisi Saat Ini | 131 |
Kepemilikan Terbaru, Kinerja, AUM (dari 13F, 13D)
JVMAX - John Hancock Disciplined Value Mid Cap Fund Class A telah mengungkapkan total kepemilikan 131 dalam pengajuan SEC terbaru mereka. Nilai portofolio terbaru dihitung sebesar $ 22,222,201,460 USD. Aset yang Dikelola (AUM) sebenarnya adalah nilai ini ditambah kas (yang tidak diungkapkan). Aset-aset utama JVMAX - John Hancock Disciplined Value Mid Cap Fund Class A adalah Ameriprise Financial, Inc. (US:AMP) , LPL Financial Holdings Inc. (US:LPLA) , Howmet Aerospace Inc. (US:HWM) , AutoZone, Inc. (US:AZO) , and SSC GOVERNMENT MM GVMXX GVMXX (US:7839989D1) . Posisi baru JVMAX - John Hancock Disciplined Value Mid Cap Fund Class A meliputi: Jabil Inc. (US:JBL) , Stifel Financial Corp. (US:SF) , Seagate Technology Holdings plc (US:STX) , Brown & Brown, Inc. (US:BRO) , and Crocs, Inc. (US:CROX) .
Peningkatan Tertinggi Kuartal Ini
Kami menggunakan perubahan dalam alokasi portofolio karena ini adalah metrik yang paling bermakna. Perubahan dapat disebabkan oleh perdagangan atau perubahan harga saham.
| Keamanan | Saham (MM) |
Nilai (Juta Dolar AS) |
Portfolio % | ΔPorsyento ng Portfolio |
|---|---|---|---|---|
| 6.60 | 227.45 | 1.0305 | 0.8690 | |
| 0.85 | 186.16 | 0.8434 | 0.8434 | |
| 17.96 | 179.66 | 0.8140 | 0.8140 | |
| 1.62 | 168.37 | 0.7628 | 0.7628 | |
| 0.95 | 137.66 | 0.6237 | 0.6237 | |
| 1.12 | 199.22 | 0.9026 | 0.6159 | |
| 1.10 | 121.98 | 0.5526 | 0.5526 | |
| 1.17 | 118.96 | 0.5390 | 0.5390 | |
| 1.24 | 218.70 | 0.9908 | 0.5382 | |
| 0.78 | 118.37 | 0.5363 | 0.5363 |
Penurunan Tertinggi Kuartal Ini
Kami menggunakan perubahan dalam alokasi portofolio karena ini adalah metrik yang paling bermakna. Perubahan dapat disebabkan oleh perdagangan atau perubahan harga saham.
| Keamanan | Saham (MM) |
Nilai (Juta Dolar AS) |
Portfolio % | ΔPorsyento ng Portfolio |
|---|---|---|---|---|
| 3.77 | 155.11 | 0.7027 | -0.6996 | |
| 383.18 | 383.18 | 1.7360 | -0.6964 | |
| 0.99 | 297.09 | 1.3460 | -0.5657 | |
| 1.33 | 293.21 | 1.3284 | -0.4665 | |
| 2.80 | 112.60 | 0.5101 | -0.4213 | |
| 1.83 | 208.52 | 0.9447 | -0.3788 | |
| 0.10 | 386.24 | 1.7499 | -0.2967 | |
| 0.18 | 124.00 | 0.5618 | -0.2914 | |
| 1.00 | 137.62 | 0.6235 | -0.2620 | |
| 1.80 | 238.67 | 1.0813 | -0.2500 |
Pengajuan 13F dan Dana
Formulir ini diajukan pada 2025-08-28 untuk periode pelaporan 2025-06-30. Klik ikon tautan untuk melihat riwayat transaksi selengkapnya.
Tingkatkan ke versi premium untuk membuka data premium dan ekspor ke Excel. ![]() .
.
| Keamanan | Ketik | Harga Saham Rata-rata | Saham (MM) |
ΔSaham (%) |
ΔSaham (%) |
Nilai ($MM) |
Portpolyo (%) |
ΔPortofolio (%) |
|
|---|---|---|---|---|---|---|---|---|---|
| AMP / Ameriprise Financial, Inc. | 0.84 | 3.08 | 450.86 | 13.65 | 2.0427 | 0.1631 | |||
| LPLA / LPL Financial Holdings Inc. | 1.14 | 3.63 | 427.66 | 18.79 | 1.9376 | 0.2318 | |||
| HWM / Howmet Aerospace Inc. | 2.14 | -31.00 | 399.18 | -1.00 | 1.8085 | -0.1018 | |||
| AZO / AutoZone, Inc. | 0.10 | -8.17 | 386.24 | -10.59 | 1.7499 | -0.2967 | |||
| 7839989D1 / SSC GOVERNMENT MM GVMXX GVMXX | 383.18 | -25.37 | 383.18 | -25.37 | 1.7360 | -0.6964 | |||
| NSC / Norfolk Southern Corporation | 1.36 | -2.05 | 347.92 | 5.86 | 1.5763 | 0.0191 | |||
| COR / Cencora, Inc. | 0.99 | -31.72 | 297.09 | -26.37 | 1.3460 | -0.5657 | |||
| CHKP / Check Point Software Technologies Ltd. | 1.33 | -20.27 | 293.21 | -22.61 | 1.3284 | -0.4665 | |||
| TXT / Textron Inc. | 3.63 | -2.04 | 291.09 | 8.86 | 1.3188 | 0.0519 | |||
| EVR / Evercore Inc. | 1.06 | 8.81 | 287.10 | 47.12 | 1.3007 | 0.3761 | |||
| SPG / Simon Property Group, Inc. | 1.72 | -2.05 | 276.65 | -5.19 | 1.2534 | -0.1290 | |||
| ALLE / Allegion plc | 1.86 | -2.05 | 267.38 | 8.21 | 1.2114 | 0.0407 | |||
| MKL / Markel Group Inc. | 0.13 | -2.08 | 267.19 | 4.61 | 1.2105 | 0.0004 | |||
| SGI / Somnigroup International Inc. | 3.88 | 1.75 | 264.27 | 15.63 | 1.1973 | 0.1145 | |||
| HBAN / Huntington Bancshares Incorporated | 15.26 | -2.06 | 255.78 | 9.35 | 1.1588 | 0.0507 | |||
| USFD / US Foods Holding Corp. | 3.31 | -2.01 | 254.82 | 15.29 | 1.1545 | 0.1073 | |||
| CG / The Carlyle Group Inc. | 4.89 | -2.04 | 251.18 | 15.51 | 1.1380 | 0.1077 | |||
| EBAY / eBay Inc. | 3.35 | -2.04 | 249.19 | 7.69 | 1.1290 | 0.0327 | |||
| KEYS / Keysight Technologies, Inc. | 1.47 | -2.04 | 241.41 | 7.18 | 1.0937 | 0.0266 | |||
| RBA / RB Global, Inc. | 2.27 | -2.04 | 241.39 | 3.71 | 1.0937 | -0.0091 | |||
| DTE / DTE Energy Company | 1.80 | -11.34 | 238.67 | -15.06 | 1.0813 | -0.2500 | |||
| MAS / Masco Corporation | 3.68 | 18.97 | 236.84 | 10.11 | 1.0730 | 0.0540 | |||
| MPC / Marathon Petroleum Corporation | 1.42 | -2.27 | 235.87 | 11.43 | 1.0686 | 0.0657 | |||
| NVR / NVR, Inc. | 0.03 | 16.35 | 232.00 | 18.61 | 1.0511 | 0.1244 | |||
| FTI / TechnipFMC plc | 6.60 | 514.06 | 227.45 | 567.35 | 1.0305 | 0.8690 | |||
| RS / Reliance, Inc. | 0.72 | -2.05 | 225.26 | 6.49 | 1.0205 | 0.0183 | |||
| MCHP / Microchip Technology Incorporated | 3.18 | 18.89 | 223.77 | 72.82 | 1.0138 | 0.4003 | |||
| THC / Tenet Healthcare Corporation | 1.24 | 74.92 | 218.70 | 128.90 | 0.9908 | 0.5382 | |||
| EWBC / East West Bancorp, Inc. | 2.16 | 45.09 | 218.31 | 63.23 | 0.9891 | 0.3554 | |||
| SYF / Synchrony Financial | 3.21 | -13.50 | 214.30 | 9.05 | 0.9709 | 0.0399 | |||
| EQT / EQT Corporation | 3.58 | -11.31 | 208.86 | -3.20 | 0.9463 | -0.0759 | |||
| EXPD / Expeditors International of Washington, Inc. | 1.83 | -21.44 | 208.52 | -25.36 | 0.9447 | -0.3788 | |||
| CF / CF Industries Holdings, Inc. | 2.24 | -14.19 | 205.90 | 1.01 | 0.9329 | -0.0329 | |||
| ZBRA / Zebra Technologies Corporation | 0.67 | -2.05 | 205.82 | 6.89 | 0.9325 | 0.0202 | |||
| RRC / Range Resources Corporation | 4.93 | -2.04 | 200.42 | -0.23 | 0.9080 | -0.0437 | |||
| CDW / CDW Corporation | 1.12 | 273.85 | 199.22 | 195.03 | 0.9026 | 0.6159 | |||
| LAMR / Lamar Advertising Company | 1.62 | -2.04 | 196.15 | 4.49 | 0.8887 | -0.0007 | |||
| GNRC / Generac Holdings Inc. | 1.31 | -2.04 | 187.50 | 10.77 | 0.8495 | 0.0475 | |||
| JBL / Jabil Inc. | 0.85 | 186.16 | 0.8434 | 0.8434 | |||||
| SYY / Sysco Corporation | 2.44 | -12.67 | 184.46 | -11.85 | 0.8357 | -0.1557 | |||
| FTDR / Frontdoor, Inc. | 3.09 | -2.04 | 181.96 | 50.27 | 0.8244 | 0.2507 | |||
| CACI / CACI International Inc | 0.38 | 60.28 | 180.16 | 108.24 | 0.8162 | 0.4063 | |||
| BYD / Boyd Gaming Corporation | 2.30 | -2.04 | 180.04 | 16.41 | 0.8157 | 0.0830 | |||
| OGE / OGE Energy Corp. | 4.06 | 17.56 | 180.00 | 13.52 | 0.8155 | 0.0643 | |||
| JH COLLATERAL / STIV (N/A) | 17.96 | 179.66 | 0.8140 | 0.8140 | |||||
| FLEX / Flex Ltd. | 3.59 | -2.09 | 179.01 | 47.76 | 0.8110 | 0.2370 | |||
| EFX / Equifax Inc. | 0.69 | -2.05 | 178.62 | 4.31 | 0.8093 | -0.0020 | |||
| PKG / Packaging Corporation of America | 0.94 | -2.49 | 177.53 | -7.21 | 0.8043 | -0.1021 | |||
| DELL / Dell Technologies Inc. | 1.44 | 65.00 | 176.55 | 121.93 | 0.7999 | 0.4230 | |||
| REG / Regency Centers Corporation | 2.47 | -11.75 | 176.09 | -14.78 | 0.7978 | -0.1812 | |||
| SOLV / Solventum Corporation | 2.31 | -2.04 | 175.45 | -2.30 | 0.7949 | -0.0559 | |||
| SLM / SLM Corporation | 5.35 | -2.04 | 175.35 | 9.36 | 0.7944 | 0.0348 | |||
| LRCX / Lam Research Corporation | 1.80 | 54.51 | 175.23 | 106.88 | 0.7939 | 0.3926 | |||
| ESS / Essex Property Trust, Inc. | 0.62 | 28.72 | 174.39 | 18.99 | 0.7901 | 0.0957 | |||
| GEN / Gen Digital Inc. | 5.93 | -2.05 | 174.20 | 8.51 | 0.7892 | 0.0286 | |||
| NTAP / NetApp, Inc. | 1.62 | 74.71 | 172.95 | 111.92 | 0.7836 | 0.3969 | |||
| SF / Stifel Financial Corp. | 1.62 | 168.37 | 0.7628 | 0.7628 | |||||
| ETR / Entergy Corporation | 2.00 | -12.91 | 166.26 | -15.32 | 0.7532 | -0.1770 | |||
| MOS / The Mosaic Company | 4.43 | -14.14 | 161.78 | 15.97 | 0.7330 | 0.0720 | |||
| AMG / Affiliated Managers Group, Inc. | 0.82 | -2.04 | 160.55 | 14.72 | 0.7274 | 0.0643 | |||
| PRMB / Primo Brands Corporation | 5.39 | 13.70 | 159.58 | -5.10 | 0.7230 | -0.0737 | |||
| SSNC / SS&C Technologies Holdings, Inc. | 1.92 | -19.88 | 158.93 | -20.58 | 0.7201 | -0.2280 | |||
| WTS / Watts Water Technologies, Inc. | 0.64 | -2.05 | 157.13 | 18.10 | 0.7119 | 0.0816 | |||
| BLD / TopBuild Corp. | 0.48 | 101.83 | 155.98 | 114.26 | 0.7067 | 0.3618 | |||
| FITB / Fifth Third Bancorp | 3.77 | -50.06 | 155.11 | -47.60 | 0.7027 | -0.6996 | |||
| AME / AMETEK, Inc. | 0.85 | -24.32 | 153.16 | -20.44 | 0.6939 | -0.2182 | |||
| BALL / Ball Corporation | 2.69 | -2.04 | 150.99 | 5.52 | 0.6841 | 0.0061 | |||
| TEL / TE Connectivity plc | 0.89 | 44.01 | 150.61 | 71.88 | 0.6823 | 0.2672 | |||
| LDOS / Leidos Holdings, Inc. | 0.95 | -2.02 | 150.57 | 14.55 | 0.6822 | 0.0594 | |||
| COKE / Coca-Cola Consolidated, Inc. | 1.34 | 881.28 | 149.24 | -18.84 | 0.6762 | -0.1951 | |||
| RKT / Rocket Companies, Inc. | 10.45 | 17.39 | 148.25 | 37.91 | 0.6716 | 0.1624 | |||
| FAF / First American Financial Corporation | 2.40 | 16.57 | 147.46 | 9.04 | 0.6681 | 0.0273 | |||
| BXP / Boston Properties, Inc. | 2.14 | 13.97 | 144.47 | 14.45 | 0.6545 | 0.0565 | |||
| EGP / EastGroup Properties, Inc. | 0.85 | -2.05 | 141.82 | -7.07 | 0.6425 | -0.0805 | |||
| MAR / Marriott International, Inc. | 0.52 | 64.24 | 141.62 | 85.60 | 0.6416 | 0.2963 | |||
| RL / Ralph Lauren Corporation | 0.50 | -26.84 | 138.37 | -9.10 | 0.6269 | -0.0943 | |||
| EQH / Equitable Holdings, Inc. | 2.46 | 66.08 | 138.10 | 78.87 | 0.6257 | 0.2599 | |||
| STX / Seagate Technology Holdings plc | 0.95 | 137.66 | 0.6237 | 0.6237 | |||||
| FANG / Diamondback Energy, Inc. | 1.00 | -14.32 | 137.62 | -26.36 | 0.6235 | -0.2620 | |||
| VOYA / Voya Financial, Inc. | 1.89 | 99.87 | 134.47 | 109.43 | 0.6092 | 0.3050 | |||
| IDCC / InterDigital, Inc. | 0.60 | -2.05 | 134.36 | 6.23 | 0.6087 | 0.0095 | |||
| LHX / L3Harris Technologies, Inc. | 0.53 | -37.62 | 133.52 | -25.25 | 0.6049 | -0.2413 | |||
| NRG / NRG Energy, Inc. | 0.83 | 7.10 | 133.34 | 80.15 | 0.6041 | 0.2534 | |||
| TRV / The Travelers Companies, Inc. | 0.50 | -15.64 | 132.69 | -14.65 | 0.6011 | -0.1354 | |||
| UFPI / UFP Industries, Inc. | 1.31 | 25.30 | 129.78 | 16.31 | 0.5880 | 0.0593 | |||
| CART / Maplebear Inc. | 2.82 | 94.29 | 127.67 | 120.35 | 0.5784 | 0.3039 | |||
| HRB / H&R Block, Inc. | 2.32 | -14.34 | 127.58 | -14.37 | 0.5780 | -0.1279 | |||
| ELS / Equity LifeStyle Properties, Inc. | 2.04 | -2.04 | 125.96 | -9.43 | 0.5707 | -0.0882 | |||
| PH / Parker-Hannifin Corporation | 0.18 | -40.08 | 124.00 | -31.14 | 0.5618 | -0.2914 | |||
| CMC / Commercial Metals Company | 2.53 | -2.04 | 123.81 | 4.13 | 0.5609 | -0.0024 | |||
| ROST / Ross Stores, Inc. | 0.97 | -14.53 | 123.44 | -14.67 | 0.5592 | -0.1261 | |||
| ARW / Arrow Electronics, Inc. | 0.97 | 5.05 | 123.14 | 28.93 | 0.5579 | 0.1054 | |||
| CCEP / Coca-Cola Europacific Partners PLC | 1.32 | -16.04 | 122.73 | -10.55 | 0.5560 | -0.0940 | |||
| BRO / Brown & Brown, Inc. | 1.10 | 121.98 | 0.5526 | 0.5526 | |||||
| DD / DuPont de Nemours, Inc. | 1.77 | -2.04 | 121.50 | -10.03 | 0.5505 | -0.0894 | |||
| DRI / Darden Restaurants, Inc. | 0.56 | 19.62 | 121.00 | 25.50 | 0.5482 | 0.0914 | |||
| CNP / CenterPoint Energy, Inc. | 3.27 | -15.61 | 120.08 | -14.42 | 0.5440 | -0.1207 | |||
| FCX / Freeport-McMoRan Inc. | 2.75 | -17.33 | 119.12 | -5.34 | 0.5397 | -0.0565 | |||
| CROX / Crocs, Inc. | 1.17 | 118.96 | 0.5390 | 0.5390 | |||||
| MMM / 3M Company | 0.78 | 118.37 | 0.5363 | 0.5363 | |||||
| EQR / Equity Residential | 1.71 | -2.04 | 115.70 | -7.64 | 0.5242 | -0.0693 | |||
| FE / FirstEnergy Corp. | 2.80 | -42.50 | 112.60 | -42.73 | 0.5101 | -0.4213 | |||
| MCK / McKesson Corporation | 0.15 | -29.20 | 108.48 | -22.91 | 0.4915 | -0.1752 | |||
| VVV / Valvoline Inc. | 2.86 | 67.04 | 108.42 | 81.72 | 0.4912 | 0.2085 | |||
| DOV / Dover Corporation | 0.59 | -2.36 | 107.99 | 1.83 | 0.4893 | -0.0132 | |||
| MOH / Molina Healthcare, Inc. | 0.36 | -2.58 | 107.39 | -11.90 | 0.4865 | -0.0910 | |||
| WH / Wyndham Hotels & Resorts, Inc. | 1.32 | -1.82 | 106.91 | -11.91 | 0.4844 | -0.0906 | |||
| RNR / RenaissanceRe Holdings Ltd. | 0.44 | -28.86 | 105.74 | -28.00 | 0.4790 | -0.2168 | |||
| MSM / MSC Industrial Direct Co., Inc. | 1.24 | -2.04 | 105.72 | 7.23 | 0.4790 | 0.0119 | |||
| EXR / Extra Space Storage Inc. | 0.71 | -18.98 | 105.10 | -19.56 | 0.4762 | -0.1428 | |||
| LSTR / Landstar System, Inc. | 0.74 | 21.16 | 103.40 | 12.15 | 0.4685 | 0.0316 | |||
| VICI / VICI Properties Inc. | 3.17 | -25.97 | 103.32 | -26.01 | 0.4681 | -0.1935 | |||
| CHRD / Chord Energy Corporation | 1.05 | -17.87 | 101.98 | -29.43 | 0.4620 | -0.2227 | |||
| LECO / Lincoln Electric Holdings, Inc. | 0.49 | 101.73 | 0.4609 | 0.4609 | |||||
| FIS / Fidelity National Information Services, Inc. | 1.22 | -2.04 | 99.51 | 6.79 | 0.4508 | 0.0094 | |||
| LW / Lamb Weston Holdings, Inc. | 1.91 | -20.91 | 98.79 | -23.06 | 0.4476 | -0.1607 | |||
| PSX / Phillips 66 | 0.81 | -2.04 | 96.53 | -5.35 | 0.4374 | -0.0459 | |||
| DGX / Quest Diagnostics Incorporated | 0.53 | -2.04 | 96.01 | 3.99 | 0.4350 | -0.0024 | |||
| REZI / Resideo Technologies, Inc. | 4.23 | -2.04 | 93.42 | 22.09 | 0.4232 | 0.0607 | |||
| GNTX / Gentex Corporation | 4.16 | -2.04 | 91.48 | -7.55 | 0.4145 | -0.0543 | |||
| OKE / ONEOK, Inc. | 1.10 | 52.26 | 90.08 | 25.27 | 0.4081 | 0.0674 | |||
| WEX / WEX Inc. | 0.61 | 89.68 | 0.4063 | 0.4063 | |||||
| CHDN / Churchill Downs Incorporated | 0.88 | -28.62 | 89.33 | -35.09 | 0.4047 | -0.2474 | |||
| PR / Permian Resources Corporation | 6.54 | 89.03 | 0.4034 | 0.4034 | |||||
| LKQ / LKQ Corporation | 2.30 | 9.61 | 85.16 | -4.64 | 0.3858 | -0.0373 | |||
| ITT / ITT Inc. | 0.49 | -2.03 | 76.96 | 18.95 | 0.3487 | 0.0421 | |||
| BLDR / Builders FirstSource, Inc. | 0.64 | 52.17 | 75.10 | 42.12 | 0.3402 | 0.0899 | |||
| HOG / Harley-Davidson, Inc. | 2.83 | -2.04 | 66.81 | -8.44 | 0.3027 | -0.0430 | |||
| SAIC / Science Applications International Corporation | 0.59 | -38.56 | 66.44 | -38.37 | 0.3010 | -0.2098 | |||
| MBC / MasterBrand, Inc. | 4.85 | -2.04 | 53.00 | -18.02 | 0.2401 | -0.0662 | |||
| CVCO / Cavco Industries, Inc. | 0.08 | 35.05 | 0.1588 | 0.1588 |