Mga Batayang Estadistika
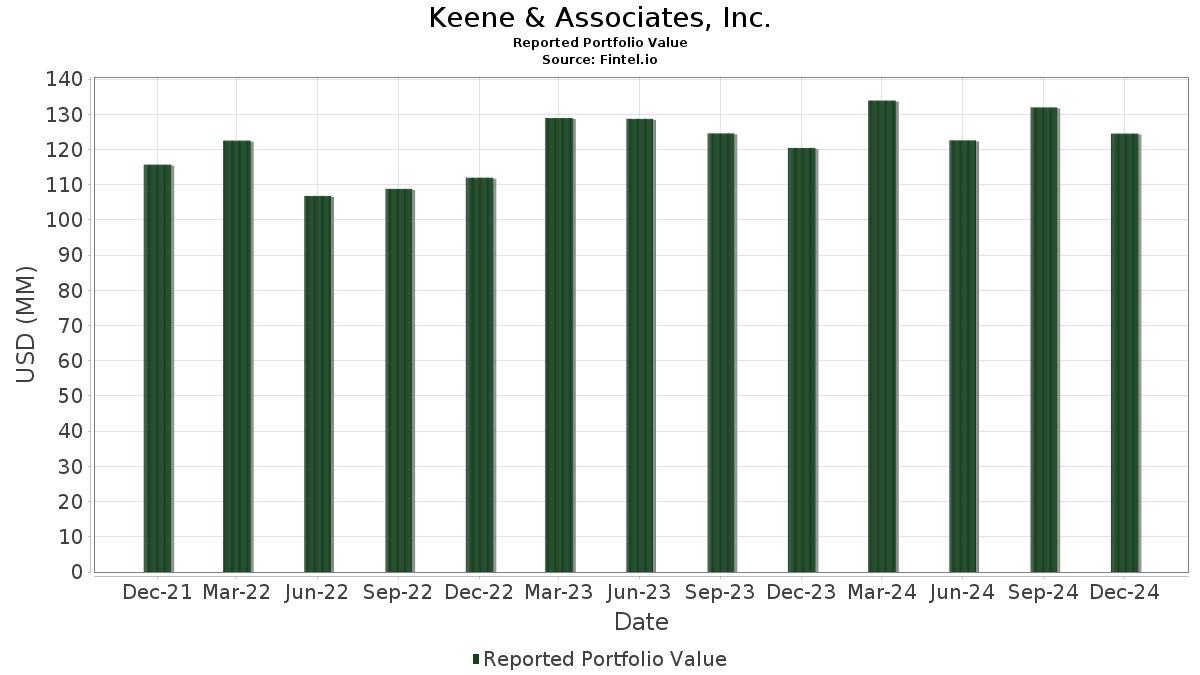
| Nilai Portofolio | $ 124,541,329 |
| Posisi Saat Ini | 76 |
Kepemilikan Terbaru, Kinerja, AUM (dari 13F, 13D)
Keene & Associates, Inc. telah mengungkapkan total kepemilikan 76 dalam pengajuan SEC terbaru mereka. Nilai portofolio terbaru dihitung sebesar $ 124,541,329 USD. Aset yang Dikelola (AUM) sebenarnya adalah nilai ini ditambah kas (yang tidak diungkapkan). Aset-aset utama Keene & Associates, Inc. adalah Walmart Inc. (US:WMT) , Kinder Morgan, Inc. (US:KMI) , Cisco Systems, Inc. (US:CSCO) , Microsoft Corporation (US:MSFT) , and Ingredion Incorporated (US:INGR) . Posisi baru Keene & Associates, Inc. meliputi: Jacobs Solutions Inc. (US:J) , Conagra Brands, Inc. (US:CAG) , Red Rock Resorts, Inc. (US:RRR) , CSW Industrials, Inc. (US:CSWI) , and .
Peningkatan Tertinggi Kuartal Ini
Kami menggunakan perubahan dalam alokasi portofolio karena ini adalah metrik yang paling bermakna. Perubahan dapat disebabkan oleh perdagangan atau perubahan harga saham.
| Keamanan | Saham (MM) |
Nilai (Juta Dolar AS) |
Portfolio % | ΔPorsyento ng Portfolio |
|---|---|---|---|---|
| 0.02 | 2.97 | 2.3869 | 2.3869 | |
| 0.09 | 2.40 | 1.9285 | 1.9285 | |
| 0.17 | 4.73 | 3.7957 | 0.8854 | |
| 0.02 | 1.85 | 1.4851 | 0.8317 | |
| 0.03 | 3.37 | 2.7059 | 0.5614 | |
| 0.07 | 4.41 | 3.5394 | 0.5417 | |
| 0.01 | 0.55 | 0.4399 | 0.4399 | |
| 0.00 | 0.53 | 0.4249 | 0.4249 | |
| 0.05 | 4.95 | 3.9748 | 0.4072 | |
| 0.06 | 3.50 | 2.8103 | 0.3972 |
Penurunan Tertinggi Kuartal Ini
Kami menggunakan perubahan dalam alokasi portofolio karena ini adalah metrik yang paling bermakna. Perubahan dapat disebabkan oleh perdagangan atau perubahan harga saham.
| Keamanan | Saham (MM) |
Nilai (Juta Dolar AS) |
Portfolio % | ΔPorsyento ng Portfolio |
|---|---|---|---|---|
| 0.00 | 0.00 | -1.5841 | ||
| 0.06 | 2.42 | 1.9406 | -1.4677 | |
| 0.07 | 2.15 | 1.7258 | -0.9640 | |
| 0.05 | 1.55 | 1.2439 | -0.9277 | |
| 0.04 | 1.59 | 1.2743 | -0.8539 | |
| 0.20 | 3.17 | 2.5486 | -0.6332 | |
| 0.10 | 2.52 | 2.0253 | -0.4306 | |
| 0.00 | 0.00 | -0.3307 | ||
| 0.00 | 0.00 | -0.2484 | ||
| 0.01 | 0.79 | 0.6323 | -0.1894 |
Pengajuan 13F dan Dana
Formulir ini diajukan pada 2025-02-03 untuk periode pelaporan 2024-12-31. Klik ikon tautan untuk melihat riwayat transaksi selengkapnya.
Tingkatkan ke versi premium untuk membuka data premium dan ekspor ke Excel. ![]() .
.
| Keamanan | Ketik | Harga Saham Rata-rata | Saham (MM) |
ΔSaham (%) |
ΔSaham (%) |
Nilai ($MM) |
Portpolyo (%) |
ΔPortofolio (%) |
|
|---|---|---|---|---|---|---|---|---|---|
| WMT / Walmart Inc. | 0.05 | -6.04 | 4.95 | 5.14 | 3.9748 | 0.4072 | |||
| KMI / Kinder Morgan, Inc. | 0.17 | -0.78 | 4.73 | 23.07 | 3.7957 | 0.8854 | |||
| CSCO / Cisco Systems, Inc. | 0.07 | 0.16 | 4.41 | 11.40 | 3.5394 | 0.5417 | |||
| MSFT / Microsoft Corporation | 0.01 | 1.43 | 4.28 | -0.65 | 3.4354 | 0.1726 | |||
| INGR / Ingredion Incorporated | 0.03 | -0.48 | 4.21 | -0.38 | 3.3774 | 0.1782 | |||
| FDX / FedEx Corporation | 0.01 | 2.91 | 4.13 | 5.78 | 3.3202 | 0.3587 | |||
| ORCL / Oracle Corporation | 0.02 | -7.49 | 4.13 | -9.54 | 3.3184 | -0.1429 | |||
| GLW / Corning Incorporated | 0.09 | -5.20 | 4.05 | -0.22 | 3.2509 | 0.1763 | |||
| EVRG / Evergy, Inc. | 0.06 | 0.49 | 3.95 | -0.25 | 3.1748 | 0.1715 | |||
| DUK / Duke Energy Corporation | 0.03 | 1.01 | 3.58 | -5.61 | 2.8782 | 0.0008 | |||
| BMY / Bristol-Myers Squibb Company | 0.06 | 0.53 | 3.50 | 9.89 | 2.8103 | 0.3972 | |||
| TSN / Tyson Foods, Inc. | 0.06 | 1.77 | 3.45 | -1.85 | 2.7729 | 0.1070 | |||
| VZ / Verizon Communications Inc. | 0.09 | 1.64 | 3.41 | -9.49 | 2.7413 | -0.1167 | |||
| DIS / The Walt Disney Company | 0.03 | 2.85 | 3.37 | 19.08 | 2.7059 | 0.5614 | |||
| KMB / Kimberly-Clark Corporation | 0.03 | 2.53 | 3.32 | -5.57 | 2.6677 | 0.0020 | |||
| GD / General Dynamics Corporation | 0.01 | 4.26 | 3.24 | -9.10 | 2.5983 | -0.0988 | |||
| GOLD / Barrick Mining Corporation | 0.20 | -3.01 | 3.17 | -24.41 | 2.5486 | -0.6332 | |||
| MDT / Medtronic plc | 0.04 | 1.82 | 3.17 | -9.64 | 2.5431 | -0.1132 | |||
| SLB / Schlumberger Limited | 0.08 | 7.89 | 3.12 | -1.42 | 2.5083 | 0.1079 | |||
| PEP / PepsiCo, Inc. | 0.02 | 4.08 | 3.02 | -6.93 | 2.4269 | -0.0336 | |||
| J / Jacobs Solutions Inc. | 0.02 | 2.97 | 2.3869 | 2.3869 | |||||
| JNJ / Johnson & Johnson | 0.02 | 5.91 | 2.94 | -5.50 | 2.3605 | 0.0037 | |||
| MRK / Merck & Co., Inc. | 0.03 | 9.29 | 2.91 | -4.28 | 2.3356 | 0.0336 | |||
| CVX / Chevron Corporation | 0.02 | 3.81 | 2.71 | 2.11 | 2.1793 | 0.1650 | |||
| PFE / Pfizer Inc. | 0.10 | -15.11 | 2.52 | -22.18 | 2.0253 | -0.4306 | |||
| NEM / Newmont Corporation | 0.06 | -22.84 | 2.42 | -46.29 | 1.9406 | -1.4677 | |||
| CAG / Conagra Brands, Inc. | 0.09 | 2.40 | 1.9285 | 1.9285 | |||||
| BWA / BorgWarner Inc. | 0.07 | -30.89 | 2.15 | -39.45 | 1.7258 | -0.9640 | |||
| BILZ / PIMCO ETF Trust - PIMCO Ultra Short Government Active Exchange-Traded Fund | 0.02 | 115.32 | 1.85 | 114.50 | 1.4851 | 0.8317 | |||
| RSP / Invesco Exchange-Traded Fund Trust - Invesco S&P 500 Equal Weight ETF | 0.01 | 0.57 | 1.73 | -1.64 | 1.3931 | 0.0567 | |||
| NTR / Nutrien Ltd. | 0.04 | -39.32 | 1.59 | -43.48 | 1.2743 | -0.8539 | |||
| DVN / Devon Energy Corporation | 0.05 | -35.40 | 1.55 | -45.95 | 1.2439 | -0.9277 | |||
| GLD / SPDR Gold Trust | 0.01 | 0.00 | 1.24 | -0.40 | 0.9983 | 0.0527 | |||
| ZBRA / Zebra Technologies Corporation | 0.00 | -5.15 | 0.99 | -1.10 | 0.7939 | 0.0366 | |||
| CTVA / Corteva, Inc. | 0.02 | 1.27 | 0.89 | -1.88 | 0.7128 | 0.0273 | |||
| HAE / Haemonetics Corporation | 0.01 | 7.18 | 0.85 | 4.16 | 0.6836 | 0.0640 | |||
| SMG / The Scotts Miracle-Gro Company | 0.01 | -5.11 | 0.79 | -27.40 | 0.6323 | -0.1894 | |||
| GOOGL / Alphabet Inc. | 0.00 | 11.61 | 0.75 | 27.38 | 0.6021 | 0.1561 | |||
| MTRX / Matrix Service Company | 0.06 | 0.12 | 0.74 | 3.95 | 0.5925 | 0.0546 | |||
| CFR / Cullen/Frost Bankers, Inc. | 0.01 | -0.15 | 0.70 | 19.80 | 0.5640 | 0.1199 | |||
| GEV / GE Vernova Inc. | 0.00 | -11.73 | 0.70 | 13.93 | 0.5583 | 0.0956 | |||
| SCHW / The Charles Schwab Corporation | 0.01 | -0.27 | 0.69 | 13.74 | 0.5524 | 0.0947 | |||
| BA / The Boeing Company | 0.00 | 51.12 | 0.63 | 75.98 | 0.5062 | 0.2347 | |||
| HD / The Home Depot, Inc. | 0.00 | -2.90 | 0.60 | -6.84 | 0.4816 | -0.0059 | |||
| AAPL / Apple Inc. | 0.00 | 8.11 | 0.57 | 16.19 | 0.4611 | 0.0865 | |||
| TGT / Target Corporation | 0.00 | 7.37 | 0.57 | -6.85 | 0.4588 | -0.0061 | |||
| RRR / Red Rock Resorts, Inc. | 0.01 | 0.55 | 0.4399 | 0.4399 | |||||
| CSWI / CSW Industrials, Inc. | 0.00 | 0.53 | 0.4249 | 0.4249 | |||||
| RVTY / Revvity, Inc. | 0.00 | 9.22 | 0.52 | -4.57 | 0.4192 | 0.0047 | |||
| OXY / Occidental Petroleum Corporation | 0.01 | 13.68 | 0.51 | 8.92 | 0.4122 | 0.0553 | |||
| VEVFX / Vanguard Scottsdale Funds - Vanguard Explorer Value Fund | 0.01 | 1.45 | 0.51 | 0.00 | 0.4120 | 0.0233 | |||
| RPRX / Royalty Pharma plc | 0.02 | 1.94 | 0.50 | -7.99 | 0.3978 | -0.0105 | |||
| ERII / Energy Recovery, Inc. | 0.03 | 15.50 | 0.48 | -2.24 | 0.3848 | 0.0129 | |||
| AGX / Argan, Inc. | 0.00 | -32.09 | 0.45 | -8.21 | 0.3590 | -0.0102 | |||
| MINT / PIMCO ETF Trust - PIMCO Enhanced Short Maturity Active Exchange-Traded Fund | 0.00 | 0.00 | 0.42 | -0.24 | 0.3408 | 0.0181 | |||
| JNPR / Juniper Networks, Inc. | 0.01 | -1.78 | 0.42 | -5.68 | 0.3336 | 0.0000 | |||
| RL / Ralph Lauren Corporation | 0.00 | -2.43 | 0.41 | 16.24 | 0.3277 | 0.0617 | |||
| HSII / Heidrick & Struggles International, Inc. | 0.01 | -2.16 | 0.40 | 11.70 | 0.3222 | 0.0497 | |||
| NFG / National Fuel Gas Company | 0.01 | 1.20 | 0.38 | 1.32 | 0.3084 | 0.0212 | |||
| LNG / Cheniere Energy, Inc. | 0.00 | -2.46 | 0.38 | 16.77 | 0.3076 | 0.0585 | |||
| NI / NiSource Inc. | 0.01 | -2.23 | 0.38 | 3.81 | 0.3062 | 0.0276 | |||
| UVV / Universal Corporation | 0.01 | -2.03 | 0.38 | 1.08 | 0.3015 | 0.0203 | |||
| UGL / ProShares Trust II - ProShares Ultra Gold | 0.00 | 0.00 | 0.37 | -2.61 | 0.3002 | 0.0096 | |||
| THS / TreeHouse Foods, Inc. | 0.01 | 0.58 | 0.37 | -16.02 | 0.2955 | -0.0358 | |||
| ELAN / Elanco Animal Health Incorporated | 0.03 | 27.39 | 0.35 | 4.75 | 0.2842 | 0.0288 | |||
| HSIC / Henry Schein, Inc. | 0.01 | 0.61 | 0.35 | -4.62 | 0.2826 | 0.0034 | |||
| DAR / Darling Ingredients Inc. | 0.01 | -22.10 | 0.34 | -29.40 | 0.2742 | -0.0921 | |||
| SNN / Smith & Nephew plc - Depositary Receipt (Common Stock) | 0.01 | 18.24 | 0.34 | -6.67 | 0.2701 | -0.0030 | |||
| HP / Helmerich & Payne, Inc. | 0.01 | 31.26 | 0.32 | 38.46 | 0.2607 | 0.0827 | |||
| RGLD / Royal Gold, Inc. | 0.00 | -8.69 | 0.31 | -14.25 | 0.2470 | -0.0246 | |||
| FLO / Flowers Foods, Inc. | 0.01 | -6.64 | 0.30 | -16.34 | 0.2387 | -0.0307 | |||
| TMV / Direxion Shares ETF Trust - Direxion Daily 20+ Year Treasury Bear 3X Shares | 0.01 | 0.00 | 0.30 | 37.50 | 0.2385 | 0.0747 | |||
| FMC / FMC Corporation | 0.00 | -21.68 | 0.24 | -42.45 | 0.1934 | -0.1226 | |||
| NG / NovaGold Resources Inc. | 0.01 | 0.00 | 0.03 | -19.51 | 0.0267 | -0.0043 | |||
| NGD / New Gold Inc. | 0.01 | 0.00 | 0.02 | -14.29 | 0.0199 | -0.0019 | |||
| VGZ / Vista Gold Corp. | 0.01 | 0.00 | 0.01 | -25.00 | 0.0050 | -0.0016 | |||
| INTC / Intel Corporation | 0.00 | -100.00 | 0.00 | -100.00 | -1.5841 | ||||
| MOS / The Mosaic Company | 0.00 | -100.00 | 0.00 | -100.00 | -0.2484 | ||||
| LFCR / Lifecore Biomedical, Inc. | 0.00 | -100.00 | 0.00 | 0.0000 | |||||
| AVNS / Avanos Medical, Inc. | 0.00 | -100.00 | 0.00 | -100.00 | -0.3307 | ||||
| SYNA / Synaptics Incorporated | 0.00 | -100.00 | 0.00 | 0.0000 | |||||
| UL / Unilever PLC - Depositary Receipt (Common Stock) | 0.00 | -100.00 | 0.00 | 0.0000 |