Mga Batayang Estadistika
| Nilai Portofolio | $ 167,003 |
| Posisi Saat Ini | 41 |
Kepemilikan Terbaru, Kinerja, AUM (dari 13F, 13D)
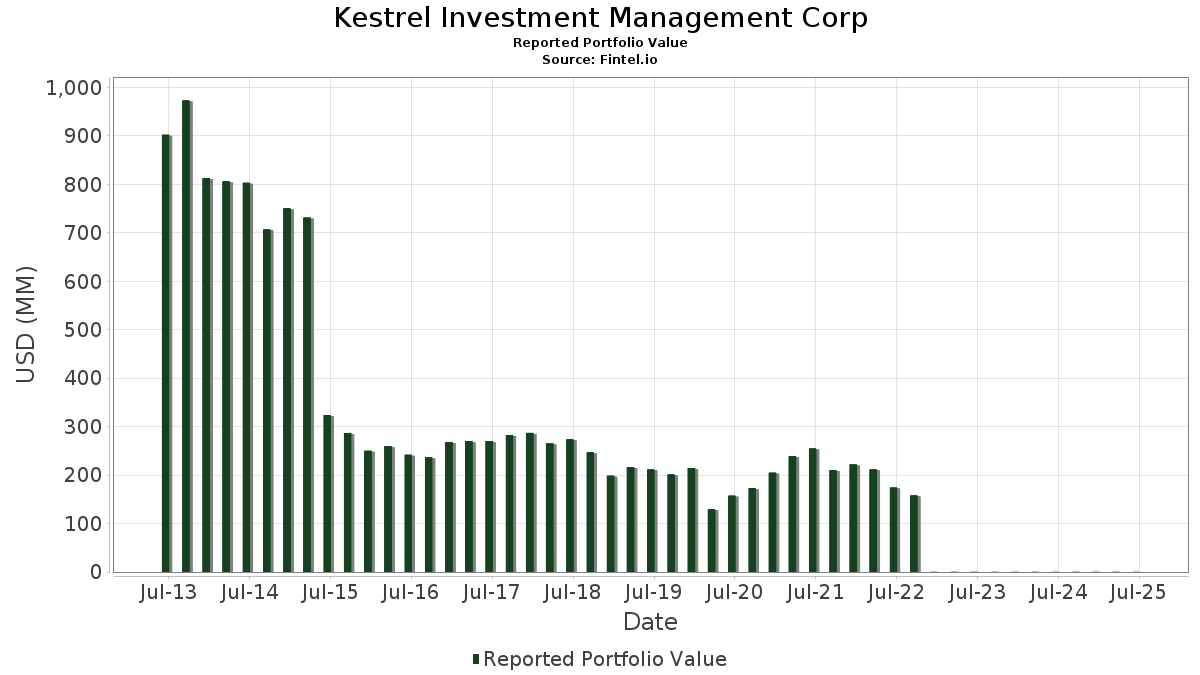
Kestrel Investment Management Corp telah mengungkapkan total kepemilikan 41 dalam pengajuan SEC terbaru mereka. Nilai portofolio terbaru dihitung sebesar $ 167,003 USD. Aset yang Dikelola (AUM) sebenarnya adalah nilai ini ditambah kas (yang tidak diungkapkan). Aset-aset utama Kestrel Investment Management Corp adalah PHINIA Inc. (US:PHIN) , Axos Financial, Inc. (US:AX) , Tri Pointe Homes, Inc. (US:TPH) , Radian Group Inc. (US:RDN) , and Adtalem Global Education Inc. (US:ATGE) . Posisi baru Kestrel Investment Management Corp meliputi: ZoomInfo Technologies Inc. (US:ZI) , .
Peningkatan Tertinggi Kuartal Ini
Kami menggunakan perubahan dalam alokasi portofolio karena ini adalah metrik yang paling bermakna. Perubahan dapat disebabkan oleh perdagangan atau perubahan harga saham.
| Keamanan | Saham (MM) |
Nilai (Juta Dolar AS) |
Portfolio % | ΔPorsyento ng Portfolio |
|---|---|---|---|---|
| 0.57 | 0.01 | 3.4598 | 3.4598 | |
| 0.12 | 0.00 | 1.7179 | 1.7179 | |
| 0.05 | 0.01 | 3.7556 | 0.5841 | |
| 0.03 | 0.01 | 3.0113 | 0.5489 | |
| 0.10 | 0.01 | 4.5233 | 0.4235 | |
| 0.38 | 0.01 | 3.1437 | 0.3331 | |
| 0.08 | 0.01 | 3.2694 | 0.3074 | |
| 0.07 | 0.00 | 1.3796 | 0.3017 | |
| 0.26 | 0.01 | 3.3526 | 0.2043 | |
| 0.21 | 0.00 | 1.0150 | 0.1911 |
Penurunan Tertinggi Kuartal Ini
Kami menggunakan perubahan dalam alokasi portofolio karena ini adalah metrik yang paling bermakna. Perubahan dapat disebabkan oleh perdagangan atau perubahan harga saham.
| Keamanan | Saham (MM) |
Nilai (Juta Dolar AS) |
Portfolio % | ΔPorsyento ng Portfolio |
|---|---|---|---|---|
| 0.16 | 0.00 | 1.9143 | -0.9390 | |
| 0.12 | 0.00 | 1.7125 | -0.7255 | |
| 0.16 | 0.01 | 3.6886 | -0.5658 | |
| 0.07 | 0.01 | 3.4880 | -0.5209 | |
| 0.09 | 0.01 | 3.0425 | -0.4570 | |
| 0.21 | 0.00 | 2.3580 | -0.4208 | |
| 0.10 | 0.01 | 3.2293 | -0.4045 | |
| 0.17 | 0.00 | 1.3617 | -0.2977 | |
| 0.23 | 0.01 | 4.3891 | -0.2927 | |
| 0.14 | 0.00 | 1.0323 | -0.2832 |
Pengajuan 13F dan Dana
Formulir ini diajukan pada 2025-07-31 untuk periode pelaporan 2025-06-30. Klik ikon tautan untuk melihat riwayat transaksi selengkapnya.
Tingkatkan ke versi premium untuk membuka data premium dan ekspor ke Excel. ![]() .
.
| Keamanan | Ketik | Harga Saham Rata-rata | Saham (MM) |
ΔSaham (%) |
ΔSaham (%) |
Nilai ($MM) |
Portpolyo (%) |
ΔPortofolio (%) |
|
|---|---|---|---|---|---|---|---|---|---|
| PHIN / PHINIA Inc. | 0.17 | -4.41 | 0.01 | 0.00 | 4.5634 | -0.0806 | |||
| AX / Axos Financial, Inc. | 0.10 | -4.52 | 0.01 | 16.67 | 4.5233 | 0.4235 | |||
| TPH / Tri Pointe Homes, Inc. | 0.23 | -4.46 | 0.01 | 0.00 | 4.3891 | -0.2927 | |||
| RDN / Radian Group Inc. | 0.20 | -4.54 | 0.01 | 16.67 | 4.3071 | 0.0821 | |||
| ATGE / Adtalem Global Education Inc. | 0.05 | -4.46 | 0.01 | 20.00 | 3.7556 | 0.5841 | |||
| CNO / CNO Financial Group, Inc. | 0.16 | -4.54 | 0.01 | 0.00 | 3.6886 | -0.5658 | |||
| UPWK / Upwork Inc. | 0.45 | -4.43 | 0.01 | 0.00 | 3.6293 | -0.1316 | |||
| PBH / Prestige Consumer Healthcare Inc. | 0.07 | -4.45 | 0.01 | -16.67 | 3.4880 | -0.5209 | |||
| ZI / ZoomInfo Technologies Inc. | 0.57 | 0.01 | 3.4598 | 3.4598 | |||||
| PINC / Premier, Inc. | 0.26 | -4.49 | 0.01 | 0.00 | 3.3526 | 0.2043 | |||
| ATKR / Atkore Inc. | 0.08 | -4.33 | 0.01 | 25.00 | 3.2694 | 0.3074 | |||
| CNXC / Concentrix Corporation | 0.10 | -4.58 | 0.01 | 0.00 | 3.2293 | -0.4045 | |||
| MRC / MRC Global Inc. | 0.38 | -4.47 | 0.01 | 25.00 | 3.1437 | 0.3331 | |||
| MDU / MDU Resources Group, Inc. | 0.31 | -4.53 | 0.01 | 0.00 | 3.0904 | -0.2589 | |||
| BHF / Brighthouse Financial, Inc. | 0.09 | -4.35 | 0.01 | 0.00 | 3.0425 | -0.4570 | |||
| THC / Tenet Healthcare Corporation | 0.03 | -4.67 | 0.01 | 25.00 | 3.0113 | 0.5489 | |||
| NATL / NCR Atleos Corporation | 0.16 | -4.54 | 0.00 | 0.00 | 2.7988 | 0.0328 | |||
| DNB / Dun & Bradstreet Holdings, Inc. | 0.49 | -4.44 | 0.00 | 0.00 | 2.6520 | -0.1298 | |||
| BLKB / Blackbaud, Inc. | 0.06 | -4.50 | 0.00 | 0.00 | 2.4491 | -0.0763 | |||
| PLAB / Photronics, Inc. | 0.21 | -4.56 | 0.00 | -25.00 | 2.3580 | -0.4208 | |||
| PGNY / Progyny, Inc. | 0.18 | -4.54 | 0.00 | -25.00 | 2.3533 | -0.1996 | |||
| XHR / Xenia Hotels & Resorts, Inc. | 0.31 | -4.44 | 0.00 | 0.00 | 2.3161 | 0.0033 | |||
| DRVN / Driven Brands Holdings Inc. | 0.22 | -4.59 | 0.00 | 0.00 | 2.2934 | -0.0995 | |||
| ADEA / Adeia Inc. | 0.27 | -4.39 | 0.00 | 0.00 | 2.2515 | 0.0058 | |||
| PFBC / Preferred Bank | 0.04 | -4.60 | 0.00 | 0.00 | 2.1479 | -0.0727 | |||
| BHLB / Berkshire Hills Bancorp, Inc. | 0.14 | -4.60 | 0.00 | 0.00 | 2.1137 | -0.2406 | |||
| THS / TreeHouse Foods, Inc. | 0.16 | -4.52 | 0.00 | -25.00 | 1.9143 | -0.9390 | |||
| MATW / Matthews International Corporation | 0.12 | 0.00 | 1.7179 | 1.7179 | |||||
| EPC / Edgewell Personal Care Company | 0.12 | -4.46 | 0.00 | -33.33 | 1.7125 | -0.7255 | |||
| KOP / Koppers Holdings Inc. | 0.09 | -4.20 | 0.00 | 0.00 | 1.6700 | 0.1218 | |||
| SAIC / Science Applications International Corporation | 0.02 | -4.61 | 0.00 | 0.00 | 1.5335 | -0.1020 | |||
| AAMI / Acadian Asset Management Inc. | 0.07 | -4.25 | 0.00 | 100.00 | 1.3796 | 0.3017 | |||
| CCRN / Cross Country Healthcare, Inc. | 0.17 | -4.49 | 0.00 | 0.00 | 1.3617 | -0.2977 | |||
| SBSI / Southside Bancshares, Inc. | 0.07 | -4.26 | 0.00 | 0.00 | 1.2670 | -0.0613 | |||
| TMST / TimkenSteel Corporation | 0.14 | -4.49 | 0.00 | 100.00 | 1.2545 | 0.0929 | |||
| AVNS / Avanos Medical, Inc. | 0.15 | -4.51 | 0.00 | -50.00 | 1.0718 | -0.2663 | |||
| RNGR / Ranger Energy Services, Inc. | 0.14 | -4.87 | 0.00 | -50.00 | 1.0323 | -0.2832 | |||
| HDSN / Hudson Technologies, Inc. | 0.21 | -4.48 | 0.00 | 0.00 | 1.0150 | 0.1911 | |||
| FORR / Forrester Research, Inc. | 0.10 | -4.71 | 0.00 | 0.5635 | 0.0004 | ||||
| RLGT / Radiant Logistics, Inc. | 0.13 | -4.74 | 0.00 | 0.4826 | -0.0402 | ||||
| XPER / Xperi Inc. | 0.07 | -5.42 | 0.00 | 0.3467 | -0.0185 | ||||
| SHLS / Shoals Technologies Group, Inc. | 0.00 | -100.00 | 0.00 | 0.0000 |