Mga Batayang Estadistika
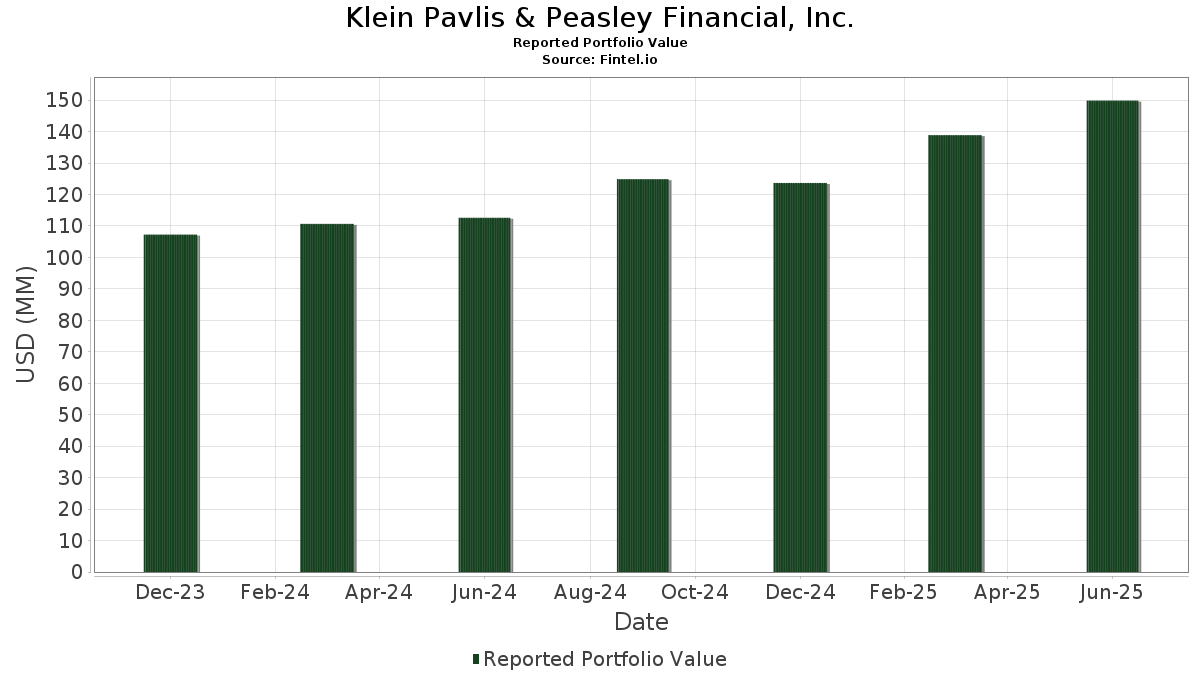
| Nilai Portofolio | $ 149,866,978 |
| Posisi Saat Ini | 73 |
Kepemilikan Terbaru, Kinerja, AUM (dari 13F, 13D)
Klein Pavlis & Peasley Financial, Inc. telah mengungkapkan total kepemilikan 73 dalam pengajuan SEC terbaru mereka. Nilai portofolio terbaru dihitung sebesar $ 149,866,978 USD. Aset yang Dikelola (AUM) sebenarnya adalah nilai ini ditambah kas (yang tidak diungkapkan). Aset-aset utama Klein Pavlis & Peasley Financial, Inc. adalah iShares Trust - iShares 0-3 Month Treasury Bond ETF (US:SGOV) , Cameco Corporation (US:CCJ) , Agnico Eagle Mines Limited (US:AEM) , Wheaton Precious Metals Corp. (US:WPM) , and RB Global, Inc. (US:RBA) . Posisi baru Klein Pavlis & Peasley Financial, Inc. meliputi: ICICI Bank Limited - Depositary Receipt (Common Stock) (US:IBN) , Alamos Gold Inc. (US:AGI) , Leidos Holdings, Inc. (US:LDOS) , The Southern Company (US:SO) , and Abbott Laboratories (US:ABT) .
Peningkatan Tertinggi Kuartal Ini
Kami menggunakan perubahan dalam alokasi portofolio karena ini adalah metrik yang paling bermakna. Perubahan dapat disebabkan oleh perdagangan atau perubahan harga saham.
| Keamanan | Saham (MM) |
Nilai (Juta Dolar AS) |
Portfolio % | ΔPorsyento ng Portfolio |
|---|---|---|---|---|
| 0.14 | 14.60 | 9.7417 | 4.8594 | |
| 0.09 | 3.17 | 2.1129 | 2.1129 | |
| 0.11 | 2.92 | 1.9497 | 1.9497 | |
| 0.02 | 2.56 | 1.7053 | 1.7053 | |
| 0.11 | 7.96 | 5.3085 | 1.6307 | |
| 0.03 | 2.35 | 1.5693 | 1.5693 | |
| 0.02 | 2.31 | 1.5428 | 1.5428 | |
| 0.08 | 1.76 | 1.1742 | 1.1742 | |
| 0.03 | 1.74 | 1.1582 | 1.1582 | |
| 0.04 | 1.14 | 0.7608 | 0.7608 |
Penurunan Tertinggi Kuartal Ini
Kami menggunakan perubahan dalam alokasi portofolio karena ini adalah metrik yang paling bermakna. Perubahan dapat disebabkan oleh perdagangan atau perubahan harga saham.
| Keamanan | Saham (MM) |
Nilai (Juta Dolar AS) |
Portfolio % | ΔPorsyento ng Portfolio |
|---|---|---|---|---|
| 0.01 | 1.04 | 0.6922 | -1.9138 | |
| 0.02 | 2.77 | 1.8507 | -1.7248 | |
| 0.00 | 0.33 | 0.2219 | -0.4612 | |
| 0.04 | 2.76 | 1.8427 | -0.4570 | |
| 0.06 | 4.53 | 3.0252 | -0.4474 | |
| 0.00 | 0.81 | 0.5382 | -0.3440 | |
| 0.03 | 2.42 | 1.6123 | -0.3323 | |
| 0.05 | 4.48 | 2.9875 | -0.2901 | |
| 0.02 | 2.58 | 1.7185 | -0.1892 | |
| 0.00 | 0.66 | 0.4415 | -0.1831 |
Pengajuan 13F dan Dana
Formulir ini diajukan pada 2025-07-17 untuk periode pelaporan 2025-06-30. Klik ikon tautan untuk melihat riwayat transaksi selengkapnya.
Tingkatkan ke versi premium untuk membuka data premium dan ekspor ke Excel. ![]() .
.
| Keamanan | Ketik | Harga Saham Rata-rata | Saham (MM) |
ΔSaham (%) |
ΔSaham (%) |
Nilai ($MM) |
Portpolyo (%) |
ΔPortofolio (%) |
|
|---|---|---|---|---|---|---|---|---|---|
| SGOV / iShares Trust - iShares 0-3 Month Treasury Bond ETF | 0.14 | 114.58 | 14.60 | 115.32 | 9.7417 | 4.8594 | |||
| CCJ / Cameco Corporation | 0.11 | -12.29 | 7.96 | 55.77 | 5.3085 | 1.6307 | |||
| AEM / Agnico Eagle Mines Limited | 0.07 | -5.05 | 7.87 | 4.32 | 5.2503 | -0.1804 | |||
| WPM / Wheaton Precious Metals Corp. | 0.06 | -1.64 | 5.59 | 14.95 | 3.7306 | 0.2289 | |||
| RBA / RB Global, Inc. | 0.05 | -2.74 | 5.01 | 2.89 | 3.3448 | -0.1627 | |||
| SCCO / Southern Copper Corporation | 0.05 | 3.45 | 4.65 | 11.49 | 3.1022 | 0.0996 | |||
| OKE / ONEOK, Inc. | 0.06 | 14.59 | 4.53 | -5.99 | 3.0252 | -0.4474 | |||
| SCHW / The Charles Schwab Corporation | 0.05 | -16.27 | 4.48 | -1.65 | 2.9875 | -0.2901 | |||
| JCI / Johnson Controls International plc | 0.04 | -4.56 | 4.45 | 23.86 | 2.9721 | 0.3823 | |||
| FMX / Fomento Económico Mexicano, S.A.B. de C.V. - Depositary Receipt (Common Stock) | 0.04 | 6.28 | 4.16 | 9.29 | 2.7783 | 0.0355 | |||
| MDT / Medtronic plc | 0.04 | 14.67 | 3.83 | 12.96 | 2.5588 | 0.1145 | |||
| IBN / ICICI Bank Limited - Depositary Receipt (Common Stock) | 0.09 | 3.17 | 2.1129 | 2.1129 | |||||
| ROK / Rockwell Automation, Inc. | 0.01 | -4.53 | 3.15 | 22.57 | 2.1020 | 0.2514 | |||
| AGI / Alamos Gold Inc. | 0.11 | 2.92 | 1.9497 | 1.9497 | |||||
| QCOM / QUALCOMM Incorporated | 0.02 | -1.65 | 2.81 | 2.33 | 1.8755 | -0.1022 | |||
| PM / Philip Morris International Inc. | 0.02 | -51.52 | 2.77 | -44.15 | 1.8507 | -1.7248 | |||
| MAS / Masco Corporation | 0.04 | -6.18 | 2.76 | -13.53 | 1.8427 | -0.4570 | |||
| CCI / Crown Castle Inc. | 0.03 | 70.75 | 2.58 | 67.73 | 1.7205 | 0.6133 | |||
| HIG / The Hartford Insurance Group, Inc. | 0.02 | -4.69 | 2.58 | -2.79 | 1.7185 | -0.1892 | |||
| LDOS / Leidos Holdings, Inc. | 0.02 | 2.56 | 1.7053 | 1.7053 | |||||
| UL / Unilever PLC - Depositary Receipt (Common Stock) | 0.04 | 10.72 | 2.53 | 13.73 | 1.6857 | 0.0858 | |||
| COP / ConocoPhillips | 0.03 | 5.07 | 2.42 | -10.52 | 1.6123 | -0.3323 | |||
| SO / The Southern Company | 0.03 | 2.35 | 1.5693 | 1.5693 | |||||
| ABT / Abbott Laboratories | 0.02 | 2.31 | 1.5428 | 1.5428 | |||||
| CIVI / Civitas Resources, Inc. | 0.08 | 30.36 | 2.24 | 4.68 | 1.4941 | -0.0465 | |||
| UNM / Unum Group | 0.03 | 42.68 | 2.15 | 40.51 | 1.4378 | 0.3337 | |||
| FNV / Franco-Nevada Corporation | 0.01 | 4.35 | 1.99 | 8.49 | 1.3304 | 0.0074 | |||
| TECK / Teck Resources Limited | 0.05 | 9.82 | 1.89 | 20.78 | 1.2605 | 0.1342 | |||
| B / Barrick Mining Corporation | 0.08 | 1.76 | 1.1742 | 1.1742 | |||||
| HSY / The Hershey Company | 0.01 | 46.03 | 1.76 | 42.88 | 1.1720 | 0.2868 | |||
| ERJ / Embraer S.A. - Depositary Receipt (Common Stock) | 0.03 | 1.74 | 1.1582 | 1.1582 | |||||
| XOM / Exxon Mobil Corporation | 0.01 | 9.79 | 1.60 | -0.56 | 1.0696 | -0.0913 | |||
| BKE / The Buckle, Inc. | 0.03 | -0.89 | 1.51 | 17.05 | 1.0077 | 0.0782 | |||
| CNQ / Canadian Natural Resources Limited | 0.05 | -1.80 | 1.49 | -1.58 | 0.9954 | -0.0957 | |||
| HUBB / Hubbell Incorporated | 0.00 | -4.71 | 1.46 | 16.95 | 0.9764 | 0.0753 | |||
| OSK / Oshkosh Corporation | 0.01 | -4.00 | 1.42 | 16.01 | 0.9479 | 0.0664 | |||
| OPRA / Opera Limited - Depositary Receipt (Common Stock) | 0.08 | 2.88 | 1.42 | 20.46 | 0.9471 | 0.0987 | |||
| AVB / AvalonBay Communities, Inc. | 0.01 | 5.18 | 1.41 | -0.21 | 0.9407 | -0.0767 | |||
| BWXT / BWX Technologies, Inc. | 0.01 | -3.05 | 1.38 | 38.99 | 0.9182 | 0.2052 | |||
| UPS / United Parcel Service, Inc. | 0.01 | 27.00 | 1.30 | 17.27 | 0.8706 | 0.0699 | |||
| SONY / Sony Group Corporation - Depositary Receipt (Common Stock) | 0.04 | 1.14 | 0.7608 | 0.7608 | |||||
| ZM / Zoom Communications Inc. | 0.01 | 0.92 | 1.06 | 6.35 | 0.7043 | -0.0106 | |||
| MCK / McKesson Corporation | 0.00 | -18.24 | 1.05 | -11.05 | 0.7036 | -0.1501 | |||
| FDS / FactSet Research Systems Inc. | 0.00 | 20.81 | 1.05 | 18.19 | 0.6984 | 0.0610 | |||
| SBUX / Starbucks Corporation | 0.01 | -69.27 | 1.04 | -71.35 | 0.6922 | -1.9138 | |||
| SD / SandRidge Energy, Inc. | 0.10 | -4.46 | 1.03 | -9.72 | 0.6884 | -0.1344 | |||
| PYPL / PayPal Holdings, Inc. | 0.01 | 0.74 | 0.99 | 13.20 | 0.6585 | 0.0312 | |||
| EMR / Emerson Electric Co. | 0.01 | -7.37 | 0.98 | 12.33 | 0.6568 | 0.0256 | |||
| AEP / American Electric Power Company, Inc. | 0.01 | 81.36 | 0.91 | 73.70 | 0.6043 | 0.2288 | |||
| KMT / Kennametal Inc. | 0.04 | -2.40 | 0.90 | 4.68 | 0.5976 | -0.0185 | |||
| CINF / Cincinnati Financial Corporation | 0.01 | -4.82 | 0.87 | -3.87 | 0.5804 | -0.0711 | |||
| ORI / Old Republic International Corporation | 0.02 | -1.85 | 0.86 | -4.75 | 0.5762 | -0.0768 | |||
| IIPR / Innovative Industrial Properties, Inc. | 0.02 | -4.84 | 0.84 | -5.94 | 0.5603 | -0.0822 | |||
| SFM / Sprouts Farmers Market, Inc. | 0.00 | -37.92 | 0.81 | -34.20 | 0.5382 | -0.3440 | |||
| FSM / Fortuna Mining Corp. | 0.12 | 2.41 | 0.80 | 9.25 | 0.5362 | 0.0066 | |||
| TTC / The Toro Company | 0.01 | -4.69 | 0.76 | -7.20 | 0.5080 | -0.0825 | |||
| ALL / The Allstate Corporation | 0.00 | -4.32 | 0.75 | -7.19 | 0.5003 | -0.0813 | |||
| STT / State Street Corporation | 0.01 | -3.40 | 0.68 | 15.67 | 0.4532 | 0.0303 | |||
| NDSN / Nordson Corporation | 0.00 | -4.44 | 0.67 | 1.98 | 0.4466 | -0.0261 | |||
| RH / RH | 0.00 | -3.53 | 0.66 | -23.76 | 0.4415 | -0.1831 | |||
| RCMT / RCM Technologies, Inc. | 0.02 | -9.36 | 0.44 | 33.54 | 0.2924 | 0.0555 | |||
| AAPL / Apple Inc. | 0.00 | -61.87 | 0.33 | -64.98 | 0.2219 | -0.4612 | |||
| MA / Mastercard Incorporated | 0.00 | 0.00 | 0.31 | 2.35 | 0.2040 | -0.0109 | |||
| FOXA / Fox Corporation | 0.00 | -0.18 | 0.28 | 0.36 | 0.1851 | -0.0142 | |||
| BRK.B / Berkshire Hathaway Inc. | 0.00 | 5.14 | 0.25 | -4.25 | 0.1656 | -0.0209 | |||
| FANG / Diamondback Energy, Inc. | 0.00 | -7.92 | 0.25 | -21.34 | 0.1653 | -0.0615 | |||
| ORCL / Oracle Corporation | 0.00 | -37.56 | 0.25 | -3.91 | 0.1647 | -0.0201 | |||
| MSFT / Microsoft Corporation | 0.00 | -31.86 | 0.25 | -11.55 | 0.1641 | -0.0354 | |||
| CME / CME Group Inc. | 0.00 | -19.75 | 0.24 | -15.62 | 0.1622 | -0.0453 | |||
| EQT / EQT Corporation | 0.00 | -19.46 | 0.23 | -12.73 | 0.1555 | -0.0370 | |||
| SSNC / SS&C Technologies Holdings, Inc. | 0.00 | 0.22 | 0.1437 | 0.1437 | |||||
| TJX / The TJX Companies, Inc. | 0.00 | -2.28 | 0.21 | -1.86 | 0.1411 | -0.0137 | |||
| SLM / SLM Corporation | 0.01 | -29.23 | 0.21 | -21.72 | 0.1399 | -0.0528 | |||
| RLI / RLI Corp. | 0.00 | -100.00 | 0.00 | 0.0000 | |||||
| LNTH / Lantheus Holdings, Inc. | 0.00 | -100.00 | 0.00 | 0.0000 | |||||
| HPQ / HP Inc. | 0.00 | -100.00 | 0.00 | 0.0000 | |||||
| FBIN / Fortune Brands Innovations, Inc. | 0.00 | -100.00 | 0.00 | 0.0000 | |||||
| BBY / Best Buy Co., Inc. | 0.00 | -100.00 | 0.00 | 0.0000 | |||||
| WSM / Williams-Sonoma, Inc. | 0.00 | -100.00 | 0.00 | 0.0000 | |||||
| GOLD / Barrick Mining Corporation | 0.00 | -100.00 | 0.00 | 0.0000 | |||||
| FE / FirstEnergy Corp. | 0.00 | -100.00 | 0.00 | 0.0000 | |||||
| DVN / Devon Energy Corporation | 0.00 | -100.00 | 0.00 | 0.0000 | |||||
| ALSN / Allison Transmission Holdings, Inc. | 0.00 | -100.00 | 0.00 | 0.0000 | |||||
| VNT / Vontier Corporation | 0.00 | -100.00 | 0.00 | 0.0000 | |||||
| EMN / Eastman Chemical Company | 0.00 | -100.00 | 0.00 | 0.0000 |