Mga Batayang Estadistika
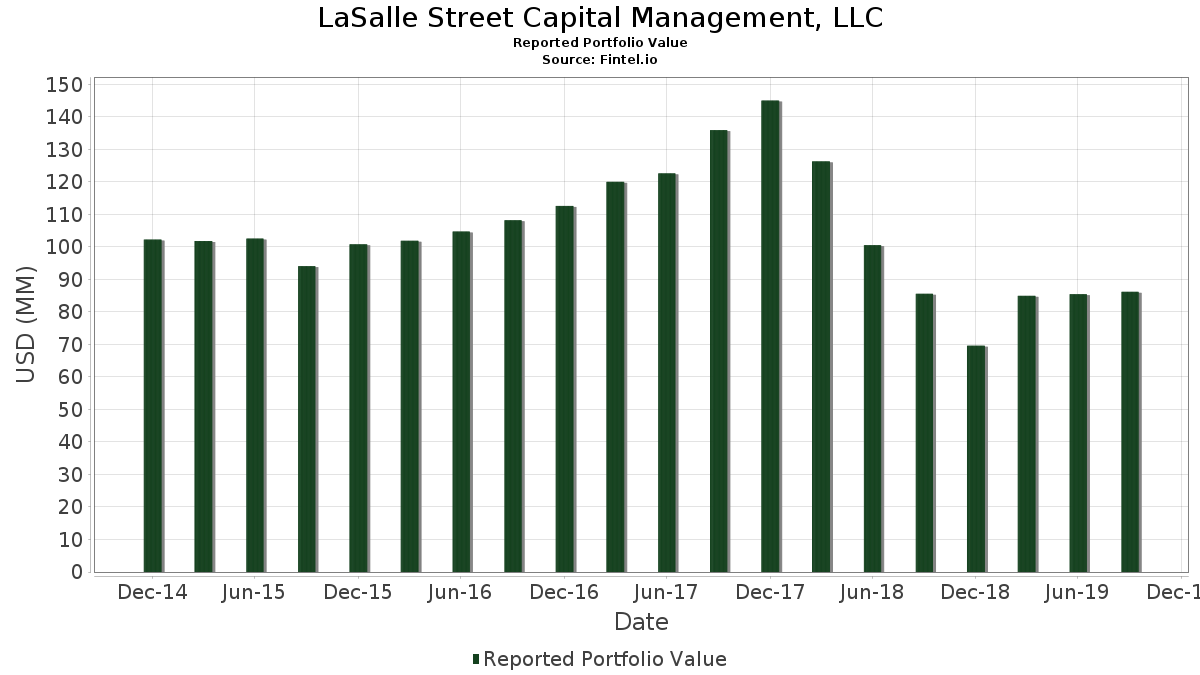
| Nilai Portofolio | $ 86,201,000 |
| Posisi Saat Ini | 88 |
Kepemilikan Terbaru, Kinerja, AUM (dari 13F, 13D)
LaSalle Street Capital Management, LLC telah mengungkapkan total kepemilikan 88 dalam pengajuan SEC terbaru mereka. Nilai portofolio terbaru dihitung sebesar $ 86,201,000 USD. Aset yang Dikelola (AUM) sebenarnya adalah nilai ini ditambah kas (yang tidak diungkapkan). Aset-aset utama LaSalle Street Capital Management, LLC adalah iShares Trust - iShares 1-5 Year Investment Grade Corporate Bond ETF (US:IGSB) , Thermo Fisher Scientific Inc. (US:TMO) , The Walt Disney Company (US:DIS) , Ally Financial Inc. (US:ALLY) , and Dollar General Corporation (US:DG) . Posisi baru LaSalle Street Capital Management, LLC meliputi: Tapestry, Inc. (US:TPR) , PDC Energy Inc (US:PDCE) , Mobile Mini, Inc. (US:MINI) , .
Peningkatan Tertinggi Kuartal Ini
Kami menggunakan perubahan dalam alokasi portofolio karena ini adalah metrik yang paling bermakna. Perubahan dapat disebabkan oleh perdagangan atau perubahan harga saham.
| Keamanan | Saham (MM) |
Nilai (Juta Dolar AS) |
Portfolio % | ΔPorsyento ng Portfolio |
|---|---|---|---|---|
| 0.07 | 1.95 | 2.2645 | 2.2645 | |
| 0.03 | 0.74 | 0.8585 | 0.8585 | |
| 0.05 | 1.74 | 2.0174 | 0.4086 | |
| 0.02 | 2.60 | 3.0104 | 0.3662 | |
| 0.01 | 0.28 | 0.3295 | 0.3295 | |
| 0.01 | 2.44 | 2.8352 | 0.3080 | |
| 0.01 | 0.20 | 0.2355 | 0.2355 | |
| 0.00 | 1.54 | 1.7877 | 0.1895 | |
| 0.01 | 2.25 | 2.6079 | 0.1567 | |
| 0.01 | 1.47 | 1.7007 | 0.1446 |
Penurunan Tertinggi Kuartal Ini
Kami menggunakan perubahan dalam alokasi portofolio karena ini adalah metrik yang paling bermakna. Perubahan dapat disebabkan oleh perdagangan atau perubahan harga saham.
| Keamanan | Saham (MM) |
Nilai (Juta Dolar AS) |
Portfolio % | ΔPorsyento ng Portfolio |
|---|---|---|---|---|
| 0.04 | 1.28 | 1.4849 | -1.3535 | |
| 0.05 | 1.20 | 1.3898 | -0.6683 | |
| 0.00 | 0.00 | -0.4259 | ||
| 0.07 | 0.85 | 0.9849 | -0.4086 | |
| 0.02 | 2.38 | 2.7645 | -0.2857 | |
| 0.01 | 1.71 | 1.9849 | -0.2627 | |
| 0.02 | 2.74 | 3.1751 | -0.2565 | |
| 0.02 | 1.69 | 1.9652 | -0.2309 | |
| 0.01 | 0.85 | 0.9849 | -0.2190 | |
| 0.00 | 0.00 | -0.1708 |
Pengajuan 13F dan Dana
Formulir ini diajukan pada 2019-10-28 untuk periode pelaporan 2019-09-30. Klik ikon tautan untuk melihat riwayat transaksi selengkapnya.
Tingkatkan ke versi premium untuk membuka data premium dan ekspor ke Excel. ![]() .
.
| Keamanan | Ketik | Harga Saham Rata-rata | Saham (MM) |
ΔSaham (%) |
ΔSaham (%) |
Nilai ($MM) |
Portpolyo (%) |
ΔPortofolio (%) |
|
|---|---|---|---|---|---|---|---|---|---|
| IGSB / iShares Trust - iShares 1-5 Year Investment Grade Corporate Bond ETF | 0.09 | 0.00 | 4.90 | 0.43 | 5.6890 | -0.0241 | |||
| TMO / Thermo Fisher Scientific Inc. | 0.02 | -0.81 | 4.62 | -1.62 | 5.3538 | -0.1347 | |||
| DIS / The Walt Disney Company | 0.02 | 0.00 | 2.74 | -6.68 | 3.1751 | -0.2565 | |||
| ALLY / Ally Financial Inc. | 0.08 | -2.42 | 2.68 | 4.45 | 3.1055 | 0.1068 | |||
| DG / Dollar General Corporation | 0.02 | -2.39 | 2.60 | 14.82 | 3.0104 | 0.3662 | |||
| AAPL / Apple Inc. | 0.01 | 0.00 | 2.44 | 13.15 | 2.8352 | 0.3080 | |||
| ADS / Bread Financial Holdings Inc | 0.02 | 0.00 | 2.38 | -8.59 | 2.7645 | -0.2857 | |||
| AAP / Advance Auto Parts, Inc. | 0.01 | 0.00 | 2.25 | 7.30 | 2.6079 | 0.1567 | |||
| LITE / Lumentum Holdings Inc. | 0.04 | -1.93 | 2.17 | -1.67 | 2.5220 | -0.0649 | |||
| SWK / Stanley Black & Decker, Inc. | 0.01 | 0.00 | 2.12 | -0.09 | 2.4628 | -0.0234 | |||
| TPR / Tapestry, Inc. | 0.07 | 1.95 | 2.2645 | 2.2645 | |||||
| PEP / PepsiCo, Inc. | 0.01 | 0.00 | 1.90 | 4.52 | 2.2018 | 0.0771 | |||
| MSFT / Microsoft Corporation | 0.01 | 0.00 | 1.86 | 3.78 | 2.1635 | 0.0611 | |||
| V / Visa Inc. | 0.01 | 0.00 | 1.82 | -0.87 | 2.1113 | -0.0368 | |||
| CELG / Celgene Corp. | 0.02 | -8.45 | 1.79 | -1.65 | 2.0765 | -0.0529 | |||
| SWM / Schweitzer-Mauduit International, Inc. | 0.05 | 12.06 | 1.74 | 26.47 | 2.0174 | 0.4086 | |||
| UNH / UnitedHealth Group Incorporated | 0.01 | 0.00 | 1.71 | -10.93 | 1.9849 | -0.2627 | |||
| XOM / Exxon Mobil Corporation | 0.02 | -2.04 | 1.69 | -9.75 | 1.9652 | -0.2309 | |||
| GOOGL / Alphabet Inc. | 0.00 | 0.00 | 1.54 | 12.81 | 1.7877 | 0.1895 | |||
| DLR / Digital Realty Trust, Inc. | 0.01 | 0.00 | 1.47 | 10.23 | 1.7007 | 0.1446 | |||
| DXC / DXC Technology Company | 0.04 | -1.36 | 1.28 | -47.24 | 1.4849 | -1.3535 | |||
| AXP / American Express Company | 0.01 | -2.72 | 1.27 | -6.83 | 1.4721 | -0.1214 | |||
| ORCL / Oracle Corporation | 0.02 | 0.00 | 1.25 | -3.40 | 1.4489 | -0.0639 | |||
| KO / The Coca-Cola Company | 0.02 | -3.39 | 1.24 | 3.33 | 1.4408 | 0.0345 | |||
| KBR / KBR, Inc. | 0.05 | -30.79 | 1.20 | -31.89 | 1.3898 | -0.6683 | |||
| CME / CME Group Inc. | 0.01 | 0.00 | 1.15 | 8.92 | 1.3318 | 0.0986 | |||
| MMC / Marsh & McLennan Companies, Inc. | 0.01 | 0.00 | 1.14 | 0.35 | 1.3271 | -0.0067 | |||
| AMAT / Applied Materials, Inc. | 0.02 | 0.00 | 1.11 | 11.10 | 1.2888 | 0.1188 | |||
| CNQ / Canadian Natural Resources Limited | 0.04 | 0.00 | 1.09 | -1.27 | 1.2656 | -0.0272 | |||
| WNS / WNS (Holdings) Limited | 0.02 | -5.30 | 1.05 | -5.99 | 1.2192 | -0.0888 | |||
| MCHP / Microchip Technology Incorporated | 0.01 | 0.00 | 1.03 | 7.18 | 1.1949 | 0.0705 | |||
| GOOG / Alphabet Inc. | 0.00 | -4.00 | 1.02 | 8.24 | 1.1891 | 0.0811 | |||
| NMRK / Newmark Group, Inc. | 0.11 | -1.83 | 0.97 | -0.92 | 1.1276 | -0.0202 | |||
| WMT / Walmart Inc. | 0.01 | 0.00 | 0.95 | 7.48 | 1.0998 | 0.0678 | |||
| ATH / Athene Holding Ltd - Class A | 0.02 | -2.18 | 0.94 | -4.46 | 1.0928 | -0.0608 | |||
| MCD / McDonald's Corporation | 0.00 | 0.00 | 0.91 | 3.40 | 1.0592 | 0.0260 | |||
| FANG / Diamondback Energy, Inc. | 0.01 | 0.00 | 0.85 | -17.49 | 0.9849 | -0.2190 | |||
| FOE / Ferro Corp. | 0.07 | -5.04 | 0.85 | -28.72 | 0.9849 | -0.4086 | |||
| WBA / Walgreens Boots Alliance, Inc. | 0.01 | 0.00 | 0.81 | 1.25 | 0.9408 | 0.0037 | |||
| PNC / The PNC Financial Services Group, Inc. | 0.01 | 0.00 | 0.80 | 2.16 | 0.9315 | 0.0119 | |||
| AMG / Affiliated Managers Group, Inc. | 0.01 | 0.00 | 0.79 | -9.52 | 0.9153 | -0.1049 | |||
| JCI / Johnson Controls International plc | 0.02 | 0.00 | 0.78 | 6.28 | 0.9025 | 0.0461 | |||
| FDX / FedEx Corporation | 0.01 | 0.00 | 0.74 | -11.31 | 0.8643 | -0.1185 | |||
| PDCE / PDC Energy Inc | 0.03 | 0.74 | 0.8585 | 0.8585 | |||||
| GLW / Corning Incorporated | 0.03 | 0.00 | 0.73 | -14.22 | 0.8469 | -0.1488 | |||
| BCO / The Brink's Company | 0.01 | 0.00 | 0.69 | 2.21 | 0.8063 | 0.0107 | |||
| ANIP / ANI Pharmaceuticals, Inc. | 0.01 | 0.00 | 0.69 | -11.37 | 0.7958 | -0.1098 | |||
| NNN / NNN REIT, Inc. | 0.01 | 0.00 | 0.57 | 6.39 | 0.6566 | 0.0342 | |||
| MO / Altria Group, Inc. | 0.01 | 0.00 | 0.54 | -13.65 | 0.6311 | -0.1060 | |||
| CSCO / Cisco Systems, Inc. | 0.01 | 0.00 | 0.53 | -9.76 | 0.6114 | -0.0719 | |||
| VCTR / Victory Capital Holdings, Inc. | 0.03 | 0.00 | 0.51 | -10.51 | 0.5928 | -0.0753 | |||
| UMPQ / Umpqua Holdings Corp | 0.03 | 0.00 | 0.49 | -0.80 | 0.5742 | -0.0096 | |||
| DLTR / Dollar Tree, Inc. | 0.00 | 0.00 | 0.49 | 6.26 | 0.5708 | 0.0290 | |||
| PNFP / Pinnacle Financial Partners, Inc. | 0.01 | 0.00 | 0.46 | -1.28 | 0.5383 | -0.0116 | |||
| HTA / Healthcare Realty Trust Inc - Class A | 0.01 | 0.00 | 0.42 | 7.05 | 0.4930 | 0.0285 | |||
| SNX / TD SYNNEX Corporation | 0.00 | 0.00 | 0.42 | 14.56 | 0.4838 | 0.0579 | |||
| BRKS / Brooks Automation, Inc. | 0.01 | -4.33 | 0.41 | -8.50 | 0.4745 | -0.0485 | |||
| WTFC / Wintrust Financial Corporation | 0.01 | 0.00 | 0.40 | -11.58 | 0.4606 | -0.0648 | |||
| CUBI / Customers Bancorp, Inc. | 0.02 | 0.00 | 0.38 | -1.29 | 0.4455 | -0.0097 | |||
| LBRDA / Liberty Broadband Corporation | 0.00 | 0.00 | 0.36 | 4.39 | 0.4141 | 0.0140 | |||
| SYNH / Syneos Health Inc - Class A | 0.01 | 0.00 | 0.35 | 3.87 | 0.4049 | 0.0117 | |||
| AMN / AMN Healthcare Services, Inc. | 0.01 | 0.00 | 0.34 | 6.17 | 0.3991 | 0.0200 | |||
| MED / Medifast, Inc. | 0.00 | 59.91 | 0.34 | 28.90 | 0.3933 | 0.0856 | |||
| ECHO / Echo Global Logistics Inc | 0.01 | 0.00 | 0.33 | 8.44 | 0.3875 | 0.0271 | |||
| OFC / Corporate Office Properties Trust | 0.01 | 0.00 | 0.33 | 13.10 | 0.3805 | 0.0412 | |||
| DORM / Dorman Products, Inc. | 0.00 | 0.00 | 0.33 | -8.91 | 0.3793 | -0.0407 | |||
| DOC / Healthpeak Properties, Inc. | 0.02 | 0.00 | 0.32 | 1.89 | 0.3747 | 0.0038 | |||
| ABT / Abbott Laboratories | 0.00 | 0.00 | 0.30 | -0.66 | 0.3492 | -0.0053 | |||
| PRIM / Primoris Services Corporation | 0.02 | 0.00 | 0.30 | -6.29 | 0.3457 | -0.0264 | |||
| TSC / Tristate Capital Holdings Inc | 0.01 | 0.00 | 0.29 | -1.35 | 0.3399 | -0.0076 | |||
| BMY / Bristol-Myers Squibb Company | 0.01 | 0.00 | 0.28 | 12.20 | 0.3306 | 0.0334 | |||
| MINI / Mobile Mini, Inc. | 0.01 | 0.28 | 0.3295 | 0.3295 | |||||
| NSA / National Storage Affiliates Trust | 0.01 | 0.00 | 0.28 | 15.23 | 0.3248 | 0.0405 | |||
| ABBV / AbbVie Inc. | 0.00 | 0.00 | 0.28 | 4.12 | 0.3225 | 0.0101 | |||
| YELP / Yelp Inc. | 0.01 | 0.00 | 0.27 | 1.87 | 0.3167 | 0.0031 | |||
| CONE / CyrusOne Inc | 0.00 | -38.52 | 0.27 | -15.84 | 0.3144 | -0.0624 | |||
| VG / Venture Global, Inc. | 0.02 | 0.00 | 0.27 | -0.37 | 0.3144 | -0.0039 | |||
| OMCL / Omnicell, Inc. | 0.00 | 0.00 | 0.27 | -15.99 | 0.3109 | -0.0623 | |||
| BCOR / Grayscale Funds Trust - Grayscale Bitcoin Adopters ETF | 0.01 | 0.00 | 0.27 | -28.88 | 0.3086 | -0.1290 | |||
| PCRX / Pacira BioSciences, Inc. | 0.01 | 0.00 | 0.26 | -12.29 | 0.2981 | -0.0447 | |||
| YETI / YETI Holdings, Inc. | 0.01 | 0.00 | 0.25 | -3.42 | 0.2947 | -0.0131 | |||
| CBRL / Cracker Barrel Old Country Store, Inc. | 0.00 | 0.00 | 0.24 | -4.72 | 0.2807 | -0.0164 | |||
| TPIC / TPI Composites, Inc. | 0.01 | 0.00 | 0.23 | -23.95 | 0.2726 | -0.0889 | |||
| PINC / Premier, Inc. | 0.01 | 0.00 | 0.22 | -26.09 | 0.2564 | -0.0935 | |||
| CRL / Charles River Laboratories International, Inc. | 0.00 | 0.00 | 0.21 | -6.64 | 0.2448 | -0.0196 | |||
| SUSB / iShares Trust - iShares ESG Aware 1-5 Year USD Corporate Bond ETF | 0.01 | 0.00 | 0.21 | 0.49 | 0.2401 | -0.0009 | |||
| CVX / Chevron Corporation | 0.00 | 0.00 | 0.21 | -5.05 | 0.2401 | -0.0149 | |||
| CAL / Caleres, Inc. | 0.01 | 0.20 | 0.2355 | 0.2355 | |||||
| CDEV / Centennial Resource Development Inc. - Class A | 0.00 | -100.00 | 0.00 | -100.00 | -0.1708 | ||||
| SRCI / SRC Energy Inc | 0.00 | -100.00 | 0.00 | -100.00 | -0.4259 |